Visualization research tool PowerPoint Presentation Templates and Google Slides
-
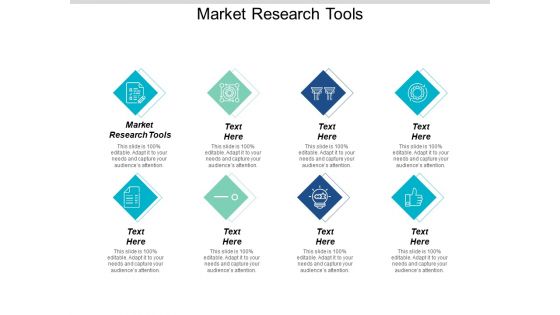
Market Research Tools Chart Presentation Visual Aids
This is a market research tools chart presentation visual aids. This is a eight stage process. The stages in this process are price analysis, target market analysis, deontic correction, corrective analysis, location analysis report, analysis report, marketing plans, identify trends.
-
Market Research Tools Ppt PowerPoint Presentation Professional Visuals Cpb
This is a market research tools ppt powerpoint presentation professional visuals cpb. This is a eight stage process. The stages in this process are market research tools.
-
Graphical Representation Of Research IT Finereport As Visualization Research Tool Structure PDF
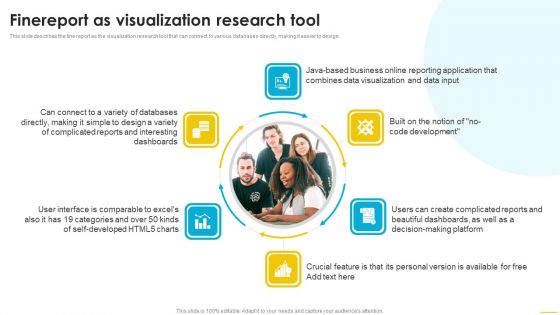
This slide describes the fine report as the visualization research tool that can connect to various databases directly, making it easier to design. Presenting graphical representation of research it finereport as visualization research tool structure pdf to provide visual cues and insights. Share and navigate important information on eight stages that need your due attention. This template can be used to pitch topics like application, dashboards, databases. In addtion, this PPT design contains high resolution images, graphics, etc, that are easily editable and available for immediate download.
-
Graphical Representation Of Research IT Tableau As Visualization Research Tool Graphics PDF
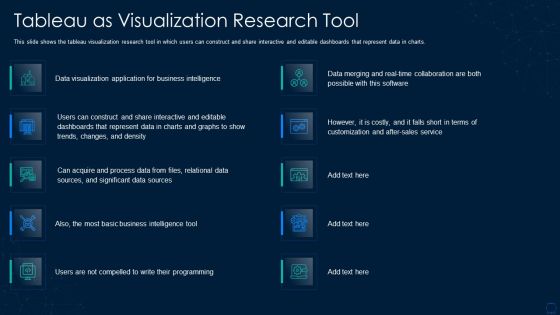
This slide shows the tableau visualization research tool in which users can construct and share interactive and editable dashboards that represent data in charts. Deliver and pitch your topic in the best possible manner with this graphical representation of research it tableau as visualization research tool graphics pdf. Use them to share invaluable insights on process data, sources, sales, application and impress your audience. This template can be altered and modified as per your expectations. So, grab it now.
-
Graphical Representation Of Research IT Google Charts Tool For Data Visualization Introduction PDF
This slide depicts google charts as the tool for data visualization, which can extract data from various sources, including SQL, databases, google sheets. This is a graphical representation of research it google charts tool for data visualization introduction pdf template with various stages. Focus and dispense information on five stages using this creative set, that comes with editable features. It contains large content boxes to add your information on topics like dynamic, databases, sources, technology. You can also showcase facts, figures, and other relevant content using this PPT layout. Grab it now.
-
Departments Of Visualization Research Tableau As Visualization Research Tool Demonstration PDF
This slide shows the tableau visualization research tool in which users can construct and share interactive and editable dashboards that represent data in charts.Presenting Departments Of Visualization Research Tableau As Visualization Research Tool Demonstration PDF to provide visual cues and insights. Share and navigate important information on ten stages that need your due attention. This template can be used to pitch topics like Business Intelligence, Dashboards That Represent, Business Intelligence In addtion, this PPT design contains high resolution images, graphics, etc, that are easily editable and available for immediate download.
-
Departments Of Visualization Research Finereport As Visualization Research Tool Elements PDF
This slide describes the fine report as the visualization research tool that can connect to various databases directly, making it easier to design.Presenting Departments Of Visualization Research Finereport As Visualization Research Tool Elements PDF to provide visual cues and insights. Share and navigate important information on six stages that need your due attention. This template can be used to pitch topics like Reporting Application, Visualization And Data, Complicated Reports In addtion, this PPT design contains high resolution images, graphics, etc, that are easily editable and available for immediate download.
-
Departments Of Visualization Research Google Charts Tool For Data Visualization Themes PDF
This slide depicts google charts as the tool for data visualization, which can extract data from various sources, including SQL, databases, google sheets.This is a Departments Of Visualization Research Google Charts Tool For Data Visualization Themes PDF template with various stages. Focus and dispense information on five stages using this creative set, that comes with editable features. It contains large content boxes to add your information on topics like Popular Free Alternative, Create Dynamic Data, Including SQL Databases You can also showcase facts, figures, and other relevant content using this PPT layout. Grab it now.
-
Departments Of Visualization Research Highcharts As Data Visualization Research Tool Ideas PDF
This slide represents another data visualization research tool that provides a high level of compatibility and is also a popular tool for commercial use.Presenting Departments Of Visualization Research Highcharts As Data Visualization Research Tool Ideas PDF to provide visual cues and insights. Share and navigate important information on four stages that need your due attention. This template can be used to pitch topics like Integrate Interactive, Necessitates The Purchase, Javascript Chart Framework In addtion, this PPT design contains high resolution images, graphics, etc, that are easily editable and available for immediate download.
-
Finereport As Visualization Research Tool Inspiration PDF
This slide describes the fine report as the visualization research tool that can connect to various databases directly, making it easier to design. Get a simple yet stunning designed Finereport As Visualization Research Tool Inspiration PDF. It is the best one to establish the tone in your meetings. It is an excellent way to make your presentations highly effective. So, download this PPT today from Slidegeeks and see the positive impacts. Our easy to edit Finereport As Visualization Research Tool Inspiration PDF can be your go to option for all upcoming conferences and meetings. So, what are you waiting for Grab this template today.
-
Highcharts As Data Visualization Research Tool Elements PDF
This slide represents another data visualization research tool that provides a high level of compatibility and is also a popular tool for commercial use. Present like a pro with Highcharts As Data Visualization Research Tool Elements PDF Create beautiful presentations together with your team, using our easy to use presentation slides. Share your ideas in real time and make changes on the fly by downloading our templates. So whether you are in the office, on the go, or in a remote location, you can stay in sync with your team and present your ideas with confidence. With Slidegeeks presentation got a whole lot easier. Grab these presentations today.
-
Tableau As Visualization Research Tool Inspiration PDF
This slide shows the tableau visualization research tool in which users can construct and share interactive and editable dashboards that represent data in charts. Find highly impressive Tableau As Visualization Research Tool Inspiration PDF on Slidegeeks to deliver a meaningful presentation. You can save an ample amount of time using these presentation templates. No need to worry to prepare everything from scratch because Slidegeeks experts have already done a huge research and work for you. You need to download Tableau As Visualization Research Tool Inspiration PDF for your upcoming presentation. All the presentation templates are 100 percent editable and you can change the color and personalize the content accordingly. Download now.
-
D3 Data Driven Documents As Data Visualization Research Tool Brochure PDF
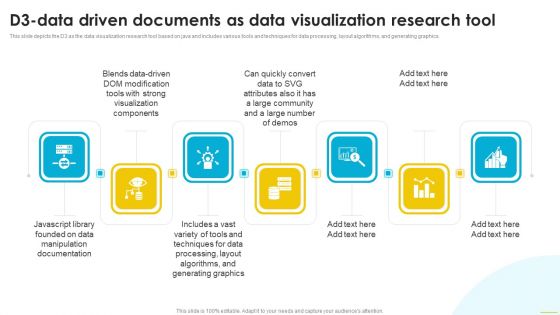
This slide depicts the D3 as the data visualization research tool based on java and includes various tools and techniques for data processing, layout algorithms, and generating graphics. Crafting an eye catching presentation has never been more straightforward. Let your presentation shine with this tasteful yet straightforward D3 Data Driven Documents As Data Visualization Research Tool Brochure PDF template. It offers a minimalistic and classy look that is great for making a statement. The colors have been employed intelligently to add a bit of playfulness while still remaining professional. Construct the ideal D3 Data Driven Documents As Data Visualization Research Tool Brochure PDF that effortlessly grabs the attention of your audience Begin now and be certain to wow your customers.
-
Branches For Visualization Research And Development Google Charts Tool For Data Elements PDF
This slide depicts google charts as the tool for data visualization, which can extract data from various sources, including SQL, databases, google sheets. Do you have an important presentation coming up Are you looking for something that will make your presentation stand out from the rest Look no further than Branches For Visualization Research And Development Google Charts Tool For Data Elements PDF. With our professional designs, you can trust that your presentation will pop and make delivering it a smooth process. And with Slidegeeks, you can trust that your presentation will be unique and memorable. So why wait Grab Branches For Visualization Research And Development Google Charts Tool For Data Elements PDF today and make your presentation stand out from the rest.


