Visualization and data PowerPoint Presentation Templates and Google Slides
-
Data And Information Visualization Ppt PowerPoint Presentation Complete With Slides
This presentation slide from our repository helps you draw or design a business idea that address the audiences pain points and simplifies their experience. This Data And Information Visualization Ppt PowerPoint Presentation Complete With Slides provides a comprehensive yet easy to comprehend document to draw attention to your value proposition. Help audience navigate your business with this forty seven slide complete deck. Draw an actionable customer service flow chart to win and retain your customers back. The presentation template is also equipped to do this with its 100 percent editable and customizable capability. Download now.
-
Data Visualization And Predictive Analysis Chart Ppt Slides
This is a data visualization and predictive analysis chart ppt slides. This is a nine stage process. The stages in this process are business requirement, data exploration, data selection, data preparation, design model, validate model, deploy model, analyze results, update model, revalidate.
-
Data Exploration And Visualization Virtual Machine Ppt PowerPoint Presentation Infographics Diagrams
This is a data exploration and visualization virtual machine ppt powerpoint presentation infographics diagrams. This is a seven stage process. The stages in this process are data, analysis, data science, information science.
-
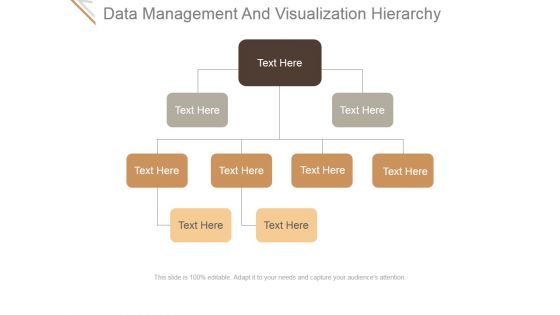
Data Management And Visualization Hierarchy Ppt PowerPoint Presentation Inspiration
This is a data management and visualization hierarchy ppt powerpoint presentation inspiration. This is a four stage process. The stages in this process are business, marketing, hierarchy, visualization, data management.
-
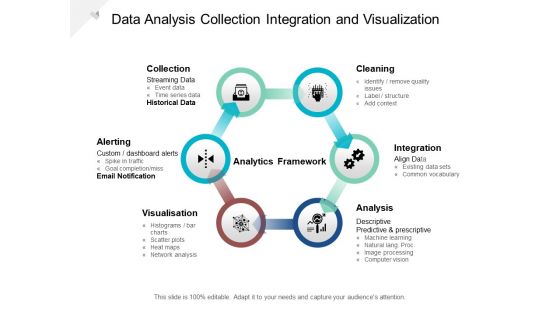
Data Analysis Collection Integration And Visualization Ppt PowerPoint Presentation Summary Graphics Tutorials Cpb
This is a data analysis collection integration and visualization ppt powerpoint presentation summary graphics tutorials cpb. This is a six stage process. The stages in this process are data analysis, analytics architecture, analytics framework.
-
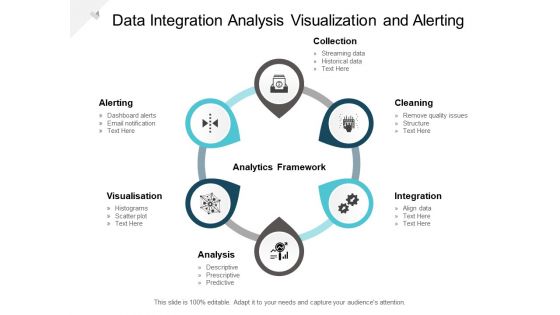
Data Integration Analysis Visualization And Alerting Ppt PowerPoint Presentation Gallery Deck Cpb
This is a data integration analysis visualization and alerting ppt powerpoint presentation gallery deck cpb. This is a six stage process. The stages in this process are data analysis, analytics architecture, analytics framework.
-
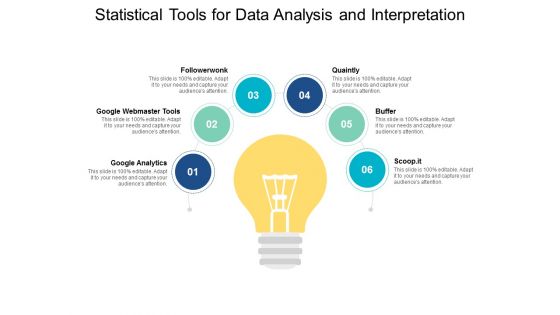
Statistical Tools For Data Analysis And Interpretation Ppt PowerPoint Presentation Portfolio Visuals
Presenting this set of slides with name Statistical Tools For Data Analysis And Interpretation Ppt PowerPoint Presentation Portfolio Visuals. This is a six process. The stages in this process are marketing, management, measuring results. This is a completely editable PowerPoint presentation and is available for immediate download. Download now and impress your audience.
-
Business Plan And Strategy 4 Stages For Data Visualization Strategic Planning Template Ppt Slide
Your Listeners Will Never Doodle. Our business plan and strategy 4 stages for data visualization strategic planning template ppt slide Powerpoint Templates Will Hold Their Concentration. Do The One Thing With Your Thoughts. Uphold Custom With Our Process and Flows Powerpoint Templates.
-
Data Cleansing Model With Visualization And Integration Ppt Slides Guidelines PDF
Presenting this set of slides with name data cleansing model with visualization and integration ppt slides guidelines pdf. This is a six stage process. The stages in this process are collection, cleaning, integration, analysis, visualization, alerting. This is a completely editable PowerPoint presentation and is available for immediate download. Download now and impress your audience.
-
Theoretical Perspective On Media And Technology With Data Visualization Ppt PowerPoint Presentation File Background Image PDF
Presenting this set of slides with name theoretical perspective on media and technology with data visualization ppt powerpoint presentation file background image pdf. This is a three stage process. The stages in this process are methodology, visualization, criteria. This is a completely editable PowerPoint presentation and is available for immediate download. Download now and impress your audience.
-
Discounted Free Cash Flow DCF Technique Data Set Mergers And Acquisitions Synergy Ppt Summary Visual Aids PDF
Deliver an awe inspiring pitch with this creative discounted free cash flow dcf technique data set mergers and acquisitions synergy ppt summary visual aids pdf bundle. Topics like growth, cost, average, equity, debt can be discussed with this completely editable template. It is available for immediate download depending on the needs and requirements of the user.
-
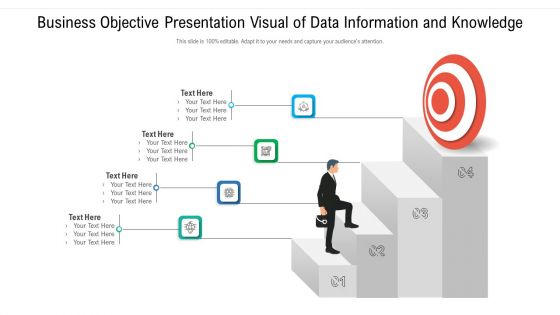
Business Objective Presentation Visual Of Data Information And Knowledge Information PDF
Persuade your audience using this business objective presentation visual of data information and knowledge information pdf. This PPT design covers four stages, thus making it a great tool to use. It also caters to a variety of topics including business objective presentation visual of data information and knowledge. Download this PPT design now to present a convincing pitch that not only emphasizes the topic but also showcases your presentation skills.
-
Strengths And Weaknesses Diagram Visual For List Data Structure Structure PDF
Persuade your audience using this strengths and weaknesses diagram visual for list data structure structure pdf. This PPT design covers two stages, thus making it a great tool to use. It also caters to a variety of topics including weaknesses diagram visual for list data structure. Download this PPT design now to present a convincing pitch that not only emphasizes the topic but also showcases your presentation skills.
-
Data Analytics Tasks And Skills Of Database Administrator Ppt Visual Aids PDF
This slide depicts the tasks performed by a Database Administrator and skills that he should possess, such as backup and recovery, data modeling and design, and distributive computing. Presenting data analytics tasks and skills of database administrator ppt visual aids pdf to provide visual cues and insights. Share and navigate important information on six stages that need your due attention. This template can be used to pitch topics like data security, database systems, distributive computing, information. In addtion, this PPT design contains high resolution images, graphics, etc, that are easily editable and available for immediate download.
-
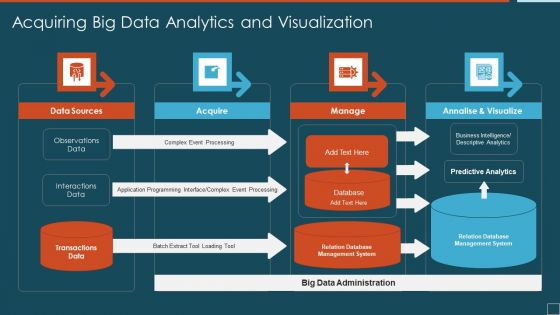
Acquiring Big Data Analytics And Visualization Ideas PDF
Presenting acquiring big data analytics and visualization ideas pdf to dispense important information. This template comprises four stages. It also presents valuable insights into the topics including data sources, acquire, manage. This is a completely customizable PowerPoint theme that can be put to use immediately. So, download it and address the topic impactfully.
-
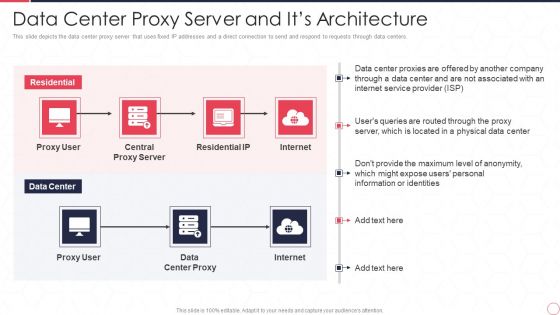
Reverse Proxy Server IT Data Center Proxy Server And Its Architecture Ppt Visual Aids Files PDF
This slide depicts the data center proxy server that uses fixed IP addresses and a direct connection to send and respond to requests through data centers. This is a reverse proxy server it data center proxy server and its architecture ppt visual aids files pdf template with various stages. Focus and dispense information on one stages using this creative set, that comes with editable features. It contains large content boxes to add your information on topics like residential, data center, proxy user, central, proxy server. You can also showcase facts, figures, and other relevant content using this PPT layout. Grab it now.
-
Table Of Contents For Data And Information Visualization Background PDF
Explore a selection of the finest Table Of Contents For Data And Information Visualization Background PDF here. With a plethora of professionally designed and pre made slide templates, you can quickly and easily find the right one for your upcoming presentation. You can use our Table Of Contents For Data And Information Visualization Background PDF to effectively convey your message to a wider audience. Slidegeeks has done a lot of research before preparing these presentation templates. The content can be personalized and the slides are highly editable. Grab templates today from Slidegeeks.
-
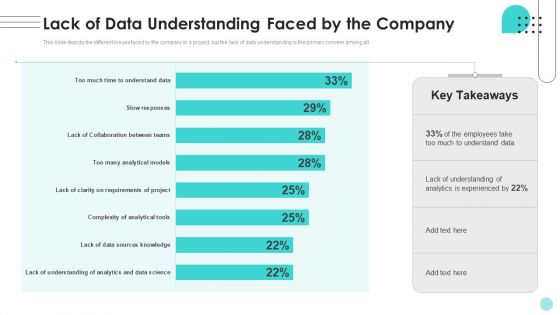
Branches For Visualization Research And Development Lack Of Data Understanding Faced Introduction PDF
This slide depicts the different issues faced by the company in a project, but the lack of data understanding is the primary concern among all. If you are looking for a format to display your unique thoughts, then the professionally designed Branches For Visualization Research And Development Lack Of Data Understanding Faced Introduction PDF is the one for you. You can use it as a Google Slides template or a PowerPoint template. Incorporate impressive visuals, symbols, images, and other charts. Modify or reorganize the text boxes as you desire. Experiment with shade schemes and font pairings. Alter, share or cooperate with other people on your work. Download Branches For Visualization Research And Development Lack Of Data Understanding Faced Introduction PDF and find out how to give a successful presentation. Present a perfect display to your team and make your presentation unforgettable.
-
Information Science Tasks And Skills Of Data Architect Ppt PowerPoint Presentation Show Visuals PDF
This slide defines the data architects tasks in data science projects and their skills, covering data warehousing solutions, database knowledge, ETL, spreadsheets, and data modeling.This is a Information Science Tasks And Skills Of Data Architect Ppt PowerPoint Presentation Show Visuals PDF template with various stages. Focus and dispense information on six stages using this creative set, that comes with editable features. It contains large content boxes to add your information on topics like System Development, Data Modeling, Database Architecture. You can also showcase facts, figures, and other relevant content using this PPT layout. Grab it now.
-
Information Science Tasks And Skills Of Database Administrator Ppt PowerPoint Presentation Visual Aids Layouts PDF
This slide depicts the tasks performed by a Database Administrator and skills that he should possess, such as backup recovery, data modeling design, and distributive computing.Presenting Information Science Tasks And Skills Of Database Administrator Ppt PowerPoint Presentation Visual Aids Layouts PDF to provide visual cues and insights. Share and navigate important information on six stages that need your due attention. This template can be used to pitch topics like Business Knowledge, Database Systems, Distributive Computing. In addtion, this PPT design contains high resolution images, graphics, etc, that are easily editable and available for immediate download.
-
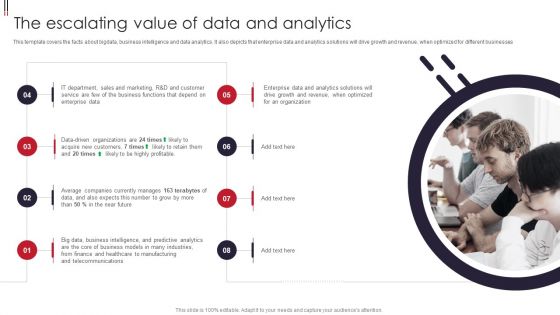
Information Visualizations Playbook The Escalating Value Of Data And Analytics Portrait PDF
This template covers the facts about bigdata, business intelligence and data analytics. It also depicts that enterprise data and analytics solutions will drive growth and revenue, when optimized for different businesses. This is a Information Visualizations Playbook The Escalating Value Of Data And Analytics Portrait PDF template with various stages. Focus and dispense information on eight stages using this creative set, that comes with editable features. It contains large content boxes to add your information on topics like Data Driven Organizations, Acquire New Customers, Profitable. You can also showcase facts, figures, and other relevant content using this PPT layout. Grab it now.
-
Data Visualization And User Profiling Icon Ppt Styles Slide PDF
Presenting Data Visualization And User Profiling Icon Ppt Styles Slide PDF to dispense important information. This template comprises three stages. It also presents valuable insights into the topics including Data Visualization, User Profiling, Icon. This is a completely customizable PowerPoint theme that can be put to use immediately. So, download it and address the topic impactfully.
-
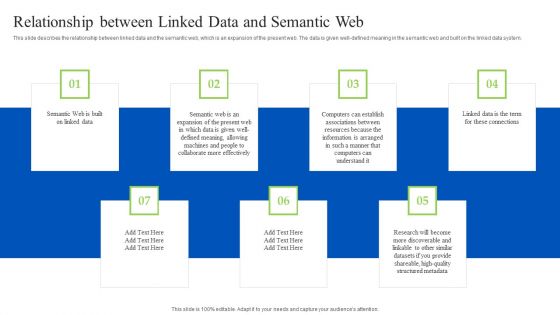
Linked Data Visualization Relationship Between Linked Data And Semantic Web Inspiration PDF
This slide describes the relationship between linked data and the semantic web, which is an expansion of the present web. The data is given well-defined meaning in the semantic web and built on the linked data system. Find highly impressive Linked Data Visualization Relationship Between Linked Data And Semantic Web Inspiration PDF on Slidegeeks to deliver a meaningful presentation. You can save an ample amount of time using these presentation templates. No need to worry to prepare everything from scratch because Slidegeeks experts have already done a huge research and work for you. You need to download Linked Data Visualization Relationship Between Linked Data And Semantic Web Inspiration PDF for your upcoming presentation. All the presentation templates are 100 percent editable and you can change the color and personalize the content accordingly. Download now.
-
Fintech And Business Data Mining Reconciliation Icon Ppt Visual Aids Background Images PDF
Persuade your audience using this Fintech And Business Data Mining Reconciliation Icon Ppt Visual Aids Background Images PDF. This PPT design covers one stages, thus making it a great tool to use. It also caters to a variety of topics including Fintech And Business, Data Mining Reconciliation, Icon. Download this PPT design now to present a convincing pitch that not only emphasizes the topic but also showcases your presentation skills.
-
Agenda For Data And Information Visualization Icons PDF
Find a pre designed and impeccable Agenda For Data And Information Visualization Icons PDF. The templates can ace your presentation without additional effort. You can download these easy to edit presentation templates to make your presentation stand out from others. So, what are you waiting for Download the template from Slidegeeks today and give a unique touch to your presentation.
-
Data And Information Visualization Issue Of Absence Of Goal Oriented Project Planning Demonstration PDF
This slide describes the lack of goal oriented project planning, which hampers the quality of the project that ultimately leads to the loss of the companys reputation. Boost your pitch with our creative Data And Information Visualization Issue Of Absence Of Goal Oriented Project Planning Demonstration PDF. Deliver an awe inspiring pitch that will mesmerize everyone. Using these presentation templates you will surely catch everyones attention. You can browse the ppts collection on our website. We have researchers who are experts at creating the right content for the templates. So you do not have to invest time in any additional work. Just grab the template now and use them.
-
Data And Information Visualization Overview And Objective Of Visualization Research Microsoft PDF
This slide depicts the overview and objective of visualization research which is to know the limitations of ideas and obtain more value from data. Create an editable Data And Information Visualization Overview And Objective Of Visualization Research Microsoft PDF that communicates your idea and engages your audience. Whether you are presenting a business or an educational presentation, pre designed presentation templates help save time. Data And Information Visualization Overview And Objective Of Visualization Research Microsoft PDF is highly customizable and very easy to edit, covering many different styles from creative to business presentations. Slidegeeks has creative team members who have crafted amazing templates. So, go and get them without any delay.
-
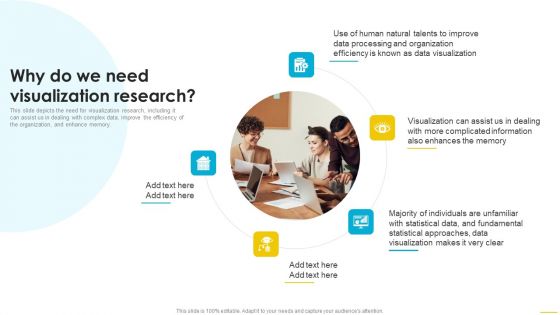
Data And Information Visualization Why Do We Need Visualization Research Summary PDF
This slide depicts the need for visualization research, including it can assist us in dealing with complex data, improve the efficiency of the organization, and enhance memory. Slidegeeks is one of the best resources for PowerPoint templates. You can download easily and regulate Data And Information Visualization Why Do We Need Visualization Research Summary PDF for your personal presentations from our wonderful collection. A few clicks is all it takes to discover and get the most relevant and appropriate templates. Use our Templates to add a unique zing and appeal to your presentation and meetings. All the slides are easy to edit and you can use them even for advertisement purposes.
-
Table Of Contents For Data And Information Visualization Tool Structure PDF
Whether you have daily or monthly meetings, a brilliant presentation is necessary. Table Of Contents For Data And Information Visualization Tool Structure PDF can be your best option for delivering a presentation. Represent everything in detail using Table Of Contents For Data And Information Visualization Tool Structure PDF and make yourself stand out in meetings. The template is versatile and follows a structure that will cater to your requirements. All the templates prepared by Slidegeeks are easy to download and edit. Our research experts have taken care of the corporate themes as well. So, give it a try and see the results.
-
Data And Information Visualization Visual Analytics Branch Of Visualization Research Designs PDF
This slide shows visual analytics, the last branch of visualization research, which emerged from the advancements in the other two branches and mainly focused on analytical reasoning. Make sure to capture your audiences attention in your business displays with our gratis customizable Data And Information Visualization Visual Analytics Branch Of Visualization Research Designs PDF. These are great for business strategies, office conferences, capital raising or task suggestions. If you desire to acquire more customers for your tech business and ensure they stay satisfied, create your own sales presentation with these plain slides.
-
Icons Slides For Data And Information Visualization Pictures PDF
Introducing our well designed Icons Slides For Data And Information Visualization Pictures PDF set of slides. The slide displays editable icons to enhance your visual presentation. The icons can be edited easily. So customize according to your business to achieve a creative edge. Download and share it with your audience.
-
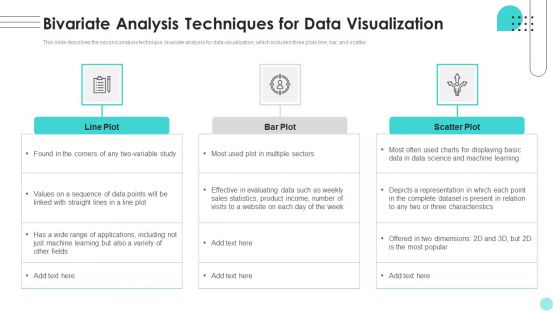
Branches For Visualization Research And Development Bivariate Analysis Techniques For Data Structure PDF
This slide describes the second analysis technique, bivariate analysis for data visualization, which includes three plots line, bar, and scatter. There are so many reasons you need a Branches For Visualization Research And Development Bivariate Analysis Techniques For Data Structure PDF. The first reason is you cant spend time making everything from scratch, Thus, Slidegeeks has made presentation templates for you too. You can easily download these templates from our website easily.
-
Branches For Visualization Research And Development D3 Data Driven Documents As Data Brochure PDF
This slide depicts the D3 as the data visualization research tool based on java and includes various tools and techniques for data processing, layout algorithms, and generating graphics. Do you have to make sure that everyone on your team knows about any specific topic I yes, then you should give Branches For Visualization Research And Development D3 Data Driven Documents As Data Brochure PDF a try. Our experts have put a lot of knowledge and effort into creating this impeccable Branches For Visualization Research And Development D3 Data Driven Documents As Data Brochure PDF. You can use this template for your upcoming presentations, as the slides are perfect to represent even the tiniest detail. You can download these templates from the Slidegeeks website and these are easy to edit. So grab these today.
-
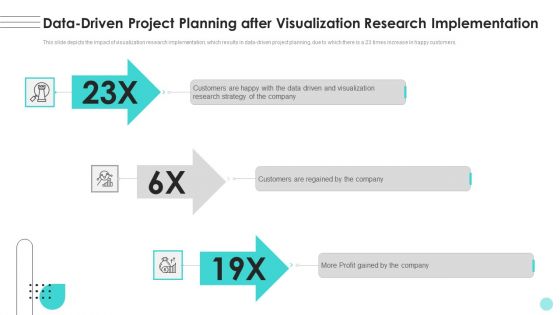
Branches For Visualization Research And Development Data Driven Project Planning Template PDF
This slide depicts the impact of visualization research implementation, which results in data-driven project planning, due to which there is a 23 times increase in happy customers. Get a simple yet stunning designed Branches For Visualization Research And Development Data Driven Project Planning Template PDF. It is the best one to establish the tone in your meetings. It is an excellent way to make your presentations highly effective. So, download this PPT today from Slidegeeks and see the positive impacts. Our easy-to-edit Branches For Visualization Research And Development Data Driven Project Planning Template PDF can be your go-to option for all upcoming conferences and meetings. So, what are you waiting for Grab this template today.
-
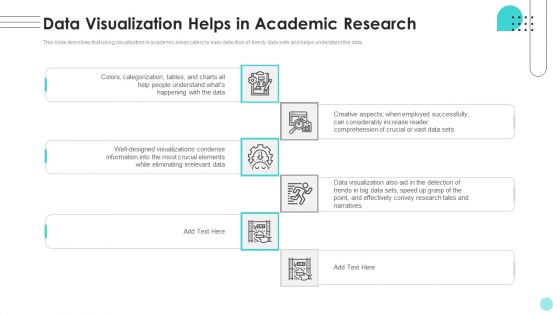
Branches For Visualization Research And Development Data Visualization Helps In Academic Download PDF
This slide describes that using visualization in academic areas caters to easy detection of trendy data sets and helps understand the data. From laying roadmaps to briefing everything in detail, our templates are perfect for you. You can set the stage with your presentation slides. All you have to do is download these easy-to-edit and customizable templates. Branches For Visualization Research And Development Data Visualization Helps In Academic Download PDF will help you deliver an outstanding performance that everyone would remember and praise you for. Do download this presentation today.
-
Branches For Visualization Research And Development Google Charts Tool For Data Elements PDF
This slide depicts google charts as the tool for data visualization, which can extract data from various sources, including SQL, databases, google sheets. Do you have an important presentation coming up Are you looking for something that will make your presentation stand out from the rest Look no further than Branches For Visualization Research And Development Google Charts Tool For Data Elements PDF. With our professional designs, you can trust that your presentation will pop and make delivering it a smooth process. And with Slidegeeks, you can trust that your presentation will be unique and memorable. So why wait Grab Branches For Visualization Research And Development Google Charts Tool For Data Elements PDF today and make your presentation stand out from the rest.
-
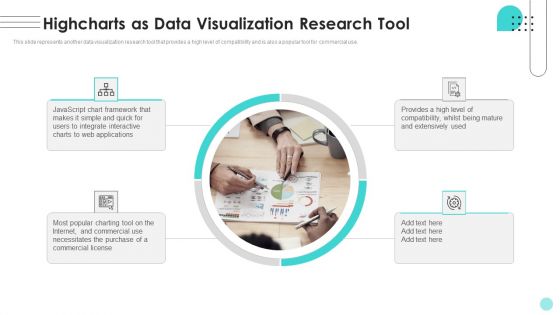
Branches For Visualization Research And Development Highcharts As Data Visualization Ideas PDF
This slide represents another data visualization research tool that provides a high level of compatibility and is also a popular tool for commercial use. Whether you have daily or monthly meetings, a brilliant presentation is necessary. Branches For Visualization Research And Development Highcharts As Data Visualization Ideas PDF can be your best option for delivering a presentation. Represent everything in detail using Branches For Visualization Research And Development Highcharts As Data Visualization Ideas PDF and make yourself stand out in meetings. The template is versatile and follows a structure that will cater to your requirements. All the templates prepared by Slidegeeks are easy to download and edit. Our research experts have taken care of the corporate themes as well. So, give it a try and see the results.
-
Business Intelligence Dashboard Icon For Data Analysis And Visualization Information PDF
Persuade your audience using this Business Intelligence Dashboard Icon For Data Analysis And Visualization Information PDF. This PPT design covers three stages, thus making it a great tool to use. It also caters to a variety of topics including Business Intelligence Dashboard Icon, Data Analysis And Visualization. Download this PPT design now to present a convincing pitch that not only emphasizes the topic but also showcases your presentation skills.
-
Procedure To Make Informed And Data Driven Decisions Ppt Show Visual Aids PDF
This slide represents the steps to be followed by enterprise to make better and informed decisions for business growth and development. It includes steps to make better and informed decisions such as know corporate vision, find data sources etc. Get a simple yet stunning designed Procedure To Make Informed And Data Driven Decisions Ppt Show Visual Aids PDF. It is the best one to establish the tone in your meetings. It is an excellent way to make your presentations highly effective. So, download this PPT today from Slidegeeks and see the positive impacts. Our easy to edit Procedure To Make Informed And Data Driven Decisions Ppt Show Visual Aids PDF can be your go to option for all upcoming conferences and meetings. So, what are you waiting for Grab this template today.
-
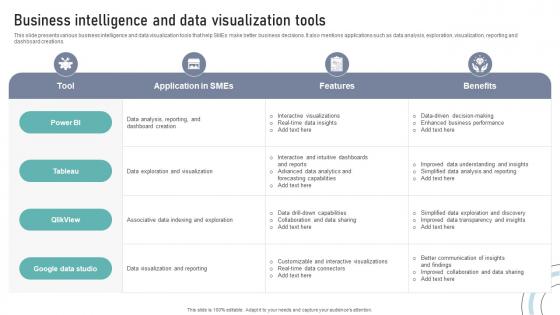
Business Intelligence And Data Visualization Tools DT SS V
This slide presents various business intelligence and data visualization tools that help SMEs make better business decisions. It also mentions applications such as data analysis, exploration, visualization, reporting and dashboard creations.Present like a pro with Business Intelligence And Data Visualization Tools DT SS V. Create beautiful presentations together with your team, using our easy-to-use presentation slides. Share your ideas in real-time and make changes on the fly by downloading our templates. So whether you are in the office, on the go, or in a remote location, you can stay in sync with your team and present your ideas with confidence. With Slidegeeks presentation got a whole lot easier. Grab these presentations today.
-
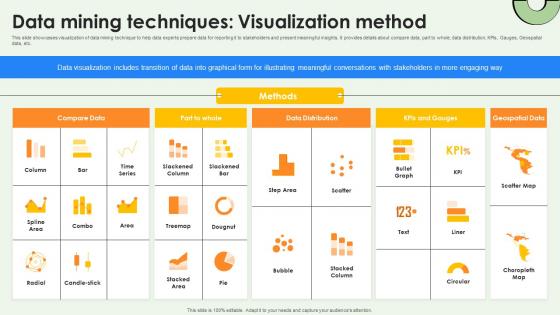
Data Warehousing And Data Mining Techniques Visualization Method AI SS V
This slide showcases visualization of data mining technique to help data experts prepare data for reporting it to stakeholders and present meaningful insights. It provides details about compare data, part to whole, data distribution, KPIs, Gauges, Geospatial data, etc. Find a pre-designed and impeccable Data Warehousing And Data Mining Techniques Visualization Method AI SS V. The templates can ace your presentation without additional effort. You can download these easy-to-edit presentation templates to make your presentation stand out from others. So, what are you waiting for Download the template from Slidegeeks today and give a unique touch to your presentation.
-
Statistical Tools For Evidence Dashboard For Data Visualization And Analytics
This slide represents the dashboard to track statistical data analysis process. The purpose of this slide is to provide a graphical representation of total sessions, bounce rate, goal completions, goal completion rate, top channels over time, etc. Are you in need of a template that can accommodate all of your creative concepts This one is crafted professionally and can be altered to fit any style. Use it with Google Slides or PowerPoint. Include striking photographs, symbols, depictions, and other visuals. Fill, move around, or remove text boxes as desired. Test out color palettes and font mixtures. Edit and save your work, or work with colleagues. Download Statistical Tools For Evidence Dashboard For Data Visualization And Analytics and observe how to make your presentation outstanding. Give an impeccable presentation to your group and make your presentation unforgettable.


