Visual graphs PowerPoint Presentation Templates and Google Slides
-
Graphic Designing And Visual Arts Company Profile Ppt PowerPoint Presentation Complete With Slides
Pitch yourself both in house and outside by utilizing this complete deck. This Graphic Designing And Visual Arts Company Profile Ppt PowerPoint Presentation Complete With Slides focuses on key fundamentals of the topic, displayed using different slides. With a total of fourty five slides, this template is the best tool you can use to persuade your audience. It will not only help you create great presentations but also induce strategic thinking because of its well researched content and graphics. You can easily personalize any of the elements to suit your unique business setting. Additionally, it can be saved in PNG, JPG, and PDF formats to save your time and resources.
-
Merchandising Of Eatables Visual Graphics Ppt PowerPoint Presentation Complete Deck With Slides
If designing a presentation takes a lot of your time and resources and you are looking for a better alternative, then this merchandising of eatables visual graphics ppt powerpoint presentation complete deck with slides is the right fit for you. This is a prefabricated set that can help you deliver a great presentation on the topic. All the twelve slides included in this sample template can be used to present a birds-eye view of the topic. These slides are also fully editable, giving you enough freedom to add specific details to make this layout more suited to your business setting. Apart from the content, all other elements like color, design, theme are also replaceable and editable. This helps in designing a variety of presentations with a single layout. Not only this, you can use this PPT design in formats like PDF, PNG, and JPG once downloaded. Therefore, without any further ado, download and utilize this sample presentation as per your liking.
-
Visual Communication Diagram Powerpoint Graphics
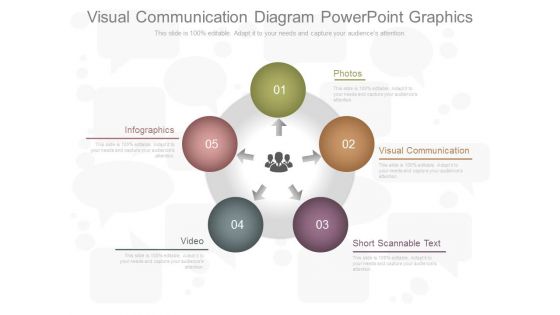
This is a visual communication diagram powerpoint graphics. This is a five stage process. The stages in this process are photos, visual communication, short scannable text, video, infographics.
-
Learning Graph With Cross Validation Score Ppt PowerPoint Presentation Visual Aids Inspiration
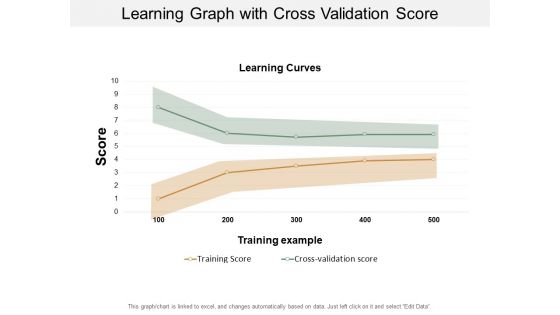
This is a learning graph with cross validation score ppt powerpoint presentation visual aids inspiration. This is a two stage process. The stages in this process are experience curve, learning curve.
-
Waterfall Graph Showing Monetary Transactions Ppt PowerPoint Presentation Ideas Visuals
This is a waterfall graph showing monetary transactions ppt powerpoint presentation ideas visuals. This is a three stage process. The stages in this process are profit and loss, balance sheet, income statement, benefit and loss.
-
Balance Sheet Graphical Representation Ppt PowerPoint Presentation Icon Visuals
This is a balance sheet graphical representation ppt powerpoint presentation icon visuals. This is a four stage process. The stages in this process are finance, business, management, strategy, analysis.
-
Financial Graph Ppt PowerPoint Presentation Visuals
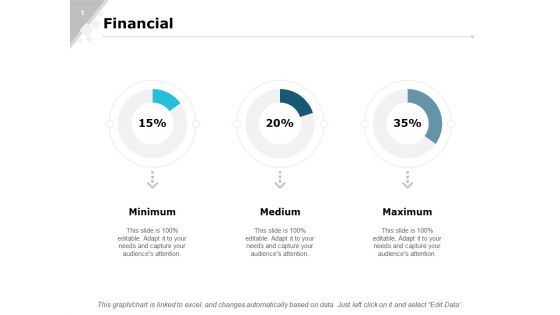
This is a financial graph ppt powerpoint presentation visuals. This is a three stage process. The stages in this process are finance, marketing, analysis, investment, million.
-
Bubble Chart Graph Ppt PowerPoint Presentation Gallery Visuals
Presenting this set of slides with name bubble chart graph ppt powerpoint presentation gallery visuals. The topics discussed in these slides are marketing, business, management, planning, strategy. This is a completely editable PowerPoint presentation and is available for immediate download. Download now and impress your audience.
-
Bar Graph Companys Business Model Canvas Ppt PowerPoint Presentation Visual Aids Model
This is a bar graph companys business model canvas ppt powerpoint presentation visual aids model. This is a three stage process. The stages in this process are bar graph, finance, marketing, strategy, analysis, business.
-
Lean Process Improvement Governance And Visualization Ppt PowerPoint Presentation Model Graphics Tutorials
This is a lean process improvement governance and visualization ppt powerpoint presentation model graphics tutorials. This is a six stage process. The stages in this process are project management, lean manufacturing, lean project.
-
Income Statement Graphical Representation Ppt PowerPoint Presentation Visual Aids Layouts
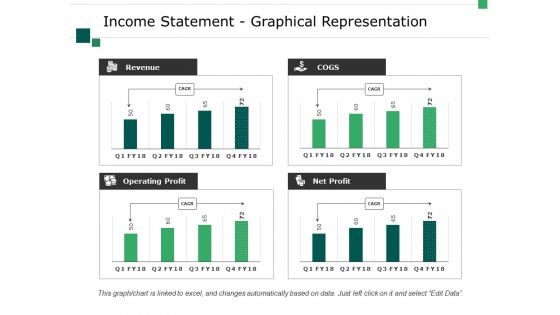
This is a income statement graphical representation ppt powerpoint presentation visual aids layouts. This is a four stage process. The stages in this process are business, marketing, revenue, operating profit, net profit, cogs.
-
Bar Graph Ppt PowerPoint Presentation Styles Visual Aids
This is a bar graph ppt powerpoint presentation styles visual aids. This is a three stage process. The stages in this process are bar, marketing, strategy, finance, planning.
-
Visual Marketing Tools Ppt PowerPoint Presentation Show Graphics Tutorials Cpb
This is a visual marketing tools ppt powerpoint presentation show graphics tutorials cpb. This is a three stage process. The stages in this process are visual marketing tools.
-
Predictive Model Visualization Ppt PowerPoint Presentation Pictures Graphics Example
This is a predictive model visualization ppt powerpoint presentation pictures graphics example. This is a five stage process. The stages in this process are predictive model, predictive framework, predictive structure.
-
Project Screen With Graphs And Charts For Visual Presentation Ppt PowerPoint Presentation Gallery Design Inspiration
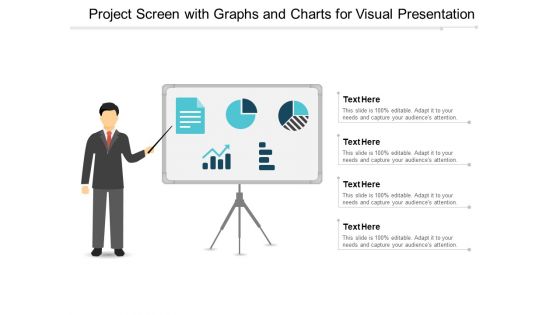
This is a project screen with graphs and charts for visual presentation ppt powerpoint presentation gallery design inspiration. This is a four stage process. The stages in this process are visual aids, communication, business.
-
Stock Market Analysis Magnifying Glass Over Bar Graph And Dollar Sign Ppt PowerPoint Presentation Icon Visual Aids
This is a stock market analysis magnifying glass over bar graph and dollar sign ppt powerpoint presentation icon visual aids. This is a four stage process. The stages in this process are stock market, financial markets, bull market.
-
Bar Graph Ppt PowerPoint Presentation Infographic Template Visuals
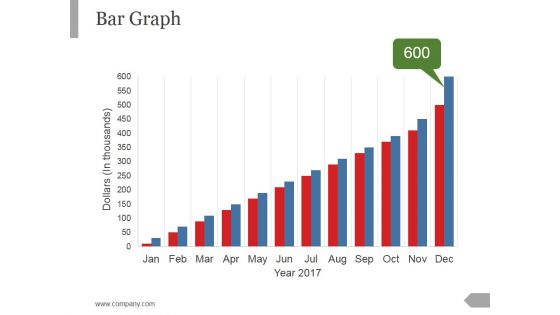
This is a bar graph ppt powerpoint presentation infographic template visuals. This is a twelve stage process. The stages in this process are business, marketing, management, growth, planning.
-
Our Charts And Graphs Ppt PowerPoint Presentation File Visuals
This is a our charts and graphs ppt powerpoint presentation file visuals. This is a one stage process. The stages in this process are business, strategy, marketing, analysis, finance.
-
Bar Graph Ppt PowerPoint Presentation Slides Visual Aids
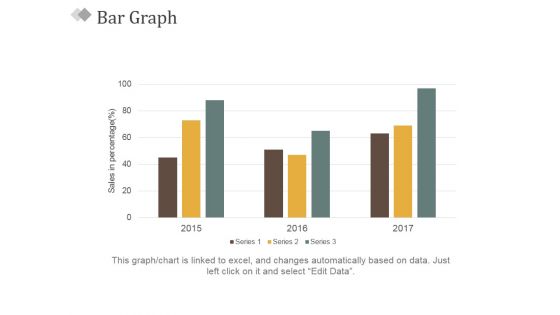
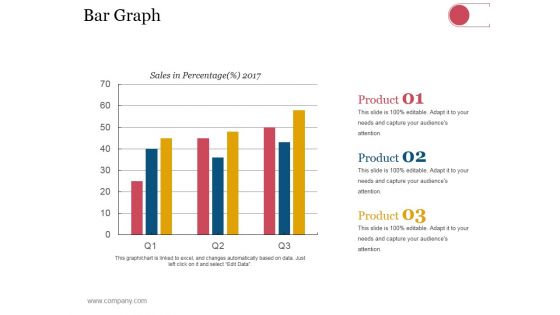
This is a bar graph ppt powerpoint presentation slides visual aids. This is a three stage process. The stages in this process are sales in percentage, bar graph, business, marketing, success.
-
Bar Graph Ppt PowerPoint Presentation Visual Aids Model
This is a bar graph ppt powerpoint presentation visual aids model. This is a three stage process. The stages in this process are business, strategy, analysis, planning, sales in percentage.
-
Bar Graph Ppt PowerPoint Presentation Visual Aids Styles
This is a bar graph ppt powerpoint presentation visual aids styles. This is a five stage process. The stages in this process are finance, analysis, planning, business, process.
-
Data Analysis Collection Integration And Visualization Ppt PowerPoint Presentation Summary Graphics Tutorials Cpb
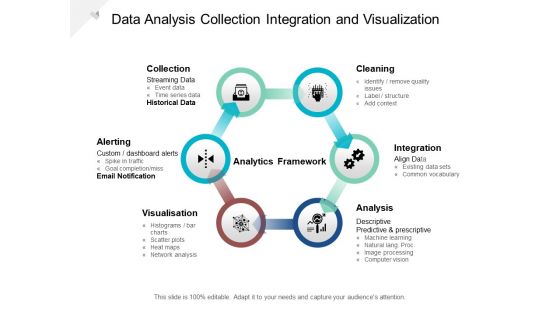
This is a data analysis collection integration and visualization ppt powerpoint presentation summary graphics tutorials cpb. This is a six stage process. The stages in this process are data analysis, analytics architecture, analytics framework.
-
Presentation Of Workers Statistics In Graph Ppt PowerPoint Presentation Visual Aids
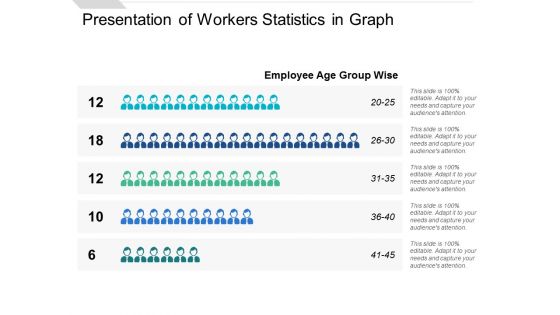
Presenting this set of slides with name presentation of workers statistics in graph ppt powerpoint presentation visual aids. This is a five stage process. The stages in this process are people graph, sales performance, population data demographics. This is a completely editable PowerPoint presentation and is available for immediate download. Download now and impress your audience.
-
Data Graph Report Vector Icon Ppt PowerPoint Presentation Slides Visual Aids
Presenting this set of slides with name data graph report vector icon ppt powerpoint presentation slides visual aids. This is a one stage process. The stages in this process are data report, infographics brochure, business statement. This is a completely editable PowerPoint presentation and is available for immediate download. Download now and impress your audience.
-
Business Diagram Data Visualization Workflow From Data Access To Graphs Ppt Slide
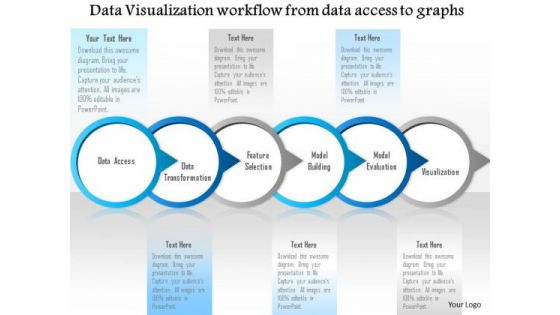
Graphic of workflow has been used to design this diagram. This diagram slide depicts the concept of data visualization from data access. This diagrams suitable for technology and internet related presentations.
-
Graphic Designing And Visual Arts Company Profile Table Of Contents Brochure PDF
Deliver and pitch your topic in the best possible manner with this Graphic Designing And Visual Arts Company Profile Table Of Contents Brochure PDF. Use them to share invaluable insights on Service Packages, Service Workflow, Business Model and impress your audience. This template can be altered and modified as per your expectations. So, grab it now.
-
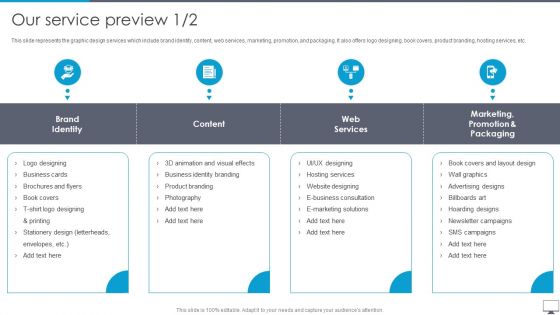
Graphic Designing And Visual Arts Company Profile Our Service Preview Mockup PDF
This slide represents the graphic design services which include brand identity, content, web services, marketing, promotion, and packaging. It also offers logo designing, book covers, product branding, hosting services, etc. This is a Graphic Designing And Visual Arts Company Profile Our Service Preview Mockup PDF template with various stages. Focus and dispense information on four stages using this creative set, that comes with editable features. It contains large content boxes to add your information on topics like Web Services, Content, Brand Identity. You can also showcase facts, figures, and other relevant content using this PPT layout. Grab it now.
-
Data Analysis Visualization Ppt PowerPoint Presentation Portfolio Graphic Images Cpb
Presenting this set of slides with name data analysis visualization ppt powerpoint presentation portfolio graphic images cpb. This is an editable Powerpoint four stages graphic that deals with topics like data analysis visualization to help convey your message better graphically. This product is a premium product available for immediate download and is 100 percent editable in Powerpoint. Download this now and use it in your presentations to impress your audience.
-
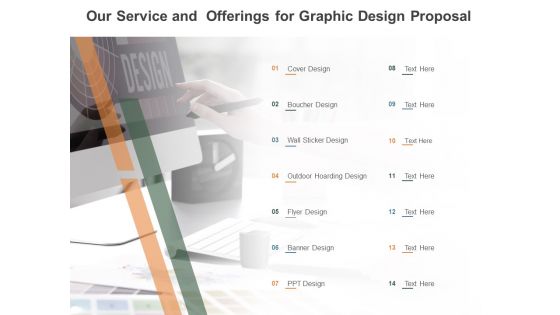
Our Service And Offerings For Graphic Design Proposal Ppt PowerPoint Presentation Infographics Visuals
Presenting this set of slides with name our service and offerings for graphic design proposal ppt powerpoint presentation infographics visuals. This is a fourteen stage process. The stages in this process are cover design, boucher design, wall sticker design, outdoor hoarding design, flyer design. This is a completely editable PowerPoint presentation and is available for immediate download. Download now and impress your audience.
-
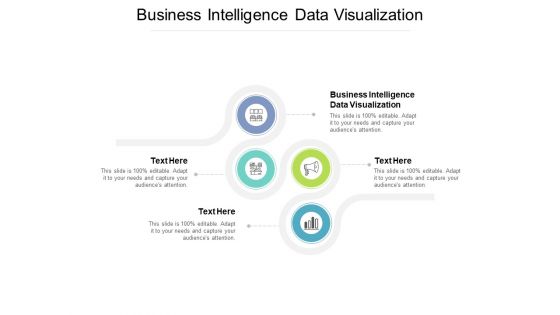
Business Intelligence Data Visualization Ppt PowerPoint Presentation Infographics Graphics Tutorials Cpb
Presenting this set of slides with name business intelligence data visualization ppt powerpoint presentation infographics graphics tutorials cpb. This is an editable Powerpoint four stages graphic that deals with topics like business intelligence data visualization to help convey your message better graphically. This product is a premium product available for immediate download and is 100 percent editable in Powerpoint. Download this now and use it in your presentations to impress your audience.
-
Straight Line Graph Ppt PowerPoint Presentation Visual Aids Inspiration Cpb
Presenting this set of slides with name straight line graph ppt powerpoint presentation visual aids inspiration cpb. This is an editable Powerpoint three stages graphic that deals with topics like straight line graph to help convey your message better graphically. This product is a premium product available for immediate download and is 100 percent editable in Powerpoint. Download this now and use it in your presentations to impress your audience.
-
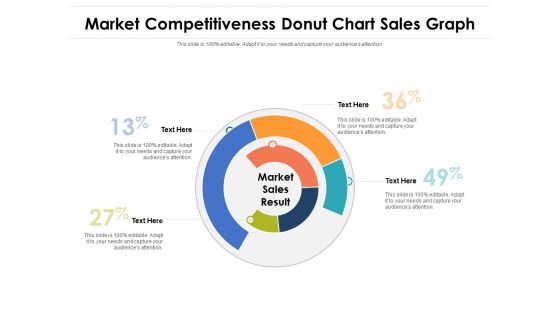
Market Competitiveness Donut Chart Sales Graph Ppt PowerPoint Presentation File Visual Aids PDF
Pitch your topic with ease and precision using this market competitiveness donut chart sales graph ppt powerpoint presentation file visual aids pdf. This layout presents information on market competitiveness donut chart sales graph. It is also available for immediate download and adjustment. So, changes can be made in the color, design, graphics or any other component to create a unique layout.
-
Computer Monitor With Graphic Visual Layout Vector Icon Ppt PowerPoint Presentation File Demonstration PDF
Persuade your audience using this computer monitor with graphic visual layout vector icon ppt powerpoint presentation file demonstration pdf. This PPT design covers three stages, thus making it a great tool to use. It also caters to a variety of topics including computer monitor with graphic visual layout vector icon. Download this PPT design now to present a convincing pitch that not only emphasizes the topic but also showcases your presentation skills.
-
Clients Support Executive Visually Showing Product On Kiosk Ppt PowerPoint Presentation Model Graphics PDF
Persuade your audience using this clients support executive visually showing product on kiosk ppt powerpoint presentation model graphics pdf. This PPT design covers three stages, thus making it a great tool to use. It also caters to a variety of topics including clients support executive visually showing product on kiosk. Download this PPT design now to present a convincing pitch that not only emphasizes the topic but also showcases your presentation skills.
-
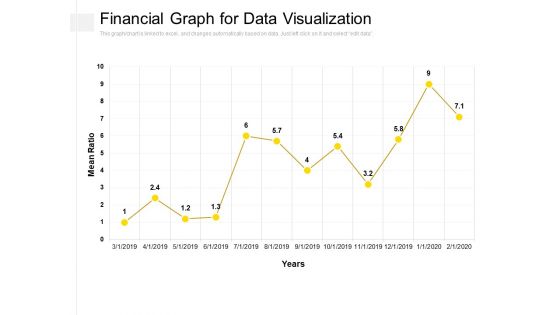
Financial Graph For Data Visualization Ppt PowerPoint Presentation Slides Picture PDF
Presenting this set of slides with name financial graph for data visualization ppt powerpoint presentation slides picture pdf. The topics discussed in these slides are mean ration, year. This is a completely editable PowerPoint presentation and is available for immediate download. Download now and impress your audience.
-
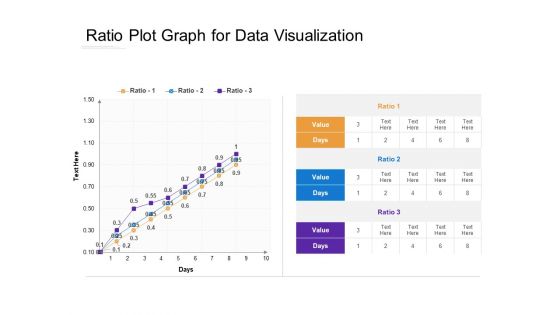
Ratio Plot Graph For Data Visualization Ppt PowerPoint Presentation Ideas Outfit PDF
Presenting this set of slides with name ratio plot graph for data visualization ppt powerpoint presentation ideas outfit pdf. The topics discussed in these slides are ratio, value, days. This is a completely editable PowerPoint presentation and is available for immediate download. Download now and impress your audience.
-
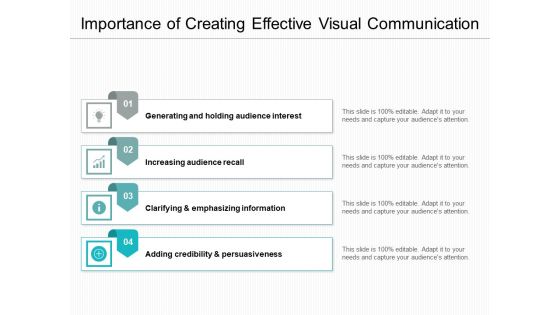
Importance Of Creating Effective Visual Communication Ppt PowerPoint Presentation Gallery Graphics Example PDF
Presenting this set of slides with name importance of creating effective visual communication ppt powerpoint presentation gallery graphics example pdf. This is a four stage process. The stages in this process are credibility, generating, emphasizing. This is a completely editable PowerPoint presentation and is available for immediate download. Download now and impress your audience.
-
Credit Score Graph Ppt PowerPoint Presentation Model Visuals Cpb Pdf
Presenting this set of slides with name credit score graph ppt powerpoint presentation model visuals cpb pdf. This is an editable Powerpoint four stages graphic that deals with topics like credit score graph to help convey your message better graphically. This product is a premium product available for immediate download and is 100 percent editable in Powerpoint. Download this now and use it in your presentations to impress your audience.
-
Growth Graph For Business Achievement Vector Icon Ppt PowerPoint Presentation Visual Aids Diagrams
Presenting this set of slides with name growth graph for business achievement vector icon ppt powerpoint presentation visual aids diagrams. This is a three stage process. The stages in this process are growth graph, business achievement vector icon. This is a completely editable PowerPoint presentation and is available for immediate download. Download now and impress your audience.
-
Pareto Graph For Manufacturing Plant Problems Ppt PowerPoint Presentation File Visuals PDF
Presenting this set of slides with name pareto graph for manufacturing plant problems ppt powerpoint presentation file visuals pdf. The topics discussed in these slide is pareto graph for manufacturing plant problems. This is a completely editable PowerPoint presentation and is available for immediate download. Download now and impress your audience.
-
Workforce Turnover Graph For Three Companies Ppt PowerPoint Presentation Infographic Template Visuals PDF
Presenting this set of slides with name workforce turnover graph for three companies ppt powerpoint presentation infographic template visuals pdf. The topics discussed in these slides are key insights, 2016 to 2020, employee turnover percentage. This is a completely editable PowerPoint presentation and is available for immediate download. Download now and impress your audience.
-
Visual CV Design With Education And Skills Ppt PowerPoint Presentation Slides Graphics Template PDF
Presenting this set of slides with name visual cv design with education and skills ppt powerpoint presentation slides graphics template pdf. This is a one stage process. The stages in this process are work experience, education, skills. This is a completely editable PowerPoint presentation and is available for immediate download. Download now and impress your audience.
-
Cross Selling Of Retail Banking Products Current And Future Year Sales Revenues Projections Graph Ppt Visual Aids Backgrounds PDF
Deliver an awe inspiring pitch with this creative cross selling of retail banking products current and future year sales revenues projections graph ppt visual aids backgrounds pdf bundle. Topics like current and future year sales revenues projections can be discussed with this completely editable template. It is available for immediate download depending on the needs and requirements of the user.
-
Three Points Levels Stack Graphic Ppt PowerPoint Presentation Ideas Visuals PDF
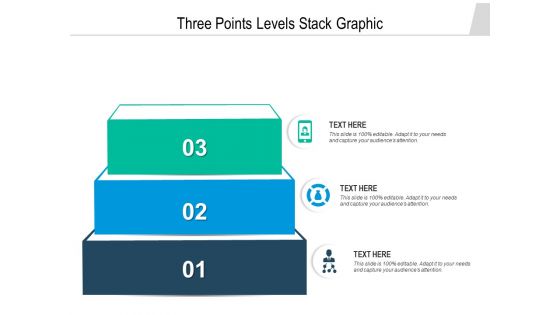
Persuade your audience using this three points levels stack graphic ppt powerpoint presentation ideas visuals pdf. This PPT design covers three stages, thus making it a great tool to use. It also caters to a variety of topics including three points levels stack graphic. Download this PPT design now to present a convincing pitch that not only emphasizes the topic but also showcases your presentation skills.
-
Bar Graph For Sales Inflow And Goals Graph Ppt PowerPoint Presentation Infographics Visual Aids PDF
Pitch your topic with ease and precision using this bar graph for sales inflow and goals graph ppt powerpoint presentation infographics visual aids pdf. This layout presents information on sales revenue vs target, new customer, congrats target is met. It is also available for immediate download and adjustment. So, changes can be made in the color, design, graphics or any other component to create a unique layout.
-
Future Work Graphical Representation Ppt Visual Aids Gallery PDF
This slide covers the graphical presentation of the quarterly future updates in Gantt chart format. Deliver and pitch your topic in the best possible manner with this future work graphical representation ppt visual aids gallery pdf. Use them to share invaluable insights on social media integration, revenue, mobile tracker app and impress your audience. This template can be altered and modified as per your expectations. So, grab it now.
-
Statistical Assessment Process For Visualization And Presentation Ppt Styles Graphics Example PDF
Showcasing this set of slides titled statistical assessment process for visualization and presentation ppt styles graphics example pdf. The topics addressed in these templates are data understanding, data preparation, validation, visualization, presentation. All the content presented in this PPT design is completely editable. Download it and make adjustments in color, background, font etc. as per your unique business setting.
-
Customer Attainment Price To Gain New Clients Visualizing Client Acquisition Costs Over Time Graphics PDF
This slide shows CAC Client Acquisition Cost visualization chart with details related to number of customers acquired and cost of acquisition on monthly basis. Deliver an awe inspiring pitch with this creative customer attainment price to gain new clients visualizing client acquisition costs over time graphics pdf bundle. Topics like visualizing client acquisition costs over time can be discussed with this completely editable template. It is available for immediate download depending on the needs and requirements of the user.
-
API Management Market Size By Region Graphical Representation Ppt Layouts Visuals PDF
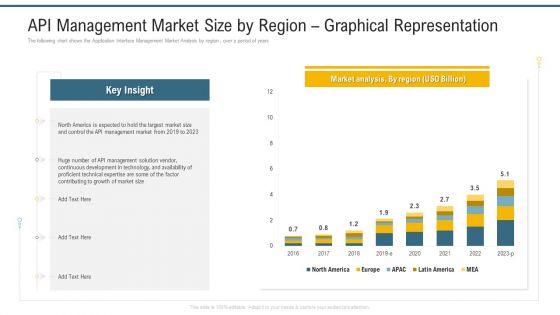
The following chart shows the Application Interface Management Market Analysis by region , over a period of years. Deliver and pitch your topic in the best possible manner with this api management market size by region graphical representation ppt layouts visuals pdf. Use them to share invaluable insights on development in technology, growth of market size, management market and impress your audience. This template can be altered and modified as per your expectations. So, grab it now.
-
Company Sales Graph Business Analysis Method Ppt Professional Visuals PDF
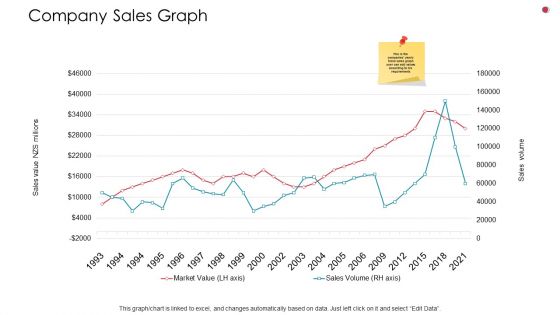
Deliver an awe inspiring pitch with this creative company sales graph business analysis method ppt professional visuals pdf bundle. Topics like market value, sales can be discussed with this completely editable template. It is available for immediate download depending on the needs and requirements of the user.
-
Two Column Layout Visual Of Provenance Data Ppt PowerPoint Presentation Slides Graphic Images PDF
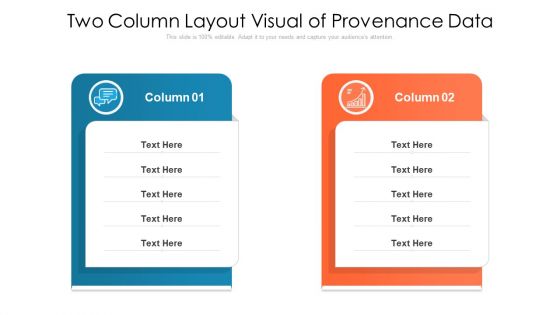
Presenting two column layout visual of provenance data ppt powerpoint presentation slides graphic images pdf to dispense important information. This template comprises two stages. It also presents valuable insights into the topics including two column layout visual of provenance data. This is a completely customizable PowerPoint theme that can be put to use immediately. So, download it and address the topic impactfully.
-
13 Hoops Visual For Balance Transfer Credit Cards Compare Ppt PowerPoint Presentation Gallery Graphics PDF
Persuade your audience using this 13 hoops visual for balance transfer credit cards compare ppt powerpoint presentation gallery graphics pdf. This PPT design covers thirteen stages, thus making it a great tool to use. It also caters to a variety of topics including 13 hoops visual for balance transfer credit cards compare. Download this PPT design now to present a convincing pitch that not only emphasizes the topic but also showcases your presentation skills.
-
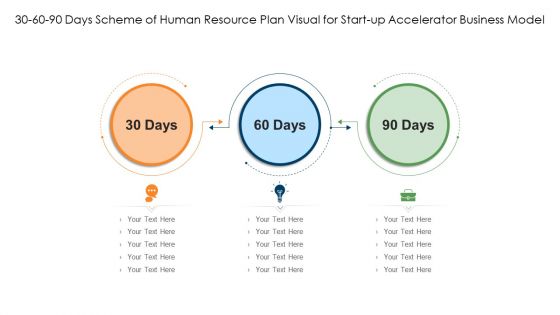
30 60 90 Days Scheme Of Human Resource Plan Visual For Start Up Accelerator Business Model Graphics PDF
Persuade your audience using this 30 60 90 days scheme of human resource plan visual for start up accelerator business model graphics pdf. This PPT design covers three stages, thus making it a great tool to use. It also caters to a variety of topics including 30 60 90 days. Download this PPT design now to present a convincing pitch that not only emphasizes the topic but also showcases your presentation skills.
-
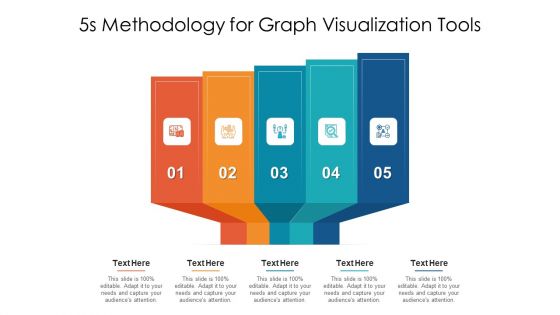
5S Methodology Slide For Graph Visualization Tools Ppt PowerPoint Presentation Summary Graphics Template PDF
Presenting 5s methodology slide for graph visualization tools ppt powerpoint presentation summary graphics template pdf to dispense important information. This template comprises five stages. It also presents valuable insights into the topics including 5s methodology for graph visualization tools. This is a completely customizable PowerPoint theme that can be put to use immediately. So, download it and address the topic impactfully.
-
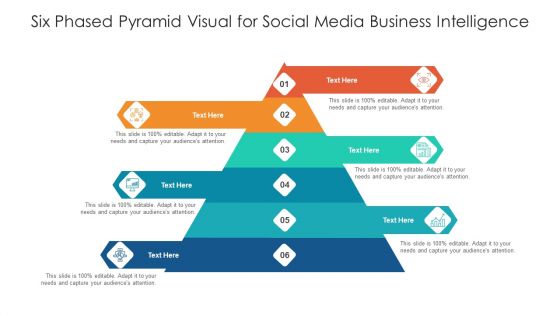
six phased pyramid visual for social media business intelligence ppt powerpoint presentation show graphics download pdf
Presenting six phased pyramid visual for social media business intelligence ppt powerpoint presentation show graphics download pdf to dispense important information. This template comprises six stages. It also presents valuable insights into the topics including six phased pyramid visual for social media business intelligence. This is a completely customizable PowerPoint theme that can be put to use immediately. So, download it and address the topic impactfully.
-
Twelve Stages Visual For Natural Language Speech Recognition Ppt PowerPoint Presentation Gallery Graphics Template PDF
Presenting twelve stages visual for natural language speech recognition ppt powerpoint presentation gallery graphics template pdf to dispense important information. This template comprises twelve stages. It also presents valuable insights into the topics including twelve stages visual for natural language speech recognition. This is a completely customizable PowerPoint theme that can be put to use immediately. So, download it and address the topic impactfully.
-
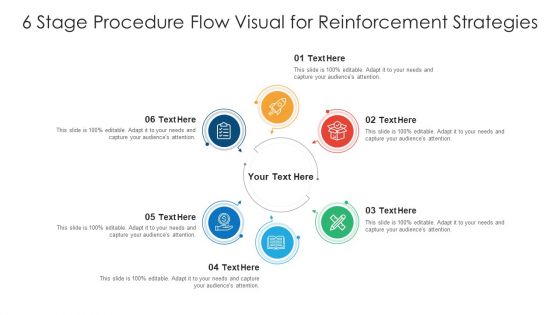
6 Stage Procedure Flow Visual For Reinforcement Strategies Ppt PowerPoint Presentation Gallery Graphics Example PDF
Presenting 6 stage procedure flow visual for reinforcement strategies ppt powerpoint presentation gallery graphics example pdf to dispense important information. This template comprises six stages. It also presents valuable insights into the topics including 6 stage procedure flow visual for reinforcement strategies. This is a completely customizable PowerPoint theme that can be put to use immediately. So, download it and address the topic impactfully.
-
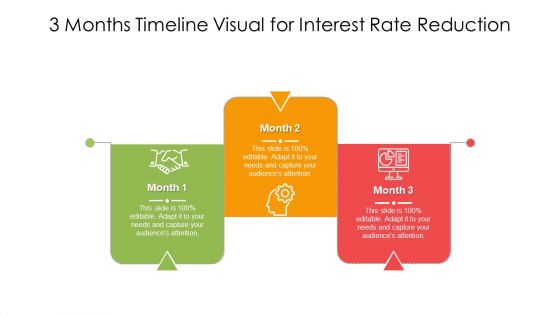
3 Months Timeline Visual For Interest Rate Reduction Ppt PowerPoint Presentation Gallery Graphics Template PDF
Persuade your audience using this 3 months timeline visual for interest rate reduction ppt powerpoint presentation gallery graphics template pdf. This PPT design covers three stages, thus making it a great tool to use. It also caters to a variety of topics including 3 months timeline visual for interest rate reduction. Download this PPT design now to present a convincing pitch that not only emphasizes the topic but also showcases your presentation skills.
-
Graphical Representation Of Research IT Finereport As Visualization Research Tool Structure PDF
This slide describes the fine report as the visualization research tool that can connect to various databases directly, making it easier to design. Presenting graphical representation of research it finereport as visualization research tool structure pdf to provide visual cues and insights. Share and navigate important information on eight stages that need your due attention. This template can be used to pitch topics like application, dashboards, databases. In addtion, this PPT design contains high resolution images, graphics, etc, that are easily editable and available for immediate download.
-
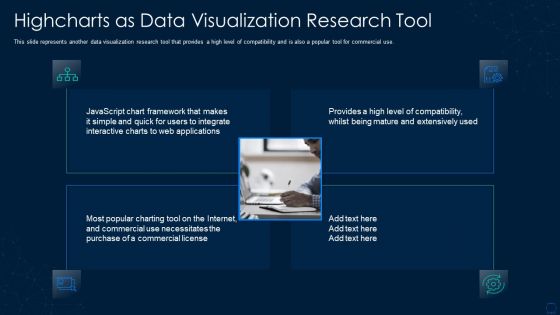
Graphical Representation Of Research IT Highcharts As Data Visualization Research Demonstration PDF
This slide represents another data visualization research tool that provides a high level of compatibility and is also a popular tool for commercial use. This is a graphical representation of research it highcharts as data visualization research demonstration pdf template with various stages. Focus and dispense information on four stages using this creative set, that comes with editable features. It contains large content boxes to add your information on topics like highcharts as data visualization research tool. You can also showcase facts, figures, and other relevant content using this PPT layout. Grab it now.


