Variances PowerPoint Presentation Templates and Google Slides
-
Population Variance Symbol In Powerpoint And Google Slides Cpb
Presenting our innovatively-designed set of slides titled Population Variance Symbol In Powerpoint And Google Slides Cpb. This completely editable PowerPoint graphic exhibits Population Variance Symbol that will help you convey the message impactfully. It can be accessed with Google Slides and is available in both standard screen and widescreen aspect ratios. Apart from this, you can download this well-structured PowerPoint template design in different formats like PDF, JPG, and PNG. So, click the download button now to gain full access to this PPT design.
-
Homogeneity Variance In Powerpoint And Google Slides Cpb
Introducing our well designed Homogeneity Variance In Powerpoint And Google Slides Cpb. This PowerPoint design presents information on topics like Homogeneity Variance. As it is predesigned it helps boost your confidence level. It also makes you a better presenter because of its high quality content and graphics. This PPT layout can be downloaded and used in different formats like PDF, PNG, and JPG. Not only this, it is available in both Standard Screen and Widescreen aspect ratios for your convenience. Therefore, click on the download button now to persuade and impress your audience.
-
KPIs To Track Variance Between Actual Effective And Efficient Tools To Develop Fin SS V
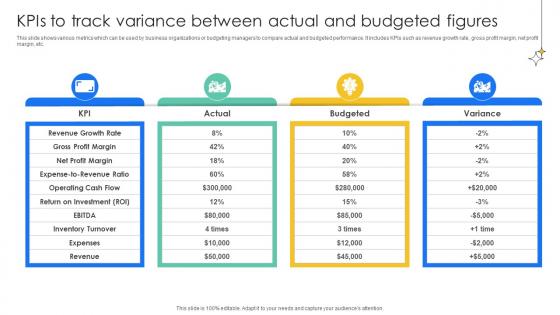
This slide shows various metrics which can be used by business organizations or budgeting managers to compare actual and budgeted performance. It includes KPIs such as revenue growth rate, gross profit margin, net profit margin, etc. Coming up with a presentation necessitates that the majority of the effort goes into the content and the message you intend to convey. The visuals of a PowerPoint presentation can only be effective if it supplements and supports the story that is being told. Keeping this in mind our experts created KPIs To Track Variance Between Actual Effective And Efficient Tools To Develop Fin SS V to reduce the time that goes into designing the presentation. This way, you can concentrate on the message while our designers take care of providing you with the right template for the situation.
-
KPIs To Track Variance Between Strategies To Develop Effective Ppt PowerPoint Fin SS V
This slide shows various metrics which can be used by business organizations or budgeting managers to compare actual and budgeted performance. It includes KPIs such as revenue growth rate, gross profit margin, net profit margin, etc. Coming up with a presentation necessitates that the majority of the effort goes into the content and the message you intend to convey. The visuals of a PowerPoint presentation can only be effective if it supplements and supports the story that is being told. Keeping this in mind our experts created KPIs To Track Variance Between Strategies To Develop Effective Ppt PowerPoint Fin SS V to reduce the time that goes into designing the presentation. This way, you can concentrate on the message while our designers take care of providing you with the right template for the situation.


