User revenue PowerPoint Presentation Templates and Google Slides
-
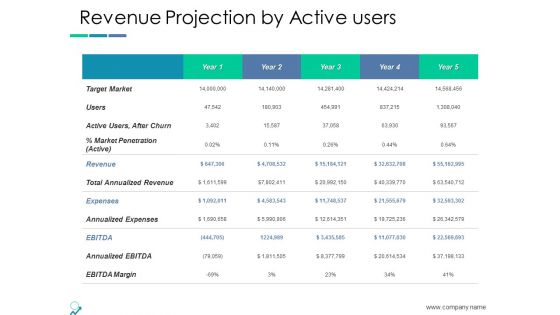
Revenue Projection By Active Users Ppt PowerPoint Presentation Outline Master Slide
This is a revenue projection by active users ppt powerpoint presentation outline master slide. This is a five stage process. The stages in this process are target market, revenue, expenses, management, planning.
-
Revenue Projection By Active Users Strategy Ppt PowerPoint Presentation Infographic Template Outline
This is a revenue projection by active users strategy ppt powerpoint presentation infographic template outline. This is a three stage process. The stages in this process are comparison, planning, marketing, finance, strategy.
-
Revenue Projection By Active Users Strategy Ppt PowerPoint Presentation Infographic Template Slideshow
This is a revenue projection by active users strategy ppt powerpoint presentation infographic template slideshow. This is a three stage process. The stages in this process are comparison, planning, marketing, finance, strategy.
-
Revenue Projection By Active Users Ppt PowerPoint Presentation Ideas Slides
This is a revenue projection by active users ppt powerpoint presentation ideas slides. This is a four stage process. The stages in this process are compare, marketing, business, management, planning.
-
Average Revenue Per User Ppt PowerPoint Presentation Styles Ideas Cpb Pdf
Presenting this set of slides with name average revenue per user ppt powerpoint presentation styles ideas cpb pdf. This is an editable Powerpoint six stages graphic that deals with topics like average revenue per user to help convey your message better graphically. This product is a premium product available for immediate download and is 100 percent editable in Powerpoint. Download this now and use it in your presentations to impress your audience.
-
Lowering Sales Revenue A Telecommunication Firm Case Competition Split Of Users Shifting Ppt Icon Samples PDF
The slides shows the split of registered users who unsubscribed the companys services. Number of unsubscribed users are categorized based on reason behind shifting mobile portability and Stop using the number. Deliver and pitch your topic in the best possible manner with this lowering sales revenue a telecommunication firm case competition split of users shifting ppt icon samples pdf. Use them to share invaluable insights on split of users shifting, 2016 to 2021 and impress your audience. This template can be altered and modified as per your expectations. So, grab it now.
-
Factor Influencing User Experience Dairy Industry Company Revenue And Market Share Icons PDF
This slide shows the companys total revenue and its brand share in the global market. It shows the increase in the total revenue in next five years and also increase in the market share of the company globally. Deliver and pitch your topic in the best possible manner with this factor influencing user experience dairy industry company revenue and market share icons pdf . Use them to share invaluable insights on company revenue and market share after the implementation of strategies and impress your audience. This template can be altered and modified as per your expectations. So, grab it now.
-
Factor Influencing User Experience Dairy Industry Company Total Revenue And Worldwide Elements PDF
This slide shows the companys total revenue from the year 2017 to 2021, which is decreasing due to various reasons. It also shows the companys market share which is less than its various competitors. Deliver an awe inspiring pitch with this creative factor influencing user experience dairy industry company total revenue and worldwide elements pdf bundle. Topics like company total revenue and worldwide market share can be discussed with this completely editable template. It is available for immediate download depending on the needs and requirements of the user.
-
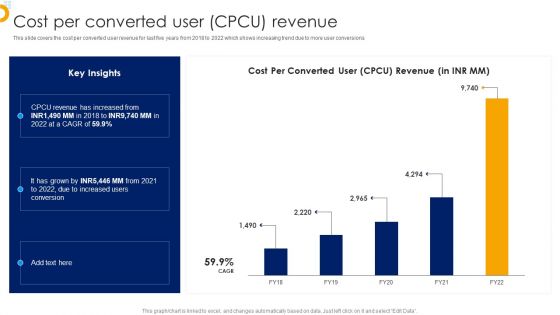
Affle India Ltd Business Profile Cost Per Converted User CPCU Revenue Clipart PDF
Deliver and pitch your topic in the best possible manner with this Affle India Ltd Business Profile Cost Per Converted User CPCU Revenue Clipart PDF. Use them to share invaluable insights on Cost Per Converted User, Revenue and impress your audience. This template can be altered and modified as per your expectations. So, grab it now.
-
Landing Page Leads And Revenue Generation Analytics For User Experience Optimization Dashboard Formats PDF
This slide covers website analytics based on revenue earned. It also included leads generated, bounce rates, customer churn stats, annual and monthly recurring revenue, etc. Pitch your topic with ease and precision using this Landing Page Leads And Revenue Generation Analytics For User Experience Optimization Dashboard Formats PDF. This layout presents information on Monthly Recurring Revenue, Bounce Rate, Gross Volume. It is also available for immediate download and adjustment. So, changes can be made in the color, design, graphics or any other component to create a unique layout.
-
Pinterest Quarterly Revenue Projections Based On Global Users Demonstration PDF
This slide depicts image sharing companys revenue estimation based on active users globally. It includes revenue projections on quarterly basis for users in international market. Showcasing this set of slides titled Pinterest Quarterly Revenue Projections Based On Global Users Demonstration PDF. The topics addressed in these templates are Decrease Approx, Revenue Estimated, 2022 To 2023. All the content presented in this PPT design is completely editable. Download it and make adjustments in color, background, font etc. as per your unique business setting.
-
User Business Service Delivery Framework Dashboard With Net Revenue Microsoft PDF
Showcasing this set of slides titled User Business Service Delivery Framework Dashboard With Net Revenue Microsoft PDF. The topics addressed in these templates are Service Delivery, Framework Dashboard, Net Revenue. All the content presented in this PPT design is completely editable. Download it and make adjustments in color, background, font etc. as per your unique business setting.
-
5 Year Financial Forecast Strategy With Users And Revenue Ppt PowerPoint Presentation Show Graphics Download PDF
This slide includes financial plan of five years to identify, describe and analyze business opportunities. It further includes users, revenues, operating cost, total cost and net income.Pitch your topic with ease and precision using this 5 Year Financial Forecast Strategy With Users And Revenue Ppt PowerPoint Presentation Show Graphics Download PDF. This layout presents information on Research Development, Sales Marketing, Business Specific. It is also available for immediate download and adjustment. So, changes can be made in the color, design, graphics or any other component to create a unique layout.
-
Information Technology Solutions Company Outline Cost Per Converted User CPCU Revenue Topics PDF
This slide covers the cost per converted user revenue for last five years from 2018 to 2022 which shows increasing trend due to more user conversions From laying roadmaps to briefing everything in detail, our templates are perfect for you. You can set the stage with your presentation slides. All you have to do is download these easy to edit and customizable templates. Information Technology Solutions Company Outline Cost Per Converted User CPCU Revenue Topics PDF will help you deliver an outstanding performance that everyone would remember and praise you for. Do download this presentation today.
-
Online Advertising Firm Business Profile Cost Per Converted User CPCU Revenue Information PDF
This slide covers the cost per converted user revenue for last five years from 2018 to 2022 which shows increasing trend due to more user conversions Get a simple yet stunning designed Online Advertising Firm Business Profile Cost Per Converted User CPCU Revenue Information PDF. It is the best one to establish the tone in your meetings. It is an excellent way to make your presentations highly effective. So, download this PPT today from Slidegeeks and see the positive impacts. Our easy to edit Online Advertising Firm Business Profile Cost Per Converted User CPCU Revenue Information PDF can be your go to option for all upcoming conferences and meetings. So, what are you waiting for Grab this template today.
-
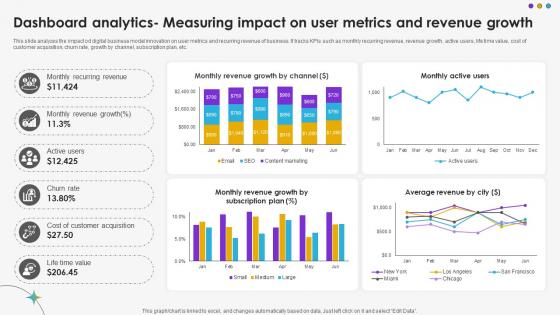
Dashboard Analytics Measuring Impact On User Metrics And Revenue Growth DT SS V
This slide analyzes the impact od digital business model innovation on user metrics and recurring revenue of business. It tracks KPIs such as monthly recurring revenue, revenue growth, active users, life time value, cost of customer acquisition, churn rate, growth by channel, subscription plan, etc.Are you searching for a Dashboard Analytics Measuring Impact On User Metrics And Revenue Growth DT SS V that is uncluttered, straightforward, and original Its easy to edit, and you can change the colors to suit your personal or business branding. For a presentation that expresses how much effort you have put in, this template is ideal With all of its features, including tables, diagrams, statistics, and lists, its perfect for a business plan presentation. Make your ideas more appealing with these professional slides. Download Dashboard Analytics Measuring Impact On User Metrics And Revenue Growth DT SS V from Slidegeeks today.
-
Revenue Stream Function User Interface Service Investor Funding Elevator Pitch Deck
This slide represents revenue sources for IT company a fixed fee for services offering free trial before premium version. This modern and well-arranged Revenue Stream Function User Interface Service Investor Funding Elevator Pitch Deck provides lots of creative possibilities. It is very simple to customize and edit with the Powerpoint Software. Just drag and drop your pictures into the shapes. All facets of this template can be edited with Powerpoint, no extra software is necessary. Add your own material, put your images in the places assigned for them, adjust the colors, and then you can show your slides to the world, with an animated slide included.
-
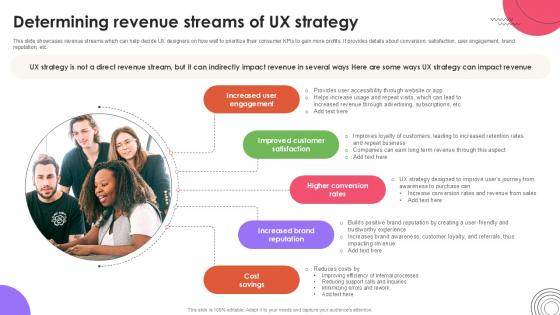
Determining Revenue Streams User Experience Design Ppt PowerPoint Strategy SS V
This slide showcases revenue streams which can help decide UX designers on how well to prioritize their consumer KPIs to gain more profits. It provides details about conversion, satisfaction, user engagement, brand reputation, etc.Do you have an important presentation coming up Are you looking for something that will make your presentation stand out from the rest Look no further than Determining Revenue Streams User Experience Design Ppt PowerPoint Strategy SS V. With our professional designs, you can trust that your presentation will pop and make delivering it a smooth process. And with Slidegeeks, you can trust that your presentation will be unique and memorable. So why wait Grab Determining Revenue Streams User Experience Design Ppt PowerPoint Strategy SS V today and make your presentation stand out from the rest


