User analytics PowerPoint Presentation Templates and Google Slides
-
User Reporting Agency Analytics Ppt PowerPoint Presentation Complete Deck With Slides
Improve your presentation delivery using this user reporting agency analytics ppt powerpoint presentation complete deck with slides. Support your business vision and objectives using this well-structured PPT deck. This template offers a great starting point for delivering beautifully designed presentations on the topic of your choice. Comprising twelve this professionally designed template is all you need to host discussion and meetings with collaborators. Each slide is self-explanatory and equipped with high-quality graphics that can be adjusted to your needs. Therefore, you will face no difficulty in portraying your desired content using this PPT slideshow. This PowerPoint slideshow contains every important element that you need for a great pitch. It is not only editable but also available for immediate download and utilization. The color, font size, background, shapes everything can be modified to create your unique presentation layout. Therefore, download it now.
-
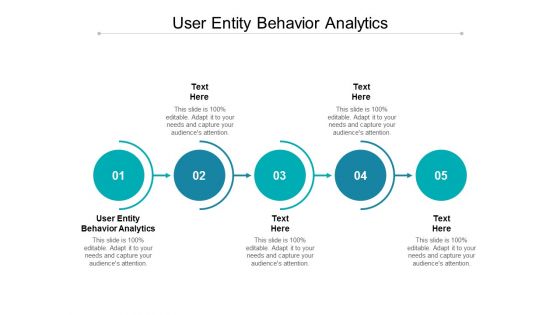
User Entity Behavior Analytics Ppt PowerPoint Presentation Infographics Example Introduction Cpb
Presenting this set of slides with name user entity behavior analytics ppt powerpoint presentation infographics example introduction cpb. This is a five stage process. The stages in this process are user entity behavior analytics. This is a completely editable PowerPoint presentation and is available for immediate download. Download now and impress your audience.
-
User Behavioural Analytics Ppt PowerPoint Presentation Infographics Graphics Template Cpb
Presenting this set of slides with name user behavioural analytics ppt powerpoint presentation infographics graphics template cpb. This is an editable Powerpoint seven stages graphic that deals with topics like user behavioural analytics to help convey your message better graphically. This product is a premium product available for immediate download and is 100 percent editable in Powerpoint. Download this now and use it in your presentations to impress your audience.
-
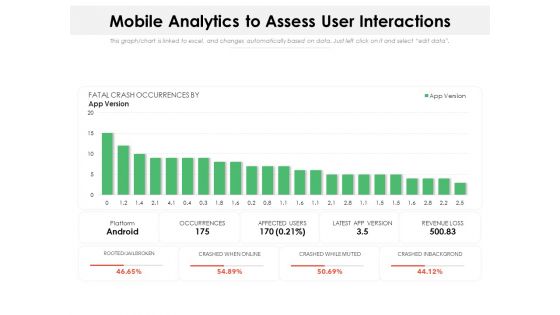
Mobile Analytics To Assess User Interactions Ppt PowerPoint Presentation Layouts Design Inspiration PDF
Pitch your topic with ease and precision using this mobile analytics to assess user interactions ppt powerpoint presentation layouts design inspiration pdf. This layout presents information on platform android, occurrences, affected users, latest app version, revenue loss. It is also available for immediate download and adjustment. So, changes can be made in the color, design, graphics or any other component to create a unique layout.
-
Improving Retention Rate By Implementing Acquisition Strategy Google Analytics Dashboard For User Tracking Inspiration PDF
Presenting this set of slides with name improving retention rate by implementing acquisition strategy google analytics dashboard for user tracking inspiration pdf. The topics discussed in these slides are target, metrics, analytics, goals. This is a completely editable PowerPoint presentation and is available for immediate download. Download now and impress your audience.
-
Winning New Customers Acquisition Strategies Google Analytics Dashboard For User Tracking Background PDF
Presenting this set of slides with name winning new customers acquisition strategies google analytics dashboard for user tracking background pdf. The topics discussed in these slides are target, metrics, analytics, goals. This is a completely editable PowerPoint presentation and is available for immediate download. Download now and impress your audience.
-
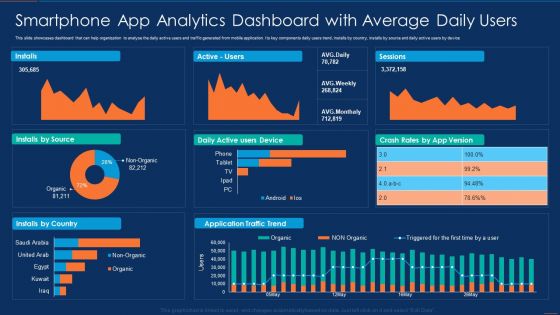
Smartphone App Analytics Dashboard With Average Daily Users Microsoft PDF
This slide showcases dashboard that can help organization to analyse the daily active users and traffic generated from mobile application. Its key components daily users trend, installs by country, installs by source and daily active users by device. Showcasing this set of slides titled Smartphone App Analytics Dashboard With Average Daily Users Microsoft PDF. The topics addressed in these templates are Smartphone App Analytics Dashboard With Average Daily Users. All the content presented in this PPT design is completely editable. Download it and make adjustments in color, background, font etc. as per your unique business setting.
-
Global User Big Data Analytics Icon Designs PDF
Persuade your audience using this global user big data analytics icon designs pdf. This PPT design covers one stages, thus making it a great tool to use. It also caters to a variety of topics including global user big data analytics icon. Download this PPT design now to present a convincing pitch that not only emphasizes the topic but also showcases your presentation skills.
-
Mobile User Application Big Data Analytics Mockup PDF
Showcasing this set of slides titled mobile user application big data analytics mockup pdf. The topics addressed in these templates are data analytics, analytics portfolio, business intelligence portfolio. All the content presented in this PPT design is completely editable. Download it and make adjustments in color, background, font etc. as per your unique business setting.
-
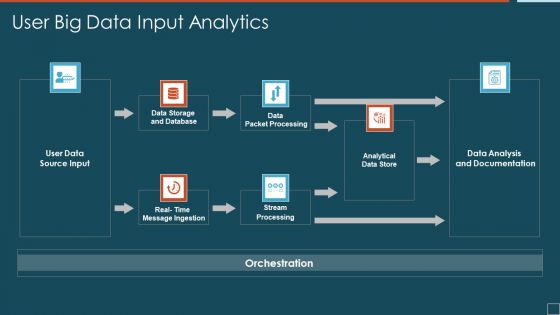
User Big Data Input Analytics Designs PDF
Showcasing this set of slides titled user big data input analytics designs pdf. The topics addressed in these templates are analytical data store, data packet processing, stream processing. All the content presented in this PPT design is completely editable. Download it and make adjustments in color, background, font etc. as per your unique business setting.
-
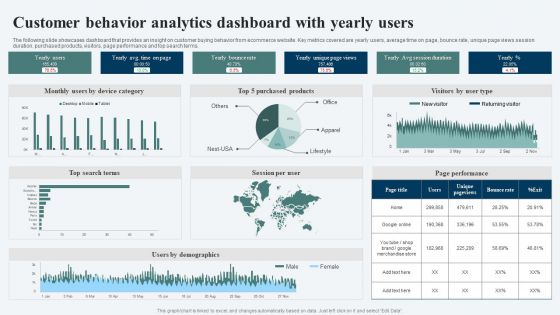
Customer Behavior Analytics Dashboard With Yearly Users Ppt Portfolio Ideas PDF
The following slide showcases dashboard that provides an insight on customer buying behavior from ecommerce website. Key metrics covered are yearly users, average time on page, bounce rate, unique page views session duration, purchased products, visitors, page performance and top search terms. Showcasing this set of slides titled Customer Behavior Analytics Dashboard With Yearly Users Ppt Portfolio Ideas PDF. The topics addressed in these templates are Yearly Users, Yearly Bounce Rate, Top Search Terms. All the content presented in this PPT design is completely editable. Download it and make adjustments in color, background, font etc. as per your unique business setting.
-
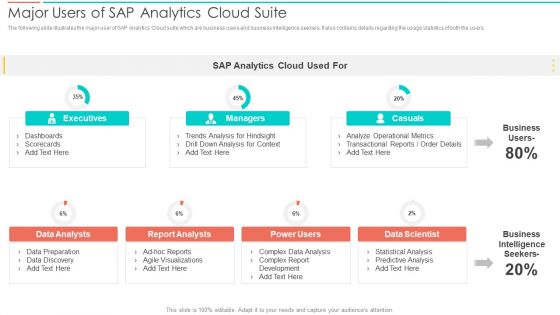
SAC Planning And Implementation Major Users Of SAP Analytics Cloud Suite Diagrams PDF
The following slide illustrates the major user of SAP Analytics Cloud suite which are business users and business intelligence seekers. It also contains details regarding the usage statistics of both the users. Deliver an awe inspiring pitch with this creative SAC Planning And Implementation Major Users Of SAP Analytics Cloud Suite Diagrams PDF bundle. Topics like Executives, Casuals, Business Intelligence Seekers, Data Scientist can be discussed with this completely editable template. It is available for immediate download depending on the needs and requirements of the user.
-
Landing Page Leads And Revenue Generation Analytics For User Experience Optimization Dashboard Formats PDF
This slide covers website analytics based on revenue earned. It also included leads generated, bounce rates, customer churn stats, annual and monthly recurring revenue, etc. Pitch your topic with ease and precision using this Landing Page Leads And Revenue Generation Analytics For User Experience Optimization Dashboard Formats PDF. This layout presents information on Monthly Recurring Revenue, Bounce Rate, Gross Volume. It is also available for immediate download and adjustment. So, changes can be made in the color, design, graphics or any other component to create a unique layout.
-
BI Technique For Data Informed Decisions Major Users Of Sap Analytics Cloud Suite Summary PDF
The following slide illustrates the major user of SAP Analytics Cloud suite which are business users and business intelligence seekers. It also contains details regarding the usage statistics of both the users. Crafting an eye catching presentation has never been more straightforward. Let your presentation shine with this tasteful yet straightforward BI Technique For Data Informed Decisions Major Users Of Sap Analytics Cloud Suite Summary PDF template. It offers a minimalistic and classy look that is great for making a statement. The colors have been employed intelligently to add a bit of playfulness while still remaining professional. Construct the ideal BI Technique For Data Informed Decisions Major Users Of Sap Analytics Cloud Suite Summary PDF that effortlessly grabs the attention of your audience Begin now and be certain to wow your customers.
-
User Feedback Governance And Analytics Dashboard Ppt Professional Rules PDF
This slide covers summary report on feedbacks provided by users.It includes analytics based on monthly feedbacks, positive and negative feedbacks, etc. for effective user experience. Pitch your topic with ease and precision using this User Feedback Governance And Analytics Dashboard Ppt Professional Rules PDF. This layout presents information on Current Feedbacks, Monthly Feedbacks, Analytics. It is also available for immediate download and adjustment. So, changes can be made in the color, design, graphics or any other component to create a unique layout.
-
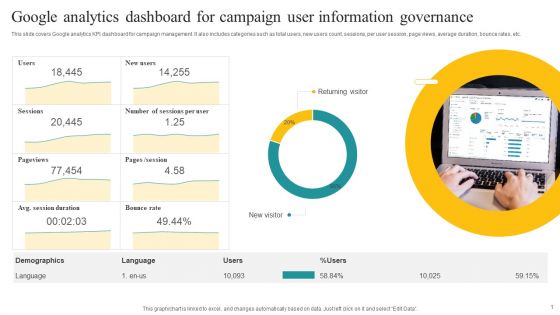
Google Analytics Dashboard For Campaign User Information Governance Demonstration PDF
This slide covers Google analytics KPI dashboard for campaign management. It also includes categories such as total users, new users count, sessions, per user session, page views, average duration, bounce rates, etc. Showcasing this set of slides titled Google Analytics Dashboard For Campaign User Information Governance Demonstration PDF. The topics addressed in these templates are Returning Visitor, New Visitor, Demographics. All the content presented in this PPT design is completely editable. Download it and make adjustments in color, background, font etc. as per your unique business setting.
-
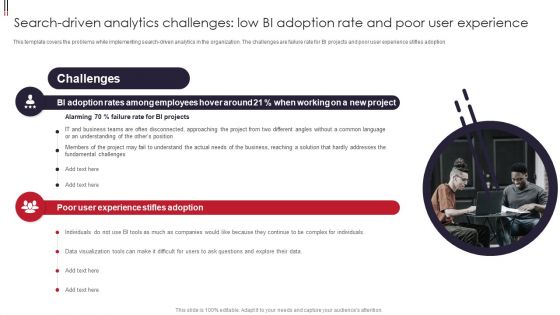
Search Driven Analytics Challenges Low BI Adoption Rate And Poor User Experience Professional PDF
This template covers the problems while implementing search driven analytics in the organization. The challenges are failure rate for BI projects and poor user experience stifles adoption. Presenting Search Driven Analytics Challenges Low BI Adoption Rate And Poor User Experience Professional PDF to provide visual cues and insights. Share and navigate important information on two stages that need your due attention. This template can be used to pitch topics like Data Visualization Tools, Fundamental Challenges, Business Teams. In addtion, this PPT design contains high resolution images, graphics, etc, that are easily editable and available for immediate download.
-
Search Driven Analytics Challenges Low BI Adoption Rate And Poor User Experience Elements PDF
This template covers the problems while implementing search driven analytics in the organization. The challenges are failure rate for BI projects and poor user experience stifles adoption. This is a Search Driven Analytics Challenges Low BI Adoption Rate And Poor User Experience Elements PDF template with various stages. Focus and dispense information on two stages using this creative set, that comes with editable features. It contains large content boxes to add your information on topics like Business Team, Fundamental Challenges, Data Visualization Tools. You can also showcase facts, figures, and other relevant content using this PPT layout. Grab it now.
-
Search Driven Analytics Challenges Low BI Adoption Rate And Poor User Experience Background PDF
This template covers the problems while implementing search driven analytics in the organization. The challenges are failure rate for BI projects and poor user experience stifles adoption. Whether you have daily or monthly meetings, a brilliant presentation is necessary. Search Driven Analytics Challenges Low BI Adoption Rate And Poor User Experience Background PDF can be your best option for delivering a presentation. Represent everything in detail using Search Driven Analytics Challenges Low BI Adoption Rate And Poor User Experience Background PDF and make yourself stand out in meetings. The template is versatile and follows a structure that will cater to your requirements. All the templates prepared by Slidegeeks are easy to download and edit. Our research experts have taken care of the corporate themes as well. So, give it a try and see the results.
-
Guide For Marketing Analytics To Improve Decisions Website Analytics Overview For Better User Experience Demonstration PDF
The following slide illustrates brief summary of web analytics to drive more traffic and create better user experience. It includes elements such as returning visitors, traffic sources, bounce rate, page views, previews, impressions etc. Slidegeeks has constructed Guide For Marketing Analytics To Improve Decisions Website Analytics Overview For Better User Experience Demonstration PDF after conducting extensive research and examination. These presentation templates are constantly being generated and modified based on user preferences and critiques from editors. Here, you will find the most attractive templates for a range of purposes while taking into account ratings and remarks from users regarding the content. This is an excellent jumping off point to explore our content and will give new users an insight into our top notch PowerPoint Templates.
-
Statistical Big Data Social Media Analytics Users Pictures PDF
Showcasing this set of slides titled Statistical Big Data Social Media Analytics Users Pictures PDF Brochure. The topics addressed in these templates are Statistical, Social, Analytics. All the content presented in this PPT design is completely editable. Download it and make adjustments in color, background, font etc. as per your unique business setting.
-
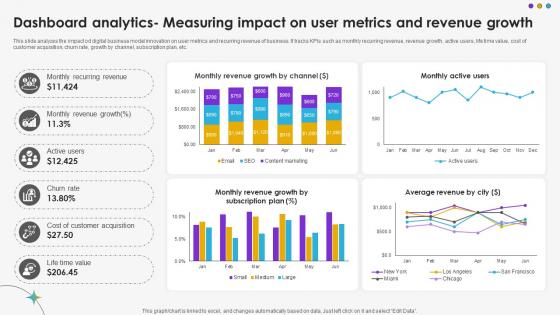
Dashboard Analytics Measuring Impact On User Metrics And Revenue Growth DT SS V
This slide analyzes the impact od digital business model innovation on user metrics and recurring revenue of business. It tracks KPIs such as monthly recurring revenue, revenue growth, active users, life time value, cost of customer acquisition, churn rate, growth by channel, subscription plan, etc.Are you searching for a Dashboard Analytics Measuring Impact On User Metrics And Revenue Growth DT SS V that is uncluttered, straightforward, and original Its easy to edit, and you can change the colors to suit your personal or business branding. For a presentation that expresses how much effort you have put in, this template is ideal With all of its features, including tables, diagrams, statistics, and lists, its perfect for a business plan presentation. Make your ideas more appealing with these professional slides. Download Dashboard Analytics Measuring Impact On User Metrics And Revenue Growth DT SS V from Slidegeeks today.
-
Product Analytics Tool 1 UX Cam For Mobile App User Behaviour Product Analytics Implementation Data Analytics V
This slide provides an overview of product analytic tool UXCam. It covers details regarding tool description, unique selling proposition and pricing plans such as free, growth and enterprise.Present like a pro with Product Analytics Tool 1 UX Cam For Mobile App User Behaviour Product Analytics Implementation Data Analytics V. Create beautiful presentations together with your team, using our easy-to-use presentation slides. Share your ideas in real-time and make changes on the fly by downloading our templates. So whether you are in the office, on the go, or in a remote location, you can stay in sync with your team and present your ideas with confidence. With Slidegeeks presentation got a whole lot easier. Grab these presentations today.
-
Product Analytics Tool 1 Ux Cam For Mobile App User Driving Business Success Integrating Product
This slide provides an overview of product analytic tool UXCam. It covers details regarding tool description, unique selling proposition and pricing plans such as free, growth and enterprise Slidegeeks is here to make your presentations a breeze with Product Analytics Tool 1 Ux Cam For Mobile App User Driving Business Success Integrating Product With our easy-to-use and customizable templates, you can focus on delivering your ideas rather than worrying about formatting. With a variety of designs to choose from, you are sure to find one that suits your needs. And with animations and unique photos, illustrations, and fonts, you can make your presentation pop. So whether you are giving a sales pitch or presenting to the board, make sure to check out Slidegeeks first


