Use Statistics PowerPoint Presentation Templates and Google Slides
-
Cobots Global Statistics Which Industry Uses The Most Cobots Rules PDF
This slide describes the usage of cobots in different industries such as the automotive industry, electrical or electronics, plastic and chemical products, and food and beverage. Slidegeeks has constructed Cobots Global Statistics Which Industry Uses The Most Cobots Rules PDF after conducting extensive research and examination. These presentation templates are constantly being generated and modified based on user preferences and critiques from editors. Here, you will find the most attractive templates for a range of purposes while taking into account ratings and remarks from users regarding the content. This is an excellent jumping off point to explore our content and will give new users an insight into our top notch PowerPoint Templates.
-
Video Streaming Technology Company Introduction Key Statistics In US Clipart PDF
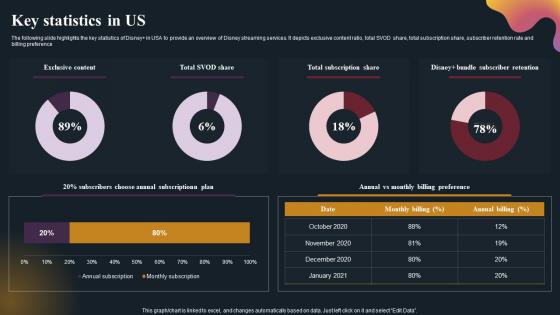
The following slide highlights the key statistics of disney plus in USA to provide an overview of disney streaming services. It depicts exclusive content ratio, total SVOD share, total subscription share, subscriber retention rate and billing preference. Welcome to our selection of the Video Streaming Technology Company Introduction Key Statistics In US Clipart PDF. These are designed to help you showcase your creativity and bring your sphere to life. Planning and Innovation are essential for any business that is just starting out. This collection contains the designs that you need for your everyday presentations. All of our PowerPoints are 100 percent editable, so you can customize them to suit your needs. This multi purpose template can be used in various situations. Grab these presentation templates today.
-
Digital Media Streaming Platform Company Profile Key Statistics In US Brochure PDF
The following slide highlights the key statistics of Disney in USA to provide an overview of Disney streaming services. It depicts exclusive content ratio, total SVOD share, total subscription share, subscriber retention rate and billing preference Want to ace your presentation in front of a live audience Our Digital Media Streaming Platform Company Profile Key Statistics In US Brochure PDF can help you do that by engaging all the users towards you. Slidegeeks experts have put their efforts and expertise into creating these impeccable powerpoint presentations so that you can communicate your ideas clearly. Moreover, all the templates are customizable, and easy to edit and downloadable. Use these for both personal and commercial use.
-
Over The Top Platform Company Profile Key Statistics In US Icons PDF
Are you in need of a template that can accommodate all of your creative concepts This one is crafted professionally and can be altered to fit any style. Use it with Google Slides or PowerPoint. Include striking photographs, symbols, depictions, and other visuals. Fill, move around, or remove text boxes as desired. Test out color palettes and font mixtures. Edit and save your work, or work with colleagues. Download Over The Top Platform Company Profile Key Statistics In US Icons PDF and observe how to make your presentation outstanding. Give an impeccable presentation to your group and make your presentation unforgettable.
-
Statistics Associated With Current Industry Trends Enhancing Workforce Productivity Using HR Rules Pdf
This slide provides glimpse about current industry statistics related to human resource hiring and selection process that help business understand the changing recruitment environment. It includes working part time,remotely,expectation of remote work,freelancing,etc.Coming up with a presentation necessitates that the majority of the effort goes into the content and the message you intend to convey. The visuals of a PowerPoint presentation can only be effective if it supplements and supports the story that is being told. Keeping this in mind our experts created Statistics Associated With Current Industry Trends Enhancing Workforce Productivity Using HR Rules Pdf to reduce the time that goes into designing the presentation. This way,you can concentrate on the message while our designers take care of providing you with the right template for the situation.
-
Key Statistics In Us OTT Platform Company Outline Brochure Pdf
The following slide highlights the key statistics of DisneyPlus in USA to provide an overview of Disney streaming services. It depicts exclusive content ratio, total SVOD share, total subscription share, subscriber retention rate and billing preference. Crafting an eye-catching presentation has never been more straightforward. Let your presentation shine with this tasteful yet straightforward Key Statistics In Us OTT Platform Company Outline Brochure Pdf template. It offers a minimalistic and classy look that is great for making a statement. The colors have been employed intelligently to add a bit of playfulness while still remaining professional. Construct the ideal Key Statistics In Us OTT Platform Company Outline Brochure Pdf that effortlessly grabs the attention of your audience Begin now and be certain to wow your customers
-
Statistics Supporting Use Of Strategic Guide For Sustainable Designs Pdf
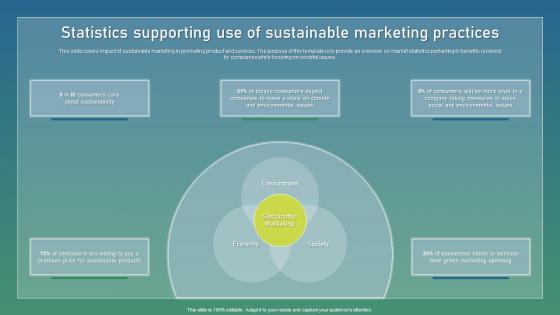
This slide covers impact of sustainable marketing in promoting product and services. The purpose of this template is to provide an overview on market statistics pertaining to benefits received by companies while focusing on societal issues. This Statistics Supporting Use Of Strategic Guide For Sustainable Designs Pdf from Slidegeeks makes it easy to present information on your topic with precision. It provides customization options, so you can make changes to the colors, design, graphics, or any other component to create a unique layout. It is also available for immediate download, so you can begin using it right away. Slidegeeks has done good research to ensure that you have everything you need to make your presentation stand out. Make a name out there for a brilliant performance.
-
Key Statistics For Edge Analytics Uses Introduction Pdf
This slide covers key statistics of Edge Analytics in various market aspects. The purpose of this template is to provide valuable insights into the current market share, profitability, and deployment models related to Edge Analytics. It includes essential data points that highlight the significance of Edge Analytics.Showcasing this set of slides titled Key Statistics For Edge Analytics Uses Introduction Pdf The topics addressed in these templates are Descriptive Analytics, Production Errors, Decrease Greenhouse All the content presented in this PPT design is completely editable. Download it and make adjustments in color, background, font etc. as per your unique business setting.
-
Key Statistics Associated Remote Transforming Medicare Services Using Health Topics Pdf
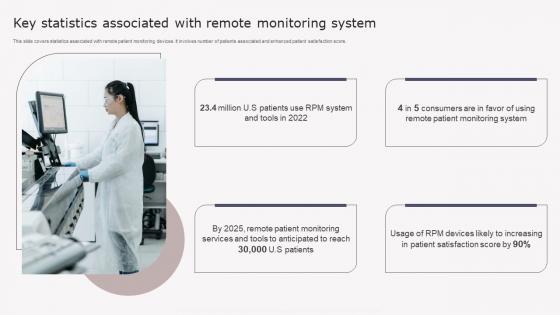
This slide covers statistics associated with remote patient monitoring devices. It involves number of patients associated and enhanced patient satisfaction score. Coming up with a presentation necessitates that the majority of the effort goes into the content and the message you intend to convey. The visuals of a PowerPoint presentation can only be effective if it supplements and supports the story that is being told. Keeping this in mind our experts created Key Statistics Associated Remote Transforming Medicare Services Using Health Topics Pdf to reduce the time that goes into designing the presentation. This way, you can concentrate on the message while our designers take care of providing you with the right template for the situation.
-
Customer Service Statistics For 2023 Using Red Ocean Strategies Professional Pdf
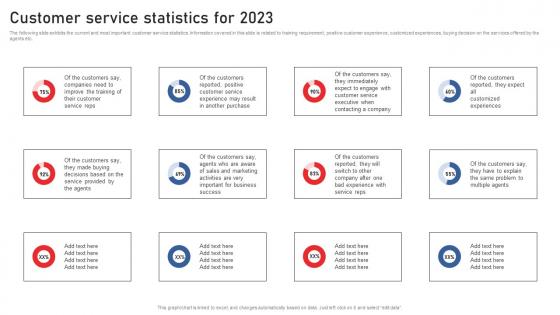
The following slide exhibits the current and most important customer service statistics. Information covered in this slide is related to training requirement, positive customer experience, customized experiences, buying decision on the services offered by the agents etc. Slidegeeks is here to make your presentations a breeze with Customer Service Statistics For 2023 Using Red Ocean Strategies Professional Pdf With our easy-to-use and customizable templates, you can focus on delivering your ideas rather than worrying about formatting. With a variety of designs to choose from, you are sure to find one that suits your needs. And with animations and unique photos, illustrations, and fonts, you can make your presentation pop. So whether you are giving a sales pitch or presenting to the board, make sure to check out Slidegeeks first
-
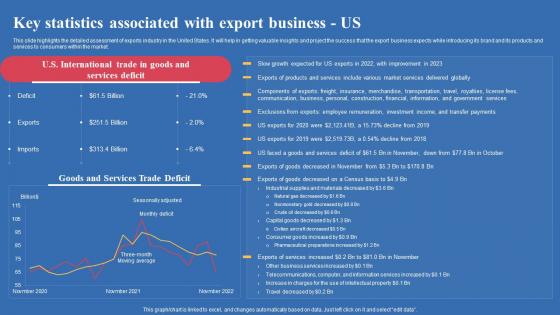
Key Statistics Associated With Export Business Us Export Business Plan Introduction Pdf
This slide highlights the detailed assessment of exports industry in the United States. It will help in getting valuable insights and project the success that the export business expects while introducing its brand and its products and services to consumers within the market. The Key Statistics Associated With Export Business Us Export Business Plan Introduction Pdf is a compilation of the most recent design trends as a series of slides. It is suitable for any subject or industry presentation, containing attractive visuals and photo spots for businesses to clearly express their messages. This template contains a variety of slides for the user to input data, such as structures to contrast two elements, bullet points, and slides for written information. Slidegeeks is prepared to create an impression.
-
Statistics Associated With Us Jewelry Industry Jewelry Business Plan Graphics Pdf
This slide focuses on jewelry market growth across United States which includes jewelry store businesses, jewelry manufacturers, specialty jewelry retail store, jewelry preferences of women, etc. Are you in need of a template that can accommodate all of your creative concepts This one is crafted professionally and can be altered to fit any style. Use it with Google Slides or PowerPoint. Include striking photographs, symbols, depictions, and other visuals. Fill, move around, or remove text boxes as desired. Test out color palettes and font mixtures. Edit and save your work, or work with colleagues. Download Statistics Associated With Us Jewelry Industry Jewelry Business Plan Graphics Pdf and observe how to make your presentation outstanding. Give an impeccable presentation to your group and make your presentation unforgettable.
-
Statistics Associated With Us Jewelry Industry Jewelry Products Business Topics Pdf
This slide focuses on jewelry market growth across United States which includes jewelry store businesses, jewelry manufacturers, specialty jewelry retail store, jewelry preferences of women, etc. Want to ace your presentation in front of a live audience Our Statistics Associated With Us Jewelry Industry Jewelry Products Business Topics Pdf can help you do that by engaging all the users towards you. Slidegeeks experts have put their efforts and expertise into creating these impeccable powerpoint presentations so that you can communicate your ideas clearly. Moreover, all the templates are customizable, and easy-to-edit and downloadable. Use these for both personal and commercial use.
-
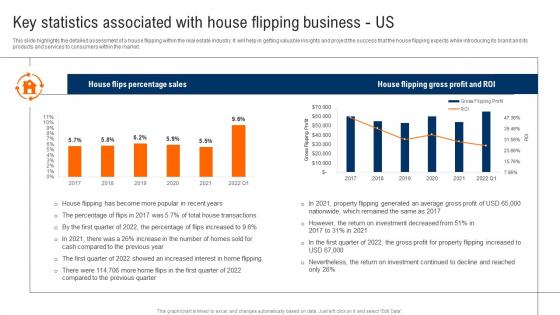
Key Statistics Associated With House Flipping Business Us Real Estate Renovation Designs Pdf
This slide highlights the detailed assessment of a house flipping within the real estate industry. It will help in getting valuable insights and project the success that the house flipping expects while introducing its brand and its products and services to consumers within the market. Find a pre-designed and impeccable Key Statistics Associated With House Flipping Business Us Real Estate Renovation Designs Pdf The templates can ace your presentation without additional effort. You can download these easy-to-edit presentation templates to make your presentation stand out from others. So, what are you waiting for Download the template from Slidegeeks today and give a unique touch to your presentation.
-
Big Data Use Statistics Icon Ppt Ideas Layouts pdf
Pitch your topic with ease and precision using this Big Data Use Statistics Icon Ppt Ideas Layouts pdf. This layout presents information on Big Data, Use Statistics, Icon. It is also available for immediate download and adjustment. So, changes can be made in the color, design, graphics or any other component to create a unique layout.
-
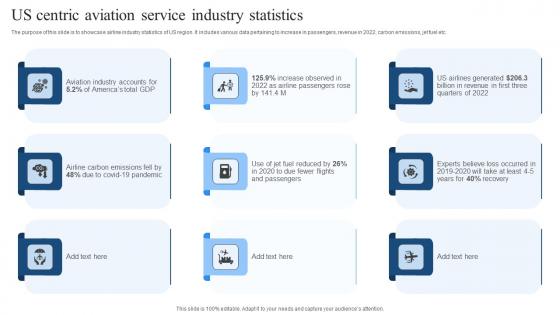
Us Centric Aviation Service Industry Statistics Diagrams Pdf
The purpose of this slide is to showcase airline industry statistics of US region. It includes various data pertaining to increase in passengers, revenue in 2022, carbon emissions, jet fuel etc. Pitch your topic with ease and precision using this Us Centric Aviation Service Industry Statistics Diagrams Pdf. This layout presents information on Carbon Emissions, Airline Passengers. It is also available for immediate download and adjustment. So, changes can be made in the color, design, graphics or any other component to create a unique layout.
-
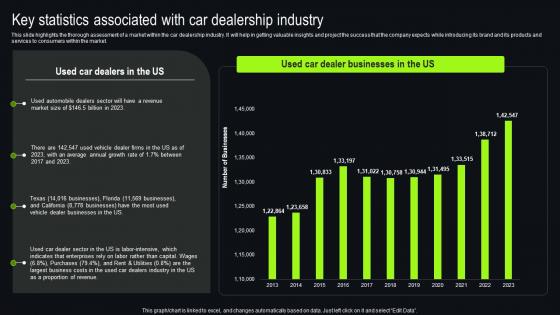
Key Statistics Associated With Car Dealership Industry New And Used Car Dealership Brochure Pdf
This slide highlights the thorough assessment of a market within the car dealership industry. It will help in getting valuable insights and project the success that the company expects while introducing its brand and its products and services to consumers within the market. The Key Statistics Associated With Car Dealership Industry New And Used Car Dealership Brochure Pdf is a compilation of the most recent design trends as a series of slides. It is suitable for any subject or industry presentation, containing attractive visuals and photo spots for businesses to clearly express their messages. This template contains a variety of slides for the user to input data, such as structures to contrast two elements, bullet points, and slides for written information. Slidegeeks is prepared to create an impression.
-
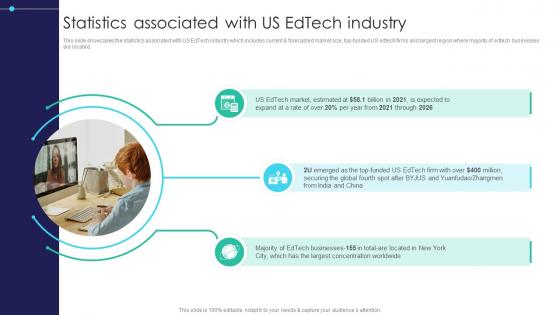
Global Digital Education Statistics Associated With Us Edtech Industry IR SS V
This slide showcases the statistics associated with US EdTech industry which includes current and forecasted market size, top-funded US edtech firms and largest region where majority of edtech businesses are located. Want to ace your presentation in front of a live audience Our Global Digital Education Statistics Associated With Us Edtech Industry IR SS V can help you do that by engaging all the users towards you. Slidegeeks experts have put their efforts and expertise into creating these impeccable powerpoint presentations so that you can communicate your ideas clearly. Moreover, all the templates are customizable, and easy-to-edit and downloadable. Use these for both personal and commercial use.
-
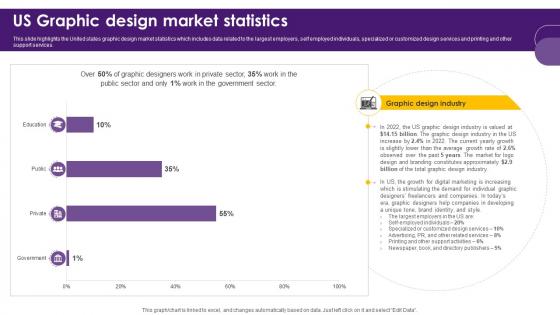
Creative Agency Business Plan Us Graphic Design Market Statistics BP SS V
This slide highlights the United states graphic design market statistics which includes data related to the largest employers, self employed individuals, specialized or customized design services and printing and other support services. Slidegeeks is one of the best resources for PowerPoint templates. You can download easily and regulate Creative Agency Business Plan Us Graphic Design Market Statistics BP SS V for your personal presentations from our wonderful collection. A few clicks is all it takes to discover and get the most relevant and appropriate templates. Use our Templates to add a unique zing and appeal to your presentation and meetings. All the slides are easy to edit and you can use them even for advertisement purposes.
-
Spa Resort Business Plan Statistics Associated With Us Resort Industry BP SS V
This slide focuses on resort market growth across United States which includes resort restaurant sales, consumption percentage by Americans, frozen resort segment, etc. Create an editable Spa Resort Business Plan Statistics Associated With Us Resort Industry BP SS V that communicates your idea and engages your audience. Whether you are presenting a business or an educational presentation, pre-designed presentation templates help save time. Spa Resort Business Plan Statistics Associated With Us Resort Industry BP SS V is highly customizable and very easy to edit, covering many different styles from creative to business presentations. Slidegeeks has creative team members who have crafted amazing templates. So, go and get them without any delay.
-
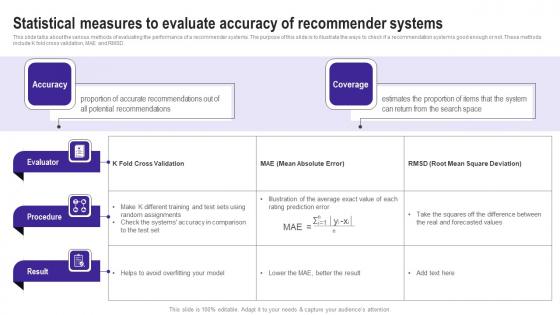
Statistical Measures To Evaluate Accuracy Of Use Cases Of Filtering Methods Introduction Pdf
This slide talks about the various methods of evaluating the performance of a recommender systems. The purpose of this slide is to illustrate the ways to check if a recommendation system is good enough or not. These methods include K fold cross validation, MAE and RMSD. Formulating a presentation can take up a lot of effort and time, so the content and message should always be the primary focus. The visuals of the PowerPoint can enhance the presenters message, so our Statistical Measures To Evaluate Accuracy Of Use Cases Of Filtering Methods Introduction Pdf was created to help save time. Instead of worrying about the design, the presenter can concentrate on the message while our designers work on creating the ideal templates for whatever situation is needed. Slidegeeks has experts for everything from amazing designs to valuable content, we have put everything into Statistical Measures To Evaluate Accuracy Of Use Cases Of Filtering Methods Introduction Pdf
-
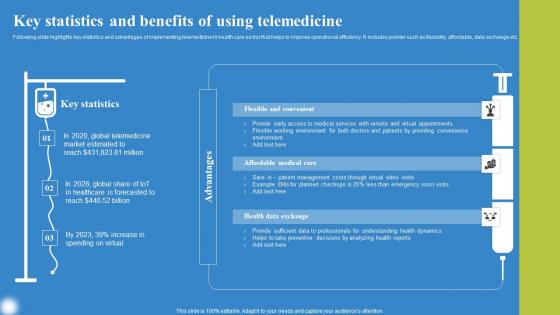
Key Statistics And Benefits Using Deploying IoT Solutions For Enhanced Healthcare Demonstration Pdf
Following slide highlights key statistics and advantages of implementing telemedicine in health care sector that helps to improve operational efficiency. It includes pointer such as flexibility, affordable, data exchange etc. Do you have an important presentation coming up Are you looking for something that will make your presentation stand out from the rest Look no further than Key Statistics And Benefits Using Deploying IoT Solutions For Enhanced Healthcare Demonstration Pdf. With our professional designs, you can trust that your presentation will pop and make delivering it a smooth process. And with Slidegeeks, you can trust that your presentation will be unique and memorable. So why wait Grab Key Statistics And Benefits Using Deploying IoT Solutions For Enhanced Healthcare Demonstration Pdf today and make your presentation stand out from the rest
-
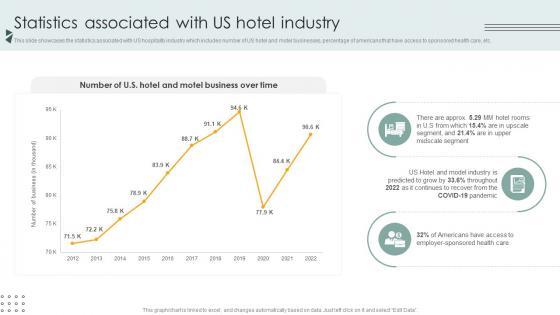
Statistics Associated With Us Hotel Industry Lodging And Accommodation Industry IR SS V
This slide showcases the statistics associated with US hospitality industry which includes number of US hotel and motel businesses, percentage of americans that have access to sponsored health care, etc. Want to ace your presentation in front of a live audience Our Statistics Associated With Us Hotel Industry Lodging And Accommodation Industry IR SS V can help you do that by engaging all the users towards you. Slidegeeks experts have put their efforts and expertise into creating these impeccable powerpoint presentations so that you can communicate your ideas clearly. Moreover, all the templates are customizable, and easy-to-edit and downloadable. Use these for both personal and commercial use.
-
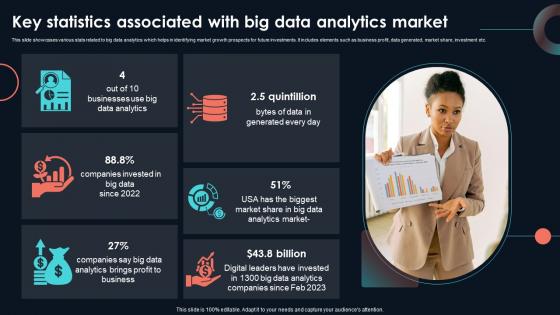
Key Statistics Associated With Big Data Developing Strategic Insights Using Big Data Analytics SS V
This slide showcases various stats related to big data analytics which helps in identifying market growth prospects for future investments. It includes elements such as business profit, data generated, market share, investment etc. If you are looking for a format to display your unique thoughts, then the professionally designed Key Statistics Associated With Big Data Developing Strategic Insights Using Big Data Analytics SS V is the one for you. You can use it as a Google Slides template or a PowerPoint template. Incorporate impressive visuals, symbols, images, and other charts. Modify or reorganize the text boxes as you desire. Experiment with shade schemes and font pairings. Alter, share or cooperate with other people on your work. Download Key Statistics Associated With Big Data Developing Strategic Insights Using Big Data Analytics SS V and find out how to give a successful presentation. Present a perfect display to your team and make your presentation unforgettable.
-
Key Statistics Associated With IoT Use In Banking Sector IoT In Banking For Digital Future IoT SS V
Following slide depicts key statistics to understand growth and potential of IoT devices implementation in banking and financial services. It covers elements such as market size, CAGR, bank adoption rate, IoT based banking applications, etc. Welcome to our selection of the Key Statistics Associated With IoT Use In Banking Sector IoT In Banking For Digital Future IoT SS V. These are designed to help you showcase your creativity and bring your sphere to life. Planning and Innovation are essential for any business that is just starting out. This collection contains the designs that you need for your everyday presentations. All of our PowerPoints are 100Percent editable, so you can customize them to suit your needs. This multi-purpose template can be used in various situations. Grab these presentation templates today.
-
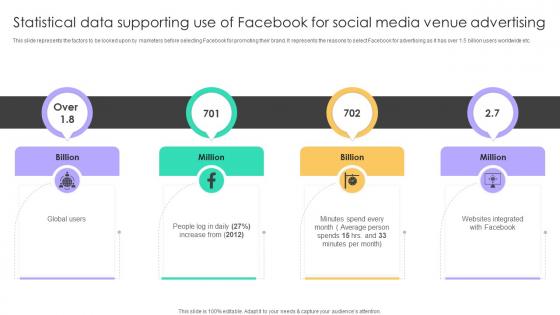
Online Venue Advertising Plan Statistical Data Supporting Use Of Facebook For Social Media Strategy SS V
This slide represents the factors to be looked upon by marketers before selecting Facebook for promoting their brand. It represents the reasons to select Facebook for advertising as it has over 1.5 billion users worldwide etc. The Online Venue Advertising Plan Statistical Data Supporting Use Of Facebook For Social Media Strategy SS V is a compilation of the most recent design trends as a series of slides. It is suitable for any subject or industry presentation, containing attractive visuals and photo spots for businesses to clearly express their messages. This template contains a variety of slides for the user to input data, such as structures to contrast two elements, bullet points, and slides for written information. Slidegeeks is prepared to create an impression.
-
Statistical Data Supporting Use Of Instagram For Social Media Online Venue Advertising Plan Strategy SS V
This slide represents the statistical data showcasing the use of Instagram by various age groups in order to support the use of Instagram by marketers for promoting venue. It includes details related to use of Instagram by different age groups. Do you have an important presentation coming up Are you looking for something that will make your presentation stand out from the rest Look no further than Statistical Data Supporting Use Of Instagram For Social Media Online Venue Advertising Plan Strategy SS V. With our professional designs, you can trust that your presentation will pop and make delivering it a smooth process. And with Slidegeeks, you can trust that your presentation will be unique and memorable. So why wait Grab Statistical Data Supporting Use Of Instagram For Social Media Online Venue Advertising Plan Strategy SS V today and make your presentation stand out from the rest.
-
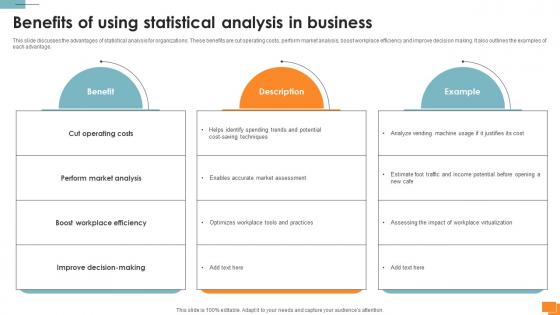
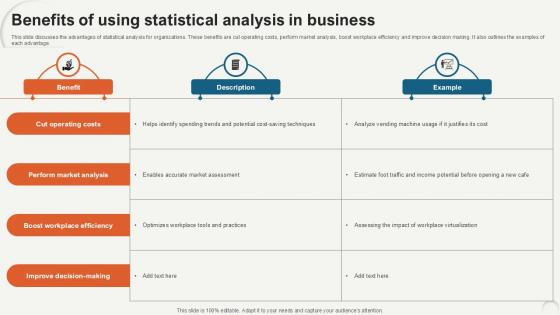
Statistical Tools For Evidence Benefits Of Using Statistical Analysis In Business
This slide discusses the advantages of statistical analysis for organizations. These benefits are cut operating costs, perform market analysis, boost workplace efficiency and improve decision making. It also outlines the examples of each advantage. Present like a pro with Statistical Tools For Evidence Benefits Of Using Statistical Analysis In Business. Create beautiful presentations together with your team, using our easy-to-use presentation slides. Share your ideas in real-time and make changes on the fly by downloading our templates. So whether you are in the office, on the go, or in a remote location, you can stay in sync with your team and present your ideas with confidence. With Slidegeeks presentation got a whole lot easier. Grab these presentations today.
-
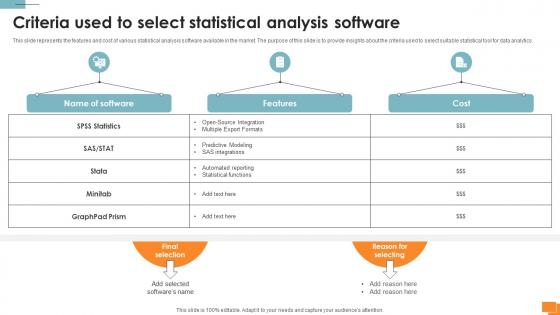
Statistical Tools For Evidence Criteria Used To Select Statistical Analysis Software
This slide represents the features and cost of various statistical analysis software available in the market. The purpose of this slide is to provide insights about the criteria used to select suitable statistical tool for data analytics. If your project calls for a presentation, then Slidegeeks is your go-to partner because we have professionally designed, easy-to-edit templates that are perfect for any presentation. After downloading, you can easily edit Statistical Tools For Evidence Criteria Used To Select Statistical Analysis Software and make the changes accordingly. You can rearrange slides or fill them with different images. Check out all the handy templates
-
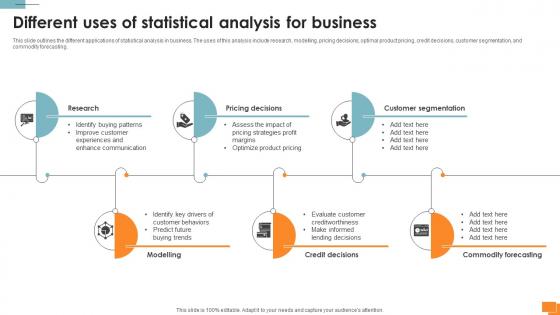
Statistical Tools For Evidence Different Uses Of Statistical Analysis For Business
This slide outlines the different applications of statistical analysis in business. The uses of this analysis include research, modelling, pricing decisions, optimal product pricing, credit decisions, customer segmentation, and commodity forecasting. Formulating a presentation can take up a lot of effort and time, so the content and message should always be the primary focus. The visuals of the PowerPoint can enhance the presenters message, so our Statistical Tools For Evidence Different Uses Of Statistical Analysis For Business was created to help save time. Instead of worrying about the design, the presenter can concentrate on the message while our designers work on creating the ideal templates for whatever situation is needed. Slidegeeks has experts for everything from amazing designs to valuable content, we have put everything into Statistical Tools For Evidence Different Uses Of Statistical Analysis For Business.
-
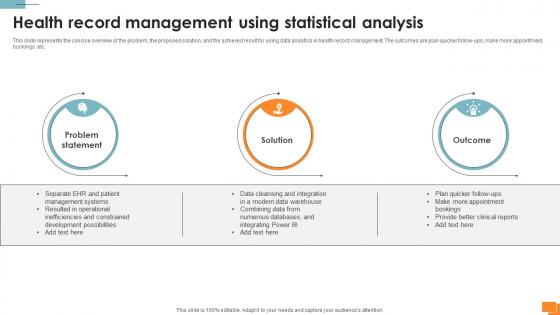
Statistical Tools For Evidence Health Record Management Using Statistical Analysis
This slide represents the concise overview of the problem, the proposed solution, and the achieved result for using data analytics in health record management. The outcomes are plan quicker follow-ups, make more appointment bookings, etc. This Statistical Tools For Evidence Health Record Management Using Statistical Analysis is perfect for any presentation, be it in front of clients or colleagues. It is a versatile and stylish solution for organizing your meetings. The Statistical Tools For Evidence Health Record Management Using Statistical Analysis features a modern design for your presentation meetings. The adjustable and customizable slides provide unlimited possibilities for acing up your presentation. Slidegeeks has done all the homework before launching the product for you. So, do not wait, grab the presentation templates today
-
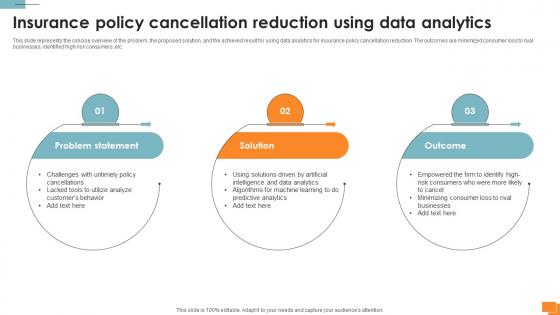
Statistical Tools For Evidence Insurance Policy Cancellation Reduction Using Data Analytics
This slide represents the concise overview of the problem, the proposed solution, and the achieved result for using data analytics for insurance policy cancellation reduction. The outcomes are minimized consumer loss to rival businesses, identified high risk consumers, etc. The best PPT templates are a great way to save time, energy, and resources. Slidegeeks have 100 percent editable powerpoint slides making them incredibly versatile. With these quality presentation templates, you can create a captivating and memorable presentation by combining visually appealing slides and effectively communicating your message. Download Statistical Tools For Evidence Insurance Policy Cancellation Reduction Using Data Analytics from Slidegeeks and deliver a wonderful presentation.
-
Statistical Tools For Evidence Statistical And Data Analysis Techniques Used
This slide outlines the statistical and data analysis methods applied in different fields. These domains are spatial models, time series, survival analysis, market segmentation, recommendation systems, attribution modeling, clustering, etc. There are so many reasons you need a Statistical Tools For Evidence Statistical And Data Analysis Techniques Used. The first reason is you can not spend time making everything from scratch, Thus, Slidegeeks has made presentation templates for you too. You can easily download these templates from our website easily.
-
Benefits Of Using Statistical Data Analytics For Informed Decision Ppt PowerPoint
This slide discusses the advantages of statistical analysis for organizations. These benefits are cut operating costs, perform market analysis, boost workplace efficiency and improve decision making. It also outlines the examples of each advantage. Want to ace your presentation in front of a live audience Our Benefits Of Using Statistical Data Analytics For Informed Decision Ppt PowerPoint can help you do that by engaging all the users towards you. Slidegeeks experts have put their efforts and expertise into creating these impeccable powerpoint presentations so that you can communicate your ideas clearly. Moreover, all the templates are customizable, and easy-to-edit and downloadable. Use these for both personal and commercial use.
-
Criteria Used To Select Statistical Data Analytics For Informed Decision Ppt Sample
This slide represents the features and cost of various statistical analysis software available in the market. The purpose of this slide is to provide insights about the criteria used to select suitable statistical tool for data analytics. Present like a pro with Criteria Used To Select Statistical Data Analytics For Informed Decision Ppt Sample. Create beautiful presentations together with your team, using our easy-to-use presentation slides. Share your ideas in real-time and make changes on the fly by downloading our templates. So whether you are in the office, on the go, or in a remote location, you can stay in sync with your team and present your ideas with confidence. With Slidegeeks presentation got a whole lot easier. Grab these presentations today.
-
Different Uses Of Statistical Data Analytics For Informed Decision Ppt Slide
This slide outlines the different applications of statistical analysis in business. The uses of this analysis include research, modelling, pricing decisions, optimal product pricing, credit decisions, customer segmentation, and commodity forecasting. If your project calls for a presentation, then Slidegeeks is your go-to partner because we have professionally designed, easy-to-edit templates that are perfect for any presentation. After downloading, you can easily edit Different Uses Of Statistical Data Analytics For Informed Decision Ppt Slide and make the changes accordingly. You can rearrange slides or fill them with different images. Check out all the handy templates
-
Key Statistics Associated With RPA Use Cases In Different Industries PPT Slide AI SS V
This slide highlights key statistics associated with robotic process automation. It showcases stats related to market size, growth rate in future, startup RPA adoption, automated business processes etc. Formulating a presentation can take up a lot of effort and time, so the content and message should always be the primary focus. The visuals of the PowerPoint can enhance the presenters message, so our Key Statistics Associated With RPA Use Cases In Different Industries PPT Slide AI SS V was created to help save time. Instead of worrying about the design, the presenter can concentrate on the message while our designers work on creating the ideal templates for whatever situation is needed. Slidegeeks has experts for everything from amazing designs to valuable content, we have put everything into Key Statistics Associated With RPA Use Cases In Different Industries PPT Slide AI SS V


