Tableau as visualization PowerPoint Presentation Templates and Google Slides
-
Graphical Representation Of Research IT Tableau As Visualization Research Tool Graphics PDF
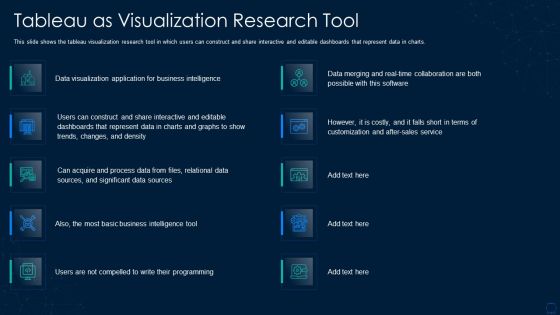
This slide shows the tableau visualization research tool in which users can construct and share interactive and editable dashboards that represent data in charts. Deliver and pitch your topic in the best possible manner with this graphical representation of research it tableau as visualization research tool graphics pdf. Use them to share invaluable insights on process data, sources, sales, application and impress your audience. This template can be altered and modified as per your expectations. So, grab it now.
-
Departments Of Visualization Research Tableau As Visualization Research Tool Demonstration PDF
This slide shows the tableau visualization research tool in which users can construct and share interactive and editable dashboards that represent data in charts.Presenting Departments Of Visualization Research Tableau As Visualization Research Tool Demonstration PDF to provide visual cues and insights. Share and navigate important information on ten stages that need your due attention. This template can be used to pitch topics like Business Intelligence, Dashboards That Represent, Business Intelligence In addtion, this PPT design contains high resolution images, graphics, etc, that are easily editable and available for immediate download.
-
Tableau As Visualization Research Tool Inspiration PDF
This slide shows the tableau visualization research tool in which users can construct and share interactive and editable dashboards that represent data in charts. Find highly impressive Tableau As Visualization Research Tool Inspiration PDF on Slidegeeks to deliver a meaningful presentation. You can save an ample amount of time using these presentation templates. No need to worry to prepare everything from scratch because Slidegeeks experts have already done a huge research and work for you. You need to download Tableau As Visualization Research Tool Inspiration PDF for your upcoming presentation. All the presentation templates are 100 percent editable and you can change the color and personalize the content accordingly. Download now.
-
Branches For Visualization Research And Development Tableau As Visualization Research Introduction PDF
This slide shows the tableau visualization research tool in which users can construct and share interactive and editable dashboards that represent data in charts. This modern and well-arranged Branches For Visualization Research And Development Tableau As Visualization Research Introduction PDF provides lots of creative possibilities. It is very simple to customize and edit with the Powerpoint Software. Just drag and drop your pictures into the shapes. All facets of this template can be edited with Powerpoint, no extra software is necessary. Add your own material, put your images in the places assigned for them, adjust the colors, and then you can show your slides to the world, with an animated slide included.


