Statistic graphic PowerPoint Presentation Templates and Google Slides
-
Virtual Event Marketing Overview And Statistics Graphics PDF
This slide provides an overview of virtual event and the key tasks to pe performed to promote event. Major tasks covered are identify target audience, conduct live polling, send emails, etc. Slidegeeks is here to make your presentations a breeze with Virtual Event Marketing Overview And Statistics Graphics PDF With our easy to use and customizable templates, you can focus on delivering your ideas rather than worrying about formatting. With a variety of designs to choose from, you are sure to find one that suits your needs. And with animations and unique photos, illustrations, and fonts, you can make your presentation pop. So whether you are giving a sales pitch or presenting to the board, make sure to check out Slidegeeks first.
-
Viral Marketing Techniques To Increase Annual Business Sales Word Of Mouth Promotion Statistics Marketing Graphics PDF
This slide showcases promotional statistics which can help marketers in assessing WOM marketing effectiveness. It provides details about customer spending, sales, outlay, brand awareness, paid media initiatives, customer sales, etc. Formulating a presentation can take up a lot of effort and time, so the content and message should always be the primary focus. The visuals of the PowerPoint can enhance the presenters message, so our Viral Marketing Techniques To Increase Annual Business Sales Word Of Mouth Promotion Statistics Marketing Graphics PDF was created to help save time. Instead of worrying about the design, the presenter can concentrate on the message while our designers work on creating the ideal templates for whatever situation is needed. Slidegeeks has experts for everything from amazing designs to valuable content, we have put everything into Viral Marketing Techniques To Increase Annual Business Sales Word Of Mouth Promotion Statistics Marketing Graphics PDF
-
Cashless Payment Strategies To Enhance Business Performance QR Code Payment Key Statistics Graphics PDF
Mentioned slide highlights key statistics associated with Quick Response QR code which can be used by businesses to go contactless. It includes key points such as QR code usage, transaction value, people usage percentage, QR payment growth in the US, etc. Slidegeeks is one of the best resources for PowerPoint templates. You can download easily and regulate Cashless Payment Strategies To Enhance Business Performance QR Code Payment Key Statistics Graphics PDF for your personal presentations from our wonderful collection. A few clicks is all it takes to discover and get the most relevant and appropriate templates. Use our Templates to add a unique zing and appeal to your presentation and meetings. All the slides are easy to edit and you can use them even for advertisement purposes.
-
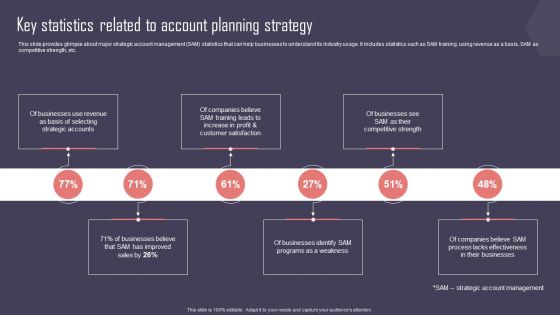
Key Business Account Management And Planning Techniques Key Statistics Related To Account Planning Strategy Graphics PDF
This slide provides glimpse about major strategic account management SAM statistics that can help businesses to understand its industry usage. It includes statistics such as SAM training, using revenue as a basis, SAM as competitive strength, etc. If you are looking for a format to display your unique thoughts, then the professionally designed Key Business Account Management And Planning Techniques Key Statistics Related To Account Planning Strategy Graphics PDF is the one for you. You can use it as a Google Slides template or a PowerPoint template. Incorporate impressive visuals, symbols, images, and other charts. Modify or reorganize the text boxes as you desire. Experiment with shade schemes and font pairings. Alter, share or cooperate with other people on your work. Download Key Business Account Management And Planning Techniques Key Statistics Related To Account Planning Strategy Graphics PDF and find out how to give a successful presentation. Present a perfect display to your team and make your presentation unforgettable.
-
Customer Segmentation Key Statistics Highlights Ppt Layouts Graphics PDF
This slide presents statistics showing impact of appropriate customer segmentation and profiling on organization. It highlights information about customer churn rate, sales revenue, customer experience, targeting and positioning, recurring revenue, distribution channel, price optimization, brand awareness, etc.Take your projects to the next level with our ultimate collection of Customer Segmentation Key Statistics Highlights Ppt Layouts Graphics PDF. Slidegeeks has designed a range of layouts that are perfect for representing task or activity duration, keeping track of all your deadlines at a glance. Tailor these designs to your exact needs and give them a truly corporate look with your own brand colors they will make your projects stand out from the rest.
-
Key Informational Statistics On Workplace Conflict Ppt Infographics Graphics Design PDF
The purpose of this slide is to outline latest workplace conflict statistics. It covers information about employees experiencing verbal abuse, 6 month conflict between key stakeholders, employees feeling stress level etc. This Key Informational Statistics On Workplace Conflict Ppt Infographics Graphics Design PDF is perfect for any presentation, be it in front of clients or colleagues. It is a versatile and stylish solution for organizing your meetings. The product features a modern design for your presentation meetings. The adjustable and customizable slides provide unlimited possibilities for acing up your presentation. Slidegeeks has done all the homework before launching the product for you. So, do not wait, grab the presentation templates today
-
Industry Wise Email Marketing Performance Statistics Analysis Graphics PDF
This slide includes email marketing benchmarks and statistics for the year 2022 based on various industries. It includes email metrics such as open rate, CTR, unsubscribes rate in industries like automobile, finance, retail, food, legal services, etc. Pitch your topic with ease and precision using this Industry Wise Email Marketing Performance Statistics Analysis Graphics PDF. This layout presents information on Automobile, Financial Service, Legal Services. It is also available for immediate download and adjustment. So, changes can be made in the color, design, graphics or any other component to create a unique layout.
-
Various E Mail Campaign Performance Statistics Analysis Graphics PDF
The purpose of this slide is to evaluate the different e-mail campaign performance outcomes between the year 2021-2022. E-mail categories include discounts and offers, advice, info or tutorial, confirmations or updates etc. Showcasing this set of slides titled Various E Mail Campaign Performance Statistics Analysis Graphics PDF. The topics addressed in these templates are Various E Mail Campaign, Performance Statistics Analysis. All the content presented in this PPT design is completely editable. Download it and make adjustments in color, background, font etc. as per your unique business setting.
-
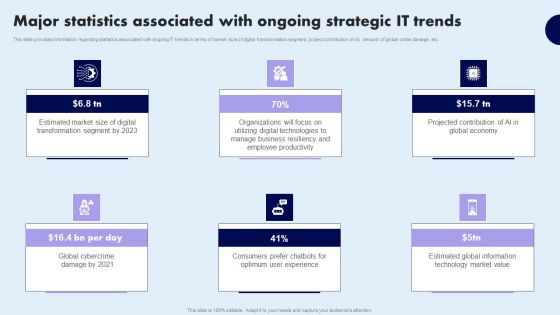
Major Statistics Associated With Ongoing Strategic IT Trends Graphics PDF
This slide provides information regarding statistics associated with ongoing IT trends in terms of market size of digital transformation segment, project contribution of AI, amount of global crime damage, etc. Take your projects to the next level with our ultimate collection of Major Statistics Associated With Ongoing Strategic IT Trends Graphics PDF. Slidegeeks has designed a range of layouts that are perfect for representing task or activity duration, keeping track of all your deadlines at a glance. Tailor these designs to your exact needs and give them a truly corporate look with your own brand colors they will make your projects stand out from the rest
-
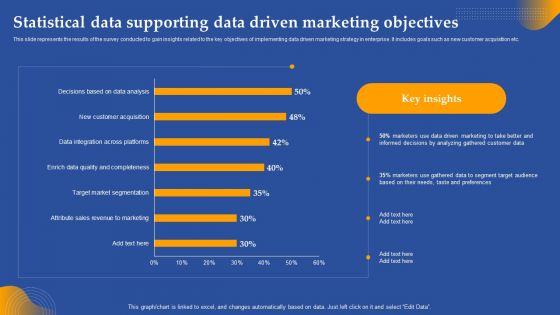
Statistical Data Supporting Data Driven Marketing Objectives Ppt Gallery Graphics Tutorials PDF
This slide represents the results of the survey conducted to gain insights related to the key objectives of implementing data driven marketing strategy in enterprise. It includes goals such as new customer acquisition etc. Whether you have daily or monthly meetings, a brilliant presentation is necessary. Statistical Data Supporting Data Driven Marketing Objectives Ppt Gallery Graphics Tutorials PDF can be your best option for delivering a presentation. Represent everything in detail using Statistical Data Supporting Data Driven Marketing Objectives Ppt Gallery Graphics Tutorials PDF and make yourself stand out in meetings. The template is versatile and follows a structure that will cater to your requirements. All the templates prepared by Slidegeeks are easy to download and edit. Our research experts have taken care of the corporate themes as well. So, give it a try and see the results.
-
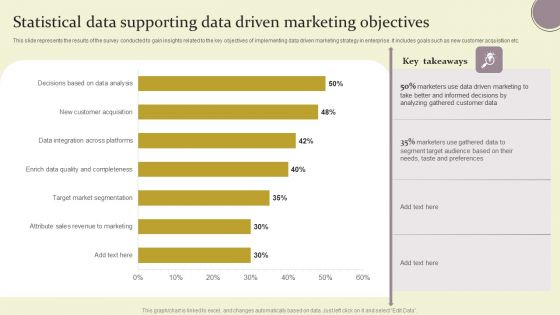
Statistical Data Supporting Data Driven Marketing Objectives Ppt Inspiration Graphics Pictures PDF
This slide represents the results of the survey conducted to gain insights related to the key objectives of implementing data driven marketing strategy in enterprise. It includes goals such as new customer acquisition etc. Whether you have daily or monthly meetings, a brilliant presentation is necessary. Statistical Data Supporting Data Driven Marketing Objectives Ppt Inspiration Graphics Pictures PDF can be your best option for delivering a presentation. Represent everything in detail using Statistical Data Supporting Data Driven Marketing Objectives Ppt Inspiration Graphics Pictures PDF and make yourself stand out in meetings. The template is versatile and follows a structure that will cater to your requirements. All the templates prepared by Slidegeeks are easy to download and edit. Our research experts have taken care of the corporate themes as well. So, give it a try and see the results.
-
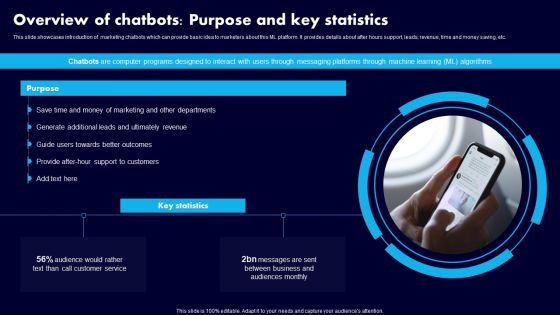
Overview Of Chatbots Purpose And Key Statistics Ppt Show Graphics Design PDF
This slide showcases introduction of marketing chatbots which can provide basic idea to marketers about this ML platform. It provides details about after hours support, leads, revenue, time and money saving, etc. Create an editable Overview Of Chatbots Purpose And Key Statistics Ppt Show Graphics Design PDF that communicates your idea and engages your audience. Whether you are presenting a business or an educational presentation, pre-designed presentation templates help save time. Overview Of Chatbots Purpose And Key Statistics Ppt Show Graphics Design PDF is highly customizable and very easy to edit, covering many different styles from creative to business presentations. Slidegeeks has creative team members who have crafted amazing templates. So, go and get them without any delay.
-
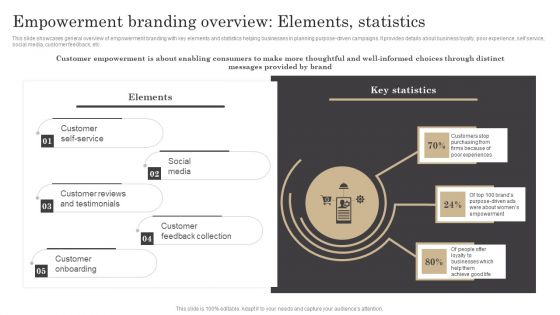
Empowerment Branding Overview Elements Statistics Ppt Ideas Graphics PDF
This slide showcases general overview of empowerment branding with key elements and statistics helping businesses in planning purpose-driven campaigns. It provides details about business loyalty, poor experience, self service, social media, customer feedback, etc. This Empowerment Branding Overview Elements Statistics Ppt Ideas Graphics PDF is perfect for any presentation, be it in front of clients or colleagues. It is a versatile and stylish solution for organizing your meetings. The product features a modern design for your presentation meetings. The adjustable and customizable slides provide unlimited possibilities for acing up your presentation. Slidegeeks has done all the homework before launching the product for you. So, do not wait, grab the presentation templates today
-
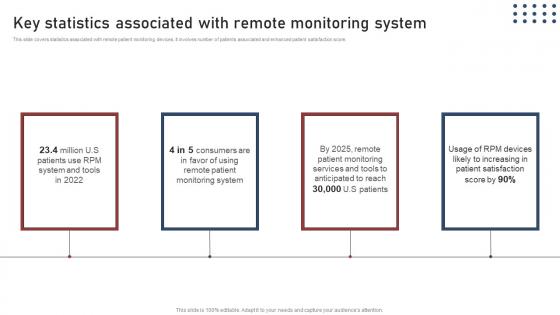
Key Statistics Associated Transforming Medical Workflows Via His Integration Graphics Pdf
This slide covers statistics associated with remote patient monitoring devices. It involves number of patients associated and enhanced patient satisfaction score. The best PPT templates are a great way to save time, energy, and resources. Slidegeeks have 100 percent editable powerpoint slides making them incredibly versatile. With these quality presentation templates, you can create a captivating and memorable presentation by combining visually appealing slides and effectively communicating your message. Download Key Statistics Associated Transforming Medical Workflows Via His Integration Graphics Pdf from Slidegeeks and deliver a wonderful presentation.
-
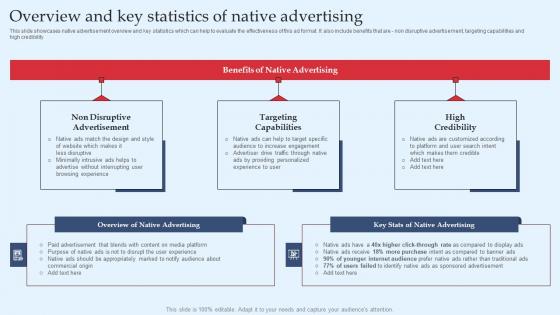
Overview And Key Statistics Of Native Advertising Strategic Performance Marketing Graphics Pdf
This slide showcases native advertisement overview and key statistics which can help to evaluate the effectiveness of this ad format. It also include benefits that are - non disruptive advertisement, targeting capabilities and high credibility. Slidegeeks is one of the best resources for PowerPoint templates. You can download easily and regulate Overview And Key Statistics Of Native Advertising Strategic Performance Marketing Graphics Pdf for your personal presentations from our wonderful collection. A few clicks is all it takes to discover and get the most relevant and appropriate templates. Use our Templates to add a unique zing and appeal to your presentation and meetings. All the slides are easy to edit and you can use them even for advertisement purposes.
-
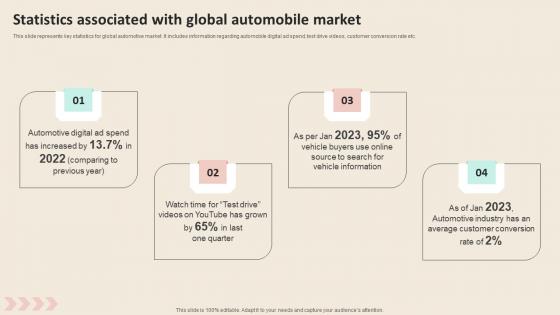
Statistics Associated With Global Automobile Market Promotional Strategies To Increase Graphics PDF
This slide represents key statistics for global automotive market. It includes information regarding automobile digital ad spend, test drive videos, customer conversion rate etc. Take your projects to the next level with our ultimate collection of Statistics Associated With Global Automobile Market Promotional Strategies To Increase Graphics PDF. Slidegeeks has designed a range of layouts that are perfect for representing task or activity duration, keeping track of all your deadlines at a glance. Tailor these designs to your exact needs and give them a truly corporate look with your own brand colors they will make your projects stand out from the rest
-
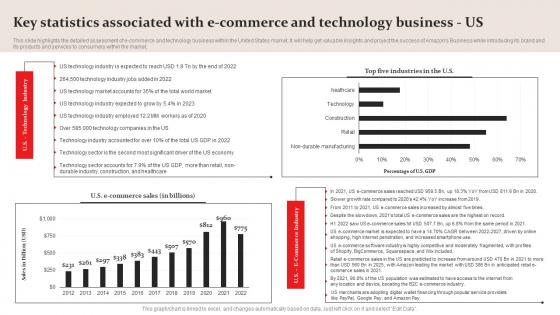
Key Statistics Associated E Commerce Amazon Business Plan Go To Market Strategy Graphics Pdf
This slide highlights the detailed assessment of e commerce and technology business within the United States market. It will help get valuable insights and project the success of Amazons Business while introducing its brand and its products and services to consumers within the market. Are you searching for a Key Statistics Associated E Commerce Amazon Business Plan Go To Market Strategy Graphics Pdf that is uncluttered, straightforward, and original Its easy to edit, and you can change the colors to suit your personal or business branding. For a presentation that expresses how much effort you have put in, this template is ideal With all of its features, including tables, diagrams, statistics, and lists, its perfect for a business plan presentation. Make your ideas more appealing with these professional slides. Download Key Statistics Associated E Commerce Amazon Business Plan Go To Market Strategy Graphics Pdf from Slidegeeks today.
-
Fast Food Burger Restaurant Market Size And Statistics Fast Food Business Plan Graphics Pdf
This slide provides a glimpse about the fast food burger restaurant business market size, its overview and key statistics. The purpose of this slide is concerning with the overview of fast-food burger key stats, company ranking with total locations available, its growth, demand and overall sales done by retail and growth prospects. If your project calls for a presentation, then Slidegeeks is your go-to partner because we have professionally designed, easy-to-edit templates that are perfect for any presentation. After downloading, you can easily edit Fast Food Burger Restaurant Market Size And Statistics Fast Food Business Plan Graphics Pdf and make the changes accordingly. You can rearrange slides or fill them with different images. Check out all the handy templates
-
Statistics Associated With Us Jewelry Industry Jewelry Business Plan Graphics Pdf
This slide focuses on jewelry market growth across United States which includes jewelry store businesses, jewelry manufacturers, specialty jewelry retail store, jewelry preferences of women, etc. Are you in need of a template that can accommodate all of your creative concepts This one is crafted professionally and can be altered to fit any style. Use it with Google Slides or PowerPoint. Include striking photographs, symbols, depictions, and other visuals. Fill, move around, or remove text boxes as desired. Test out color palettes and font mixtures. Edit and save your work, or work with colleagues. Download Statistics Associated With Us Jewelry Industry Jewelry Business Plan Graphics Pdf and observe how to make your presentation outstanding. Give an impeccable presentation to your group and make your presentation unforgettable.
-
Retail Store Business Global Athleisure Market Statistics Fashion Business Plan Graphics Pdf
This slide highlights the thorough assessment of a market within the athleisure market. It will help in getting valuable insights and project the success that the company expects while introducing its brand and its products to consumers within the market. Presenting this PowerPoint presentation, titled Retail Store Business Global Athleisure Market Statistics Fashion Business Plan Graphics Pdf, with topics curated by our researchers after extensive research. This editable presentation is available for immediate download and provides attractive features when used. Download now and captivate your audience. Presenting this Retail Store Business Global Athleisure Market Statistics Fashion Business Plan Graphics Pdf. Our researchers have carefully researched and created these slides with all aspects taken into consideration. This is a completely customizable Retail Store Business Global Athleisure Market Statistics Fashion Business Plan Graphics Pdf that is available for immediate downloading. Download now and make an impact on your audience. Highlight the attractive features available with our PPTs.
-
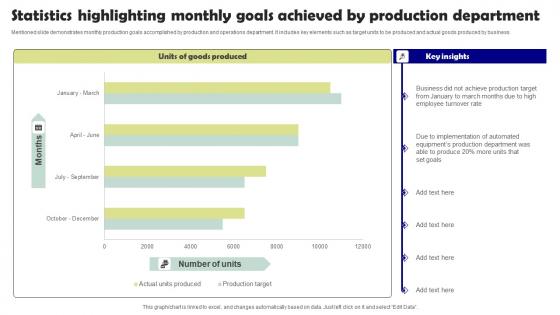
Statistics Highlighting Monthly Goals Achieved By Production Department Graphics Pdf
Mentioned slide demonstrates monthly production goals accomplished by production and operations department. It includes key elements such as target units to be produced and actual goods produced by business. Showcasing this set of slides titled Statistics Highlighting Monthly Goals Achieved By Production Department Graphics Pdf. The topics addressed in these templates are Goods Produced. All the content presented in this PPT design is completely editable. Download it and make adjustments in color, background, font etc. as per your unique business setting.
-
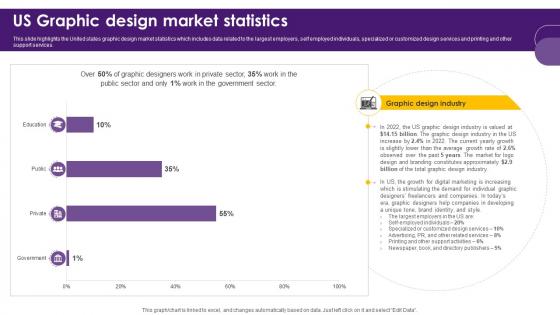
Creative Agency Business Plan Us Graphic Design Market Statistics BP SS V
This slide highlights the United states graphic design market statistics which includes data related to the largest employers, self employed individuals, specialized or customized design services and printing and other support services. Slidegeeks is one of the best resources for PowerPoint templates. You can download easily and regulate Creative Agency Business Plan Us Graphic Design Market Statistics BP SS V for your personal presentations from our wonderful collection. A few clicks is all it takes to discover and get the most relevant and appropriate templates. Use our Templates to add a unique zing and appeal to your presentation and meetings. All the slides are easy to edit and you can use them even for advertisement purposes.


