Sales graph PowerPoint Presentation Templates and Google Slides
-
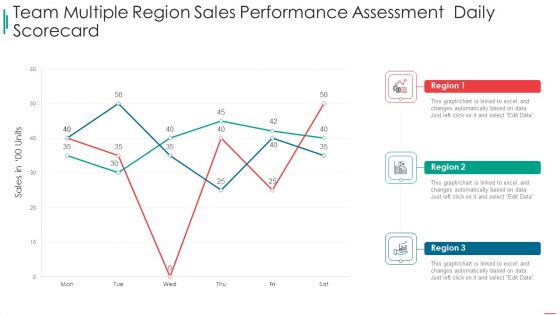
Sales Rep Scorecard Team Multiple Region Sales Performance Assessment Daily Scorecard Graphics PDF
Deliver an awe inspiring pitch with this creative sales rep scorecard team multiple region sales performance assessment daily scorecard graphics pdf bundle. Topics like team multiple region sales performance assessment daily scorecard can be discussed with this completely editable template. It is available for immediate download depending on the needs and requirements of the user.
-
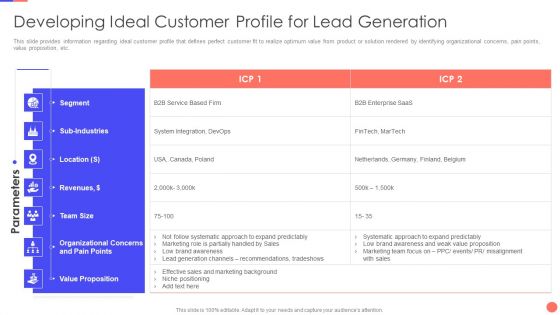
Sales Techniques Playbook Developing Ideal Customer Profile For Lead Generation Graphics PDF
This slide provides information regarding ideal customer profile that defines perfect customer fit to realize optimum value from product or solution rendered by identifying organizational concerns, pain points, value proposition, etc. Deliver an awe inspiring pitch with this creative sales techniques playbook developing ideal customer profile for lead generation graphics pdf bundle. Topics like team, revenues, location, organizational, value proposition can be discussed with this completely editable template. It is available for immediate download depending on the needs and requirements of the user.
-
Sales Techniques Playbook Sales Lead Follow Up Planner Graphics PDF
This slide provides information regarding sales lead follow up planner to aid salespeople in maximizing output from leads and tracking follow up schedule. This is a sales techniques playbook sales lead follow up planner graphics pdf template with various stages. Focus and dispense information on one stages using this creative set, that comes with editable features. It contains large content boxes to add your information on topics like sales, interested in product, outcome. You can also showcase facts, figures, and other relevant content using this PPT layout. Grab it now.
-
Business Traction For Point Of Sale Application Startup Fundraising Graphics PDF
Mentioned slide illustrates statistical information about business traction. Statistics covered are related to merchants, transactions and registered users.Deliver an awe inspiring pitch with this creative Business Traction For Point Of Sale Application Startup Fundraising Graphics PDF bundle. Topics like Merchants, Transactions, Projections can be discussed with this completely editable template. It is available for immediate download depending on the needs and requirements of the user.
-
Types Of Business Process Outsourcing Services For Sales Business Process Excellence Graphics PDF
Persuade your audience using this types of business process outsourcing services for sales business process excellence graphics pdf. This PPT design covers five stages, thus making it a great tool to use. It also caters to a variety of topics including customer support, marketing, human resource. Download this PPT design now to present a convincing pitch that not only emphasizes the topic but also showcases your presentation skills.
-
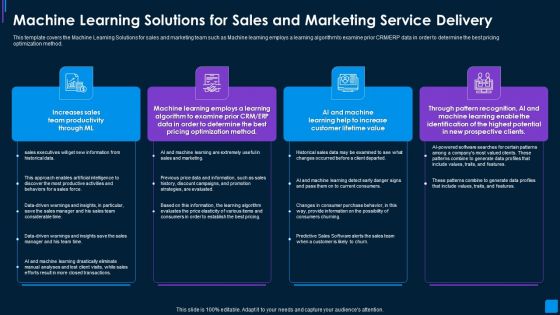
Advance IT Service Machine Learning Solutions For Sales And Marketing Graphics PDF
This template covers the Machine Learning Solutions for sales and marketing team such as Machine learning employs a learning algorithm to examine prior CRM or ERP data in order to determine the best pricing optimization method. Presenting advance it service machine learning solutions for sales and marketing graphics pdf to provide visual cues and insights. Share and navigate important information on four stages that need your due attention. This template can be used to pitch topics like auto case creation email, auto determination hr service, displaying related knowledge, hr cases. In addtion, this PPT design contains high resolution images, graphics, etc, that are easily editable and available for immediate download.
-
Sales Techniques Playbook Different Products Price Comparison Chart Graphics PDF
This slide provides information regarding product price comparison chart that captures information about price per unit, change over list price, reason for proposed price, volumes sold, forecasted growth. This is a sales techniques playbook different products price comparison chart graphics pdf template with various stages. Focus and dispense information on one stage using this creative set, that comes with editable features. It contains large content boxes to add your information on topics like ensuring effective communication among sales management team You can also showcase facts, figures, and other relevant content using this PPT layout. Grab it now.
-
Sales Techniques Playbook Role Of Sales Content In Managing Selling Systems Graphics PDF
This slide provides information regarding role of sales content in managing selling systems such as managing multi channel selling initiatives, sales enablement tools, marketing automation programs, solution selling platform. Deliver and pitch your topic in the best possible manner with this sales techniques playbook role of sales content in managing selling systems graphics pdf Use them to share invaluable insights on channel selling initiatives, sales enablement tools, marketing automation programs and impress your audience. This template can be altered and modified as per your expectations. So, grab it now.
-
Targeting Customer To Increase Company Sales Icon Graphics PDF
Showcasing this set of slides titled targeting customer to increase company sales icon graphics pdf. The topics addressed in these templates are targeting customer to increase company sales icon. All the content presented in this PPT design is completely editable. Download it and make adjustments in color, background, font etc. as per your unique business setting.
-
Assessment Worksheet For Sales Team Accomplishment Evaluation Graphics PDF
This slide showcases assessment worksheet for team performance management. It provides information about competencies, team members rating, demonstrated level, technical leadership, performance, etc.Pitch your topic with ease and precision using this assessment worksheet for sales team accomplishment evaluation graphics pdf This layout presents information on technical leadership, technical performance, impact and continuity It is also available for immediate download and adjustment. So, changes can be made in the color, design, graphics or any other component to create a unique layout.
-
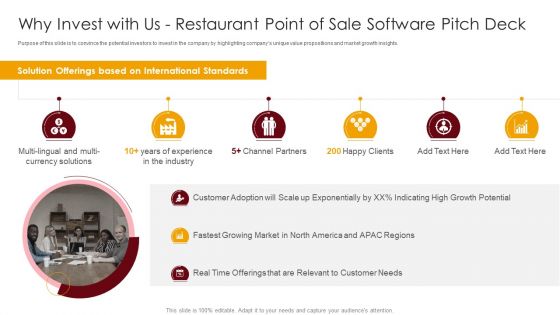
Why Invest With Us Restaurant Point Of Sale Software Pitch Deck Ppt Model Graphics Pictures PDF
Purpose of this slide is to convince the potential investors to invest in the company by highlighting companys unique value propositions and market growth insights. This is a Why Invest With Us Restaurant Point Of Sale Software Pitch Deck Ppt Model Graphics Pictures PDF template with various stages. Focus and dispense information on six stages using this creative set, that comes with editable features. It contains large content boxes to add your information on topics like Customer Adoption, Growth Potential, Customer Needs. You can also showcase facts, figures, and other relevant content using this PPT layout. Grab it now.
-
Effective Sales Technique For New Product Launch KPI Dashboard To Monitor Sales Performance Graphics PDF
This slide shows sales performance monitoring dashboard. Metrics included in the dashboard are sales revenue, sales growth, average revenue per unit, customer lifetime value and customer acquisition cost.Deliver an awe inspiring pitch with this creative Effective Sales Technique For New Product Launch KPI Dashboard To Monitor Sales Performance Graphics PDF bundle. Topics like Country Performance, Average Revenue, Customer Acquisition can be discussed with this completely editable template. It is available for immediate download depending on the needs and requirements of the user.
-
New Product Sales Strategy And Marketing Annual Sales Highlights Of Us Region Graphics PDF
Mentioned slide displays annual sales performance highlight of the firm in US region. It also portrays sales performance stats of that firm in FY2020 recorded low sales in South and Northeast America. Deliver and pitch your topic in the best possible manner with this New Product Sales Strategy And Marketing Annual Sales Highlights Of Us Region Graphics PDF. Use them to share invaluable insights on Sales Performance, Quarterly Sales, Annual Sales and impress your audience. This template can be altered and modified as per your expectations. So, grab it now.
-
Comparative Monthly Sales Report By Region Graphics PDF
The following slide highlights the comparative monthly sales by region illustrating key headings which includes monthly sales by region, monthly sales by quantity, product sales distribution and monthly sales revenue by product. Showcasing this set of slides titled Comparative Monthly Sales Report By Region Graphics PDF. The topics addressed in these templates are Sales Revenue, Monthly Sales Quantity, Product Sales Distribution. All the content presented in this PPT design is completely editable. Download it and make adjustments in color, background, font etc. as per your unique business setting.
-
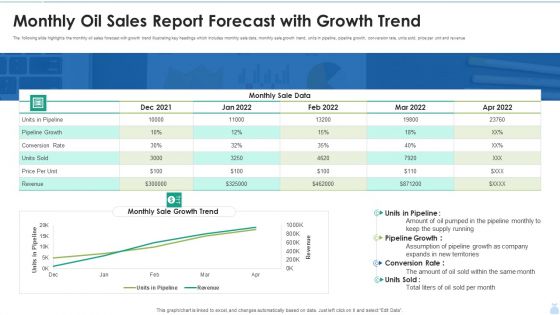
Monthly Oil Sales Report Forecast With Growth Trend Graphics PDF
The following slide highlights the monthly oil sales forecast with growth trend illustrating key headings which includes monthly sale data, monthly sale growth trend, units in pipeline, pipeline growth, conversion rate, units sold, price per unit and revenue. Showcasing this set of slides titled Monthly Oil Sales Report Forecast With Growth Trend Graphics PDF. The topics addressed in these templates are Pipeline Growth, Monthly Sale Data, Conversion Rate. All the content presented in this PPT design is completely editable. Download it and make adjustments in color, background, font etc. as per your unique business setting.
-
Monthly Sales Report Performance Scorecard Icon Graphics PDF
Presenting Monthly Sales Report Performance Scorecard Icon Graphics PDFC to provide visual cues and insights. Share and navigate important information on four stages that need your due attention. This template can be used to pitch topics like Scorecard Icon, Monthly Sales, Report Performance. In addtion, this PPT design contains high resolution images, graphics, etc, that are easily editable and available for immediate download.
-
Monthly Sales Volume Report With Graph Demonstration PDF
The following slide highlights the monthly sales volume report with graph illustrating key headings which includes sales report, current month sales volume and current month volume vs last month volume. Showcasing this set of slides titled Monthly Sales Volume Report With Graph Demonstration PDF. The topics addressed in these templates are Monthly Sales, Volume Report, Graph. All the content presented in this PPT design is completely editable. Download it and make adjustments in color, background, font etc. as per your unique business setting.
-
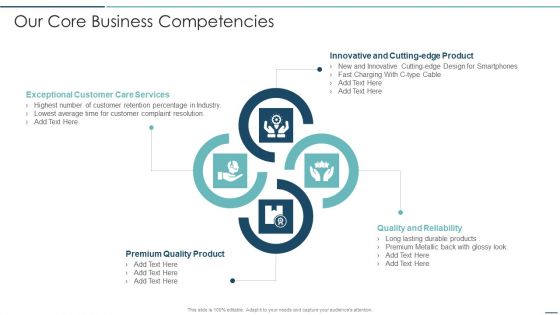
Playbook For Sales Development Executives Our Core Business Competencies Graphics PDF
Deliver an awe inspiring pitch with this creative Playbook For Sales Development Executives Our Core Business Competencies Graphics PDF bundle. Topics like Exceptional Customer, Premium Quality, Quality Reliability can be discussed with this completely editable template. It is available for immediate download depending on the needs and requirements of the user.
-
Icons Slide For B2B Sales Framework Playbook Graphics PDF
Presenting our innovatively structured Icons Slide For B2B Sales Framework Playbook Graphics PDF set of slides. The slides contain a hundred percent editable icons. You can replace these icons without any inconvenience. Therefore, pick this set of slides and create a striking presentation.
-
Playbook For Sales Development Executives Career Matrix For Employees In The Organization Graphics PDF
The following slide displays the career matrix for employees in the organization. It can be utilized by managers to show the career progression of the representatives and provide them an overview of the hierarchy.This is a Playbook For Sales Development Executives Career Matrix For Employees In The Organization Graphics PDF template with various stages. Focus and dispense information on four stages using this creative set, that comes with editable features. It contains large content boxes to add your information on topics like Sales Development, Representative Executive, Representative Team You can also showcase facts, figures, and other relevant content using this PPT layout. Grab it now.
-
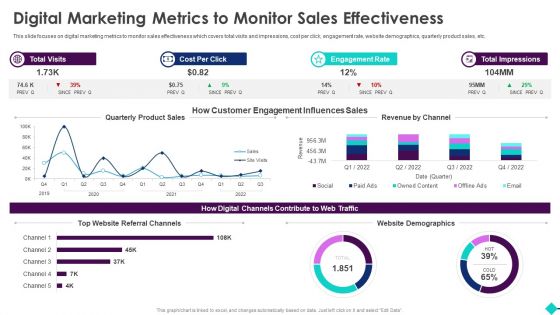
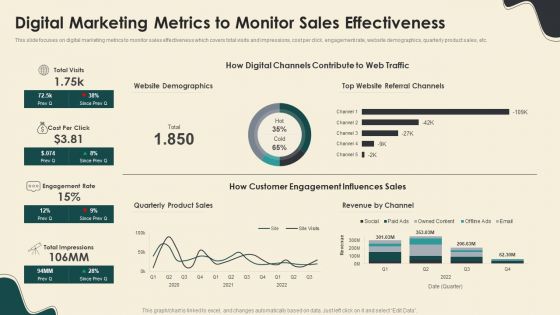
Sales Process Automation For Revenue Growth Digital Marketing Metrics To Monitor Sales Effectiveness Graphics PDF
This slide focuses on digital marketing metrics to monitor sales effectiveness which covers total visits and impressions, cost per click, engagement rate, website demographics, quarterly product sales, etc.Deliver and pitch your topic in the best possible manner with this Sales Process Automation For Revenue Growth Digital Marketing Metrics To Monitor Sales Effectiveness Graphics PDF. Use them to share invaluable insights on Automation Potential, Role Of Automation, Included Activities and impress your audience. This template can be altered and modified as per your expectations. So, grab it now.
-
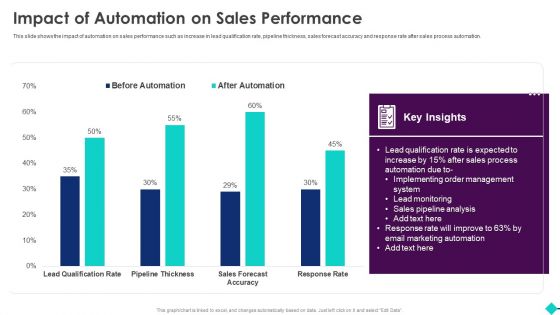
Sales Process Automation For Revenue Growth Impact Of Automation On Sales Performance Graphics PDF
This slide shows the impact of automation on sales performance such as increase in lead qualification rate, pipeline thickness, sales forecast accuracy and response rate after sales process automation.Deliver an awe inspiring pitch with this creative Sales Process Automation For Revenue Growth Impact Of Automation On Sales Performance Graphics PDF bundle. Topics like Lead Qualification, Order Management, Marketing Automation can be discussed with this completely editable template. It is available for immediate download depending on the needs and requirements of the user.
-
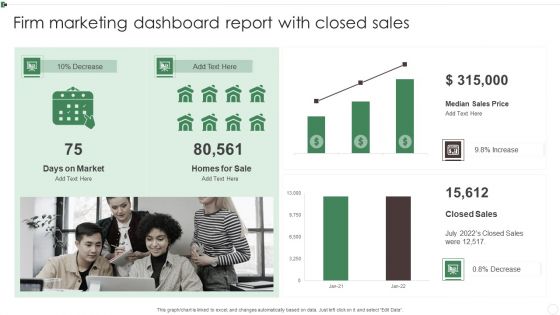
Firm Marketing Dashboard Report With Closed Sales Ppt Slides Graphics Example PDF
This graph or chart is linked to excel, and changes automatically based on data. Just left click on it and select Edit Data. Showcasing this set of slides titled Firm Marketing Dashboard Report With Closed Sales Ppt Slides Graphics Example PDF. The topics addressed in these templates are Days On Market, Homes For Sale, Median Sales Price, Closed Sales. All the content presented in this PPT design is completely editable. Download it and make adjustments in color, background, font etc. as per your unique business setting.
-
Sales Pipeline Management Dashboard With Top Ten Customers Graphics PDF
This slide shows the process steps followed by the company for the recruitment of new employees. It stars from Identifying the hiring needs and ends with employment offer. Deliver and pitch your topic in the best possible manner with this Sales Pipeline Management Dashboard With Top Ten Customers Graphics PDF. Use them to share invaluable insights on Open Opportunities, Pipeline Value, Customers Revenue and impress your audience. This template can be altered and modified as per your expectations. So, grab it now.
-
Digital Marketing Metrics To Monitor Sales Effectiveness Graphics PDF
This slide focuses on digital marketing metrics to monitor sales effectiveness which covers total visits and impressions, cost per click, engagement rate, website demographics, quarterly product sales, etc. Deliver an awe inspiring pitch with this creative Digital Marketing Metrics To Monitor Sales Effectiveness Graphics PDF bundle. Topics like Website Demographics, Quarterly Product Sales, Revenue By Channel can be discussed with this completely editable template. It is available for immediate download depending on the needs and requirements of the user.
-
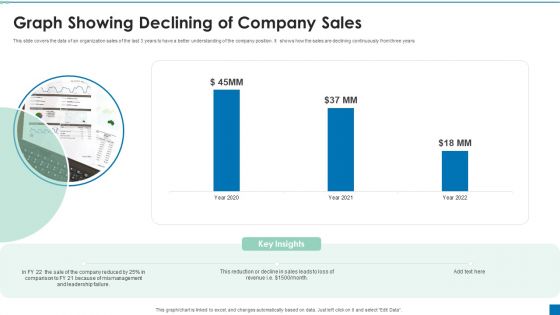
Graph Showing Declining Of Company Sales Ppt PowerPoint Presentation Portfolio Graphics Example PDF
This slide covers the data of an organization sales of the last 3 years to have a better understanding of the company position. It shows how the sales are declining continuously from three years.Pitch your topic with ease and precision using this Graph Showing Declining Of Company Sales Ppt PowerPoint Presentation Portfolio Graphics Example PDF. This layout presents information on Reduction Decline, Comparison, Mismanagement. It is also available for immediate download and adjustment. So, changes can be made in the color, design, graphics or any other component to create a unique layout.
-
Effective Sales Promotion Strategies Implementation Challenges Ppt PowerPoint Presentation Ideas Graphics Tutorials PDF
The following slide highlights the key challenges in implementing effective sales promotion strategies to evaluate and formulate strategies. It includes product innovation, tough competition, financing issues, technology adoption etc. Pitch your topic with ease and precision using this Effective Sales Promotion Strategies Implementation Challenges Ppt PowerPoint Presentation Ideas Graphics Tutorials PDF. This layout presents information on Biggest Challenge, Product Innovation, Challenge Maintaining. It is also available for immediate download and adjustment. So, changes can be made in the color, design, graphics or any other component to create a unique layout.
-
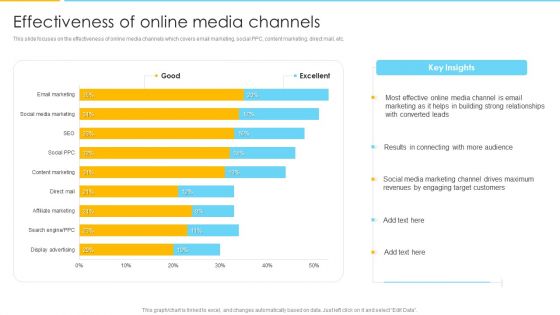
Optimizing Ecommerce Marketing Plan To Improve Sales Effectiveness Of Online Media Channels Graphics PDF
This slide focuses on the effectiveness of online media channels which covers email marketing, social PPC, content marketing, direct mail, etc. Deliver an awe inspiring pitch with this creative Optimizing Ecommerce Marketing Plan To Improve Sales Effectiveness Of Online Media Channels Graphics PDF bundle. Topics like Email Marketing, Social Media Marketing, Target Customers can be discussed with this completely editable template. It is available for immediate download depending on the needs and requirements of the user.
-
Trend Chart Depicting Diminishing Graph And Chart Sales And Production Structure PDF
Pitch your topic with ease and precision using this Trend Chart Depicting Diminishing Graph And Chart Sales And Production Structure PDF. This layout presents information on Trend Chart Depicting, Diminishing Graph, Chart Sales And Production. It is also available for immediate download and adjustment. So, changes can be made in the color, design, graphics or any other component to create a unique layout.
-
Graphical Representation Of Firm Business Sales Highlights Pictures PDF
Showcasing this set of slides titled Graphical Representation Of Firm Business Sales Highlights Pictures PDF. The topics addressed in these templates are Average Revenue Per Unit, Customer Acquisition Cost, Sale Revenue. All the content presented in this PPT design is completely editable. Download it and make adjustments in color, background, font etc. as per your unique business setting.
-
Salesforce Scorecard With Sales Activity Metric Ppt PowerPoint Presentation Professional Graphics Tutorials PDF
Deliver an awe inspiring pitch with this creative Salesforce Scorecard With Sales Activity Metric Ppt PowerPoint Presentation Professional Graphics Tutorials PDF bundle. Topics like Opportunity Owner, Neglected Accounts, Sales Pipeline can be discussed with this completely editable template. It is available for immediate download depending on the needs and requirements of the user.
-
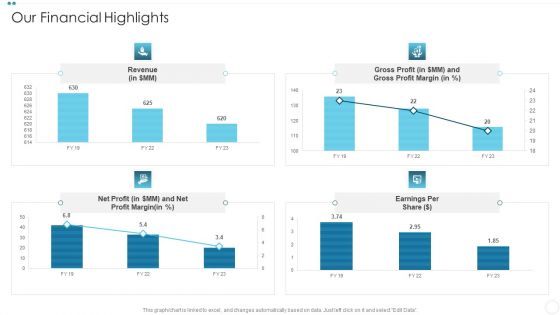
Company Sales Lead Qualification Procedure To Enhance Revenue Our Financial Highlights Graphics PDF
Deliver and pitch your topic in the best possible manner with this Company Sales Lead Qualification Procedure To Enhance Revenue Our Financial Highlights Graphics PDF Use them to share invaluable insights on Gross Profit, Profit Margin, Revenue and impress your audience. This template can be altered and modified as per your expectations. So, grab it now.
-
Company Sales Lead Qualification Procedure To Enhance Revenue Utilizing The GPCTBAC Model Graphics PDF
Purpose of the following slide is to display the utilization of the GPCTBAC model as it displays the key qualification criteria of the customer, these criterias are customers goal, plan, challenges, timeline, budget, authority, negative consequences etc. Deliver an awe inspiring pitch with this creative Company Sales Lead Qualification Procedure To Enhance Revenue Utilizing The GPCTBAC Model Graphics PDF bundle. Topics like Negative Consequences, Potential Implementation, Qualification can be discussed with this completely editable template. It is available for immediate download depending on the needs and requirements of the user.
-
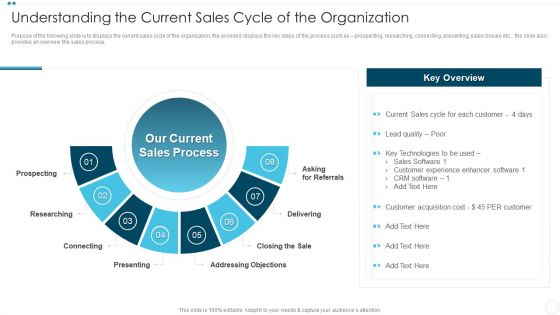
Understanding The Current Sales Cycle Of The Organization Graphics PDF
Purpose of the following slide is to displays the current sales cycle of the organization, the provided displays the key steps of the process such as prospecting, researching, connecting, presenting, sales closure etc.the slide also provides an overview the sales process. Presenting Understanding The Current Sales Cycle Of The Organization Graphics PDF to provide visual cues and insights. Share and navigate important information on eight stages that need your due attention. This template can be used to pitch topics like Prospecting, Asking Referrals, Addressing Objections In addtion, this PPT design contains high resolution images, graphics, etc, that are easily editable and available for immediate download.
-
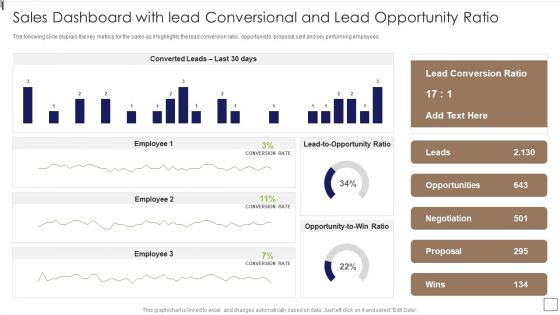
Sales Lead Qualification Procedure And Parameter Sales Dashboard With Lead Conversional Graphics PDF
The following slide displays the key metrics for the sales as it highlights the lead conversion ratio , opportunists, proposal sent and key performing employees.Deliver an awe inspiring pitch with this creative Sales Lead Qualification Procedure And Parameter Sales Dashboard With Lead Conversional Graphics PDF bundle. Topics like Lead Conversion, Opportunities, Negotiation can be discussed with this completely editable template. It is available for immediate download depending on the needs and requirements of the user.
-
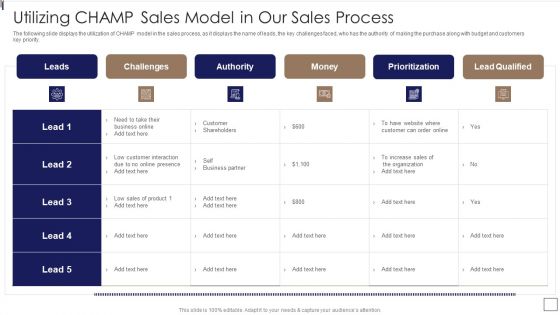
Sales Lead Qualification Procedure And Parameter Utilizing CHAMP Sales Model In Our Sales Process Graphics PDF
The following slide displays the utilization of CHAMP model in the sales process, as it displays the name of leads, the key challenges faced, who has the authority of making the purchase along with budget and customers key priority.Deliver and pitch your topic in the best possible manner with this Sales Lead Qualification Procedure And Parameter Utilizing CHAMP Sales Model In Our Sales Process Graphics PDF Use them to share invaluable insights on Prioritization, Lead Qualified, Challenges and impress your audience. This template can be altered and modified as per your expectations. So, grab it now.
-
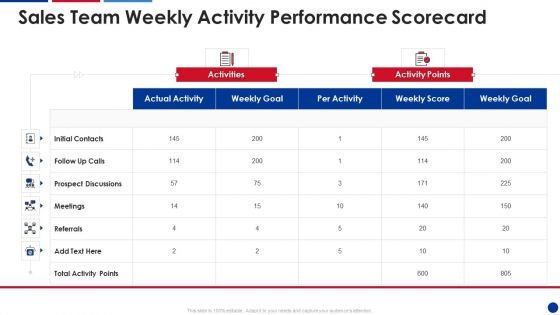
Sales Team Weekly Activity Performance Scorecard Graphics PDF
Deliver an awe inspiring pitch with this creative Sales Team Weekly Activity Performance Scorecard Graphics PDF bundle. Topics like Actual Activity, Initial Contacts, Prospect Discussions can be discussed with this completely editable template. It is available for immediate download depending on the needs and requirements of the user.
-
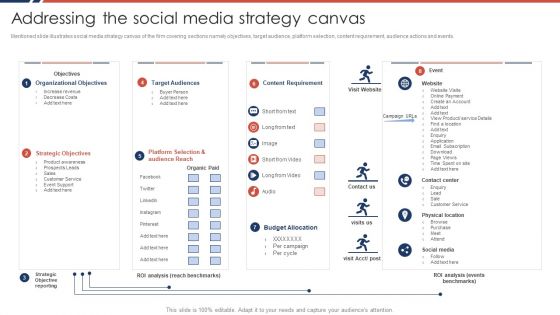
Effective Sales Plan For New Product Introduction In Market Addressing The Social Graphics PDF
Mentioned slide illustrates social media strategy canvas of the firm covering sections namely objectives, target audience, platform selection, content requirement, audience actions and events.Deliver an awe inspiring pitch with this creative Effective Sales Plan For New Product Introduction In Market Addressing The Social Graphics PDF bundle. Topics like Organizational Objectives, Strategic Objectives, Content Requirement can be discussed with this completely editable template. It is available for immediate download depending on the needs and requirements of the user.
-
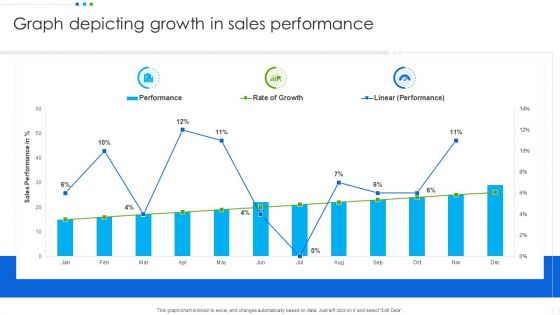
Graph Depicting Growth In Sales Performance Professional PDF
Pitch your topic with ease and precision using this Graph Depicting Growth In Sales Performance Professional PDF. This layout presents information on Graph Depicting, Sales Performance. It is also available for immediate download and adjustment. So, changes can be made in the color, design, graphics or any other component to create a unique layout.
-
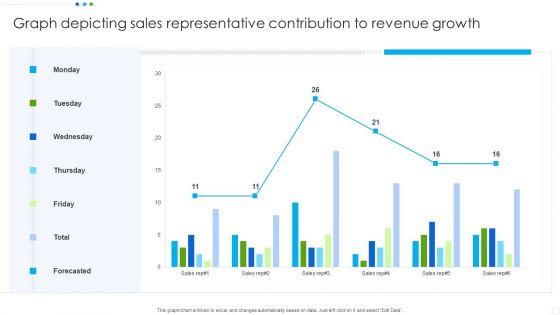
Graph Depicting Sales Representative Contribution To Revenue Growth Graphics PDF
Showcasing this set of slides titled Graph Depicting Sales Representative Contribution To Revenue Growth Graphics PDF. The topics addressed in these templates are Graph Depicting Sales, Revenue Growth. All the content presented in this PPT design is completely editable. Download it and make adjustments in color, background, font etc. as per your unique business setting.
-
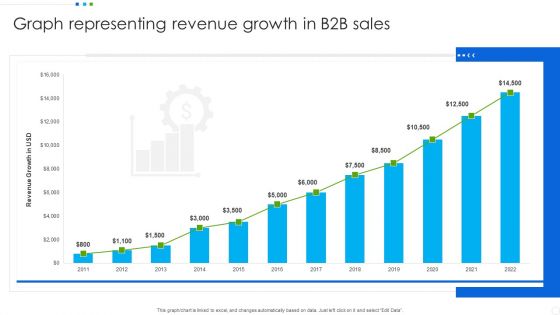
Graph Representing Revenue Growth In B2b Sales Background PDF
Pitch your topic with ease and precision using this Graph Representing Revenue Growth In B2b Sales Background PDF. This layout presents information on Graph Representing, Revenue Growth, Sales. It is also available for immediate download and adjustment. So, changes can be made in the color, design, graphics or any other component to create a unique layout.
-
Sales Growth Graph Showing Annual Product Performance Slides PDF
Pitch your topic with ease and precision using this Sales Growth Graph Showing Annual Product Performance Slides PDF. This layout presents information on Sales Growth, Product Performance. It is also available for immediate download and adjustment. So, changes can be made in the color, design, graphics or any other component to create a unique layout.
-
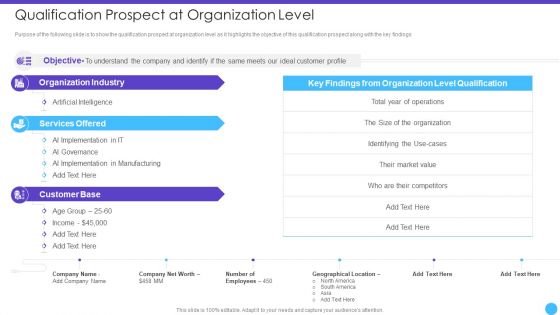
Sales Lead Qualification Rating Framework Qualification Prospect At Organization Level Graphics PDF
Purpose of the following slide is to show the qualification prospect at organization level as it highlights the objective of this qualification prospect along with the key findings.Deliver and pitch your topic in the best possible manner with this Sales Lead Qualification Rating Framework Qualification Prospect At Organization Level Graphics PDF Use them to share invaluable insights on Organization Industry, Services Offered, Customer Base and impress your audience. This template can be altered and modified as per your expectations. So, grab it now.
-
Sales Lead Qualification Rating Framework Utilizing CHAMP Sales Model In Our Sales Process Graphics PDF
The following slide displays the utilization of CHAMP model in the sales process, as it displays the name of leads, the key challenges faced, who has the authority of making the purchase along with budget and customers key priority.Deliver an awe inspiring pitch with this creative Sales Lead Qualification Rating Framework Utilizing CHAMP Sales Model In Our Sales Process Graphics PDF bundle. Topics like Customer Interaction, Prioritization, Lead Qualified can be discussed with this completely editable template. It is available for immediate download depending on the needs and requirements of the user.
-
Sales Departmental Goals Achievement Graph Ppt Inspiration Slide Download PDF
This slide illustrates graphical representation of achievement percentage of each team member. It includes achievement percent, name, due date and target of respective member. Pitch your topic with ease and precision using this Sales Departmental Goals Achievement Graph Ppt Inspiration Slide Download PDF. This layout presents information on Sales Departmental, Goals, Achievement Graph. It is also available for immediate download and adjustment. So, changes can be made in the color, design, graphics or any other component to create a unique layout.
-
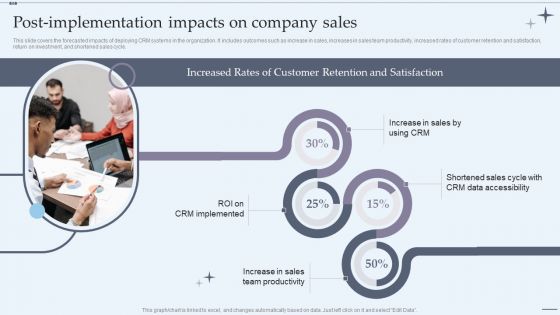
CRM System Implementation Stages Postimplementation Impacts On Company Sales Graphics PDF
This slide covers the forecasted impacts of deploying CRM systems in the organization. It includes outcomes such as increase in sales, increases in sales team productivity, increased rates of customer retention and satisfaction, return on investment, and shortened sales cycle. Deliver an awe inspiring pitch with this creative CRM System Implementation Stages Postimplementation Impacts On Company Sales Graphics PDF bundle. Topics like Data Accessibility, Team Productivity, Increase In Sales can be discussed with this completely editable template. It is available for immediate download depending on the needs and requirements of the user.
-
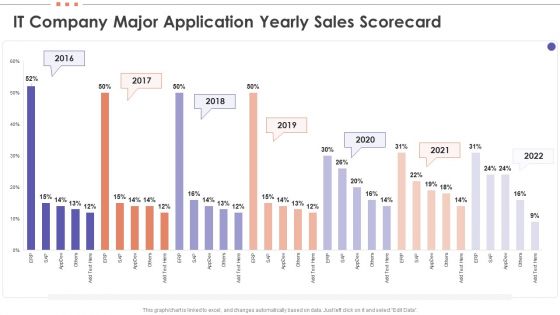
IT Company Major Application Yearly Sales Scorecard Graphics PDF
Deliver and pitch your topic in the best possible manner with this IT Company Major Application Yearly Sales Scorecard Graphics PDF. Use them to share invaluable insights on IT Company, Major Application, Yearly Sales Scorecard and impress your audience. This template can be altered and modified as per your expectations. So, grab it now.
-
Formulating Video Marketing Strategies To Enhance Sales Deciding The Platforms For Video Marketing Graphics PDF
The following slide outlines various social media platforms which the company will use for video marketing. The major social media platforms highlighted in the slide are YouTube, facebook, instagram, twitter and snapchat. Crafting an eye catching presentation has never been more straightforward. Let your presentation shine with this tasteful yet straightforward Formulating Video Marketing Strategies To Enhance Sales Deciding The Platforms For Video Marketing Graphics PDF template. It offers a minimalistic and classy look that is great for making a statement. The colors have been employed intelligently to add a bit of playfulness while still remaining professional. Construct the ideal Formulating Video Marketing Strategies To Enhance Sales Deciding The Platforms For Video Marketing Graphics PDF that effortlessly grabs the attention of your audience Begin now and be certain to wow your customers.
-
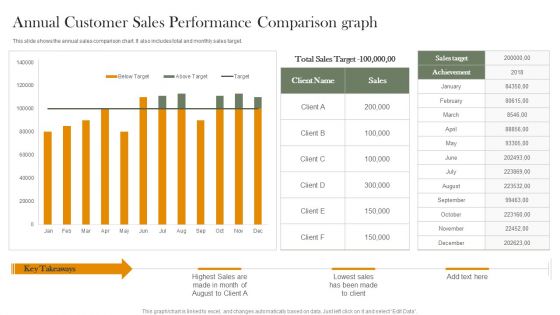
Annual Customer Sales Performance Comparison Graph Portrait PDF
This slide shows the annual sales comparison chart. It also includes total and monthly sales target. Pitch your topic with ease and precision using this Annual Customer Sales Performance Comparison Graph Portrait PDF. This layout presents information on Total Sales Target, Sales Target, Achievement. It is also available for immediate download and adjustment. So, changes can be made in the color, design, graphics or any other component to create a unique layout.
-
Sales Performance Comparison Graph Of Top Customer Icons PDF
This slide shows the customer sales comparison graph along with the units of product purchased by the clients. Showcasing this set of slides titled Sales Performance Comparison Graph Of Top Customer Icons PDF. The topics addressed in these templates are Highest Units, Customer, Product. All the content presented in this PPT design is completely editable. Download it and make adjustments in color, background, font etc. as per your unique business setting.
-
State Wise Customer Sales Performance Comparison Graph Introduction PDF
This slide shows the sales graph of 3 products of a company in various states. It includes five states which are New York, Texas, California, Washington and New Jersey. Showcasing this set of slides titled State Wise Customer Sales Performance Comparison Graph Introduction PDF. The topics addressed in these templates are Lowest Sales, Decrease Demand. All the content presented in this PPT design is completely editable. Download it and make adjustments in color, background, font etc. as per your unique business setting.
-
Brand Extension Positioning Example Projected Sales Revenue Graphics PDF
This slide displays informational statistics about the firms expected sales revenue based on its brand extension strategy. It also implies that sales revenue will rise month after month.Explore a selection of the finest Brand Extension Positioning Example Projected Sales Revenue Graphics PDF here. With a plethora of professionally designed and pre-made slide templates, you can quickly and easily find the right one for your upcoming presentation. You can use our Brand Extension Positioning Example Projected Sales Revenue Graphics PDF to effectively convey your message to a wider audience. Slidegeeks has done a lot of research before preparing these presentation templates. The content can be personalized and the slides are highly editable. Grab templates today from Slidegeeks.
-
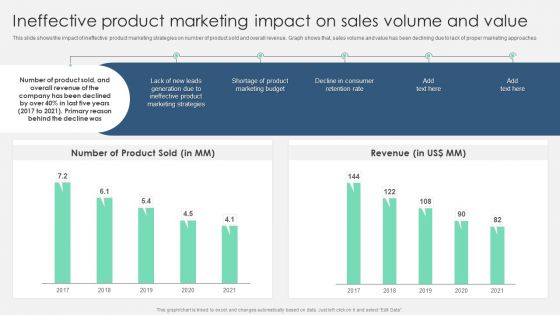
Ineffective Product Marketing Impact On Sales Volume And Value Graphics PDF
This slide shows the impact of ineffective product marketing strategies on number of product sold and overall revenue. Graph shows that, sales volume and value has been declining due to lack of proper marketing approaches. This Ineffective Product Marketing Impact On Sales Volume And Value Graphics PDF from Slidegeeks makes it easy to present information on your topic with precision. It provides customization options, so you can make changes to the colors, design, graphics, or any other component to create a unique layout. It is also available for immediate download, so you can begin using it right away. Slidegeeks has done good research to ensure that you have everything you need to make your presentation stand out. Make a name out there for a brilliant performance.
-
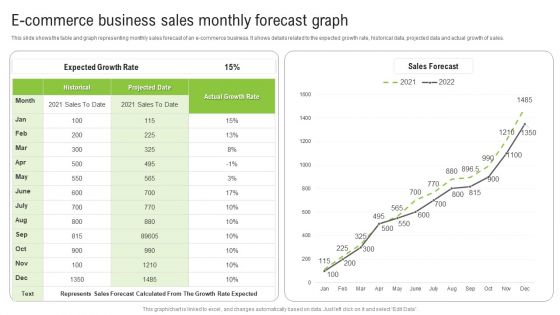
E Commerce Business Sales Monthly Forecast Graph Ppt Infographics Show PDF
This slide shows the table and graph representing monthly sales forecast of an e-commerce business. It shows details related to the expected growth rate, historical data, projected data and actual growth of sales. Pitch your topic with ease and precision using this E Commerce Business Sales Monthly Forecast Graph Ppt Infographics Show PDF. This layout presents information on Expected Growth Rate, Historical, Actual Growth Rate. It is also available for immediate download and adjustment. So, changes can be made in the color, design, graphics or any other component to create a unique layout.
-
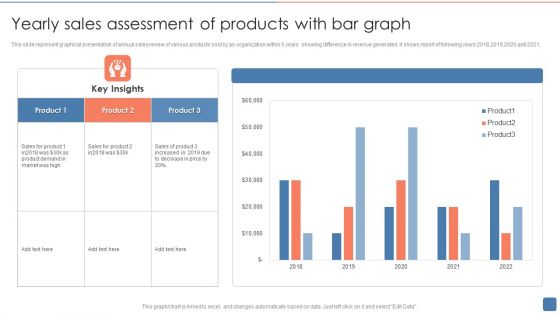
Yearly Sales Assessment Of Products With Bar Graph Structure PDF
This slide represent graphical presentation of annual sales review of various products sold by an organization within 5 years showing difference in revenue generated .It shows report of following years 2018,2019,2020,and 2021. Showcasing this set of slides titled Yearly Sales Assessment Of Products With Bar Graph Structure PDF. The topics addressed in these templates are Product, Sales Of Product, Product Demand. All the content presented in this PPT design is completely editable. Download it and make adjustments in color, background, font etc. as per your unique business setting.
-
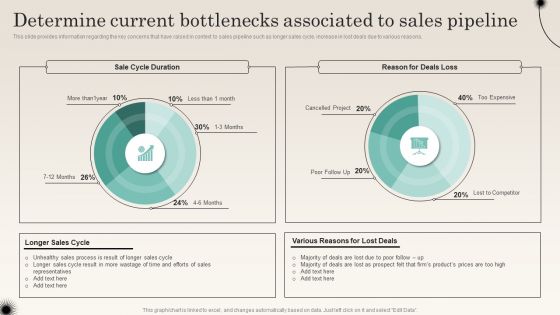
Determine Current Bottlenecks Associated To Sales Pipeline Improving Distribution Channel Graphics PDF
This slide provides information regarding the key concerns that have raised in context to sales pipeline such as longer sales cycle, increase in lost deals due to various reasons. Deliver and pitch your topic in the best possible manner with this Determine Current Bottlenecks Associated To Sales Pipeline Improving Distribution Channel Graphics PDF. Use them to share invaluable insights on Unhealthy Sales, Various Reasons, Lost Prospect and impress your audience. This template can be altered and modified as per your expectations. So, grab it now.
-
2018 To 2021 Sales Performance Clustered Bar Graph Graphics PDF
Showcasing this set of slides titled 2018 To 2021 Sales Performance Clustered Bar Graph Graphics PDF. The topics addressed in these templates are Range Of Profits, Increase In Production, Profits Are Stagnant. All the content presented in this PPT design is completely editable. Download it and make adjustments in color, background, font etc. as per your unique business setting.
-
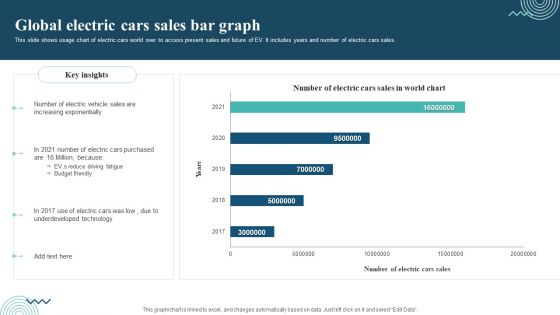
Global Electric Cars Sales Bar Graph Graphics PDF
This slide shows usage chart of electric cars world over to access present sales and future of EV. It includes years and number of electric cars sales. Showcasing this set of slides titled Global Electric Cars Sales Bar Graph Graphics PDF. The topics addressed in these templates are Electric Vehicle Sales, Electric Cars Purchased, Underdeveloped Technology. All the content presented in this PPT design is completely editable. Download it and make adjustments in color, background, font etc. as per your unique business setting.
-
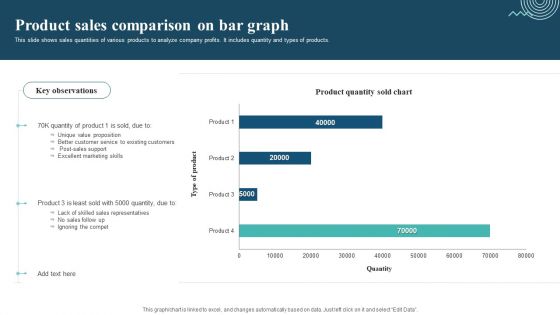
Product Sales Comparison On Bar Graph Sample PDF
This slide shows sales quantities of various products to analyze company profits. It includes quantity and types of products. Pitch your topic with ease and precision using this Product Sales Comparison On Bar Graph Sample PDF. This layout presents information on Unique Value Proposition, Excellent Marketing Skills, Ignoring The Compet. It is also available for immediate download and adjustment. So, changes can be made in the color, design, graphics or any other component to create a unique layout.
-
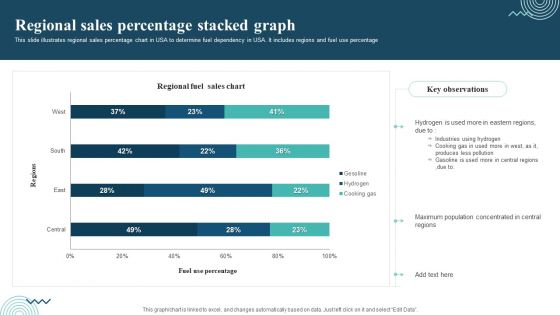
Regional Sales Percentage Stacked Graph Themes PDF
This slide illustrates regional sales percentage chart in USA to determine fuel dependency in USA. It includes regions and fuel use percentage. Pitch your topic with ease and precision using this Regional Sales Percentage Stacked Graph Themes PDF. This layout presents information on Regional Sales, Industries Using Hydrogen, Cooking Gas. It is also available for immediate download and adjustment. So, changes can be made in the color, design, graphics or any other component to create a unique layout.


