Sales data comparison PowerPoint Presentation Templates and Google Slides
-
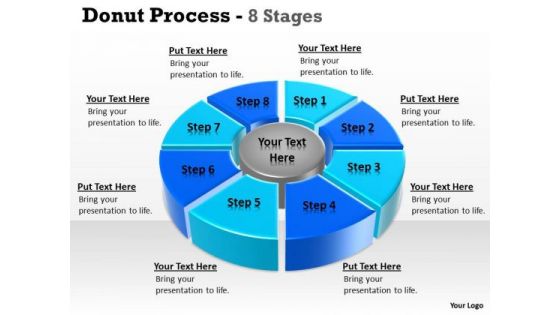
Strategic Management Donut Pie Chart For Data Comparisons 8 Stages Sales Diagram
Be The Doer With Our Strategic Management Donut Pie Chart For Data Comparisons 8 Stages Sales Diagram Powerpoint Templates. Put Your Thoughts Into Practice.
-
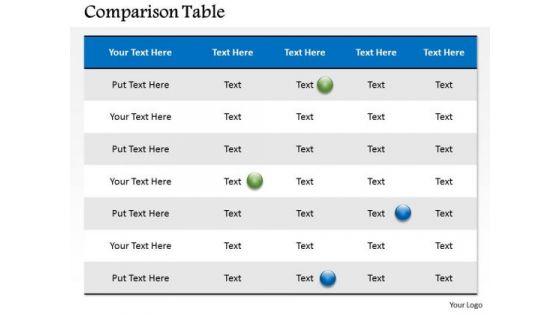
Marketing Diagram Comparison Table For Business Data Sales Diagram
Establish Your Dominion With Our Marketing Diagram Comparison Table For Business Data Sales Diagram Powerpoint Templates. Rule The Stage With Your Thoughts.
-
Business Sales Comparison With Actual And Predictive Data Ppt Model Slide PDF
The following slide highlights the annual sales forecast report for business illustrating key headings which includes product, last year, forecast, actual, number of customers, average sales per customer and net sales. Showcasing this set of slides titled business sales comparison with actual and predictive data ppt model slide pdf. The topics addressed in these templates are antivirus protection, cloud solutions, system controls. All the content presented in this PPT design is completely editable. Download it and make adjustments in color, background, font etc. as per your unique business setting.
-
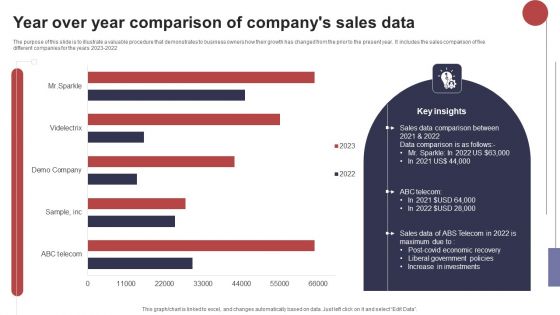
Year Over Year Comparison Of Companys Sales Data Microsoft PDF
The purpose of this slide is to illustrate a valuable procedure that demonstrates to business owners how their growth has changed from the prior to the present year. It includes the sales comparison of five different companies for the years 2023 2022. Pitch your topic with ease and precision using this Year Over Year Comparison Of Companys Sales Data Microsoft PDF. This layout presents information on Sales Data Comparison, Liberal Government, Increase Investments. It is also available for immediate download and adjustment. So, changes can be made in the color, design, graphics or any other component to create a unique layout.


