Revenue per PowerPoint Presentation Templates and Google Slides
-
Company Performance Dashboard With Weekly Sales Revenue Structure PDF
This slide showcases the dashboard of financial organizational performance. It include average revenue per unit, customer lifetime value etc. Showcasing this set of slides titled company performance dashboard with weekly sales revenue structure pdf. The topics addressed in these templates are company performance dashboard with weekly sales revenue. All the content presented in this PPT design is completely editable. Download it and make adjustments in color, background, font etc. as per your unique business setting.
-
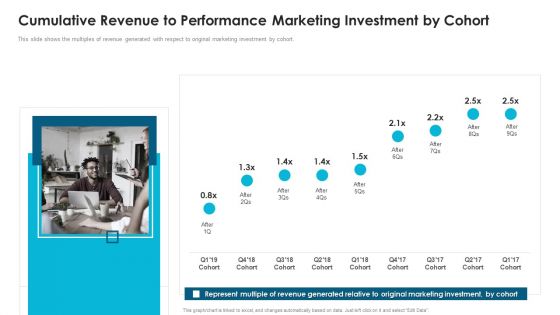
Fiverr Capital Fundraising Cumulative Revenue To Performance Marketing Investment Ppt Infographics Grid PDF
This slide shows the multiples of revenue generated with respect to original marketing investment by cohort. This is a Fiverr Capital Fundraising Cumulative Revenue To Performance Marketing Investment Ppt Infographics Grid PDF template with various stages. Focus and dispense information on one stages using this creative set, that comes with editable features. It contains large content boxes to add your information on topics like Represent Multiple Revenue, Generated Relative Original, Marketing Investment Cohort. You can also showcase facts, figures, and other relevant content using this PPT layout. Grab it now.
-
Revenue And Employee Key Performance Indicators Background PDF
The following slide highlights the revenue and staff key performance Indicators illustrating key headings which includes revenue centres, employee vs profitability, billable hours, average rate per hour and profitable employees Deliver an awe inspiring pitch with this creative Revenue And Employee Key Performance Indicators Background PDF bundle. Topics like Revenue Centres, Employee Profitability, Profitable Employee can be discussed with this completely editable template. It is available for immediate download depending on the needs and requirements of the user.
-
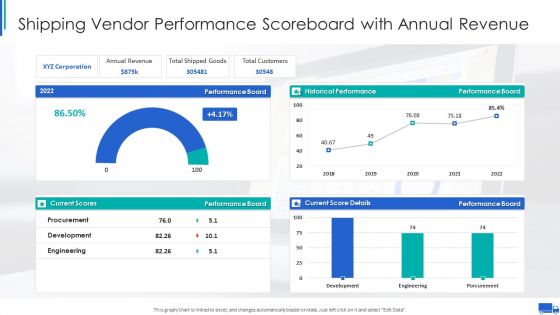
Shipping Vendor Performance Scoreboard With Annual Revenue Ppt Infographics Graphics PDF
This graph or chart is linked to excel, and changes automatically based on data. Just left click on it and select Edit Data. Deliver an awe inspiring pitch with this creative Shipping Vendor Performance Scoreboard With Annual Revenue Ppt Infographics Graphics PDF bundle. Topics like Annual Revenue Board, Total Shipped Goods, Total Customers Performance can be discussed with this completely editable template. It is available for immediate download depending on the needs and requirements of the user.
-
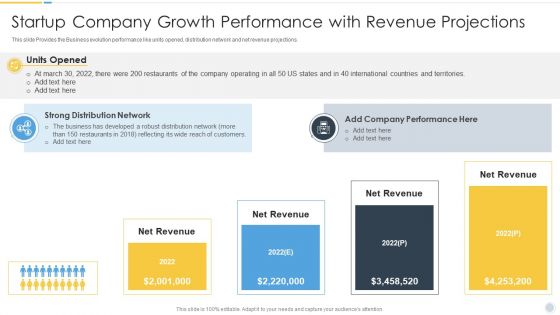
Startup Company Growth Performance With Revenue Projections Start Up Master Plan Icons PDF
This slide Provides the Business evolution performance like units opened, distribution network and net revenue projections.This is a startup company growth performance with revenue projections start up master plan icons pdf template with various stages. Focus and dispense information on four stages using this creative set, that comes with editable features. It contains large content boxes to add your information on topics like strong distribution network, developed a robust distribution, reflecting its wide reach of customers You can also showcase facts, figures, and other relevant content using this PPT layout. Grab it now.
-
Redis Cache Data Structure IT Revenue Loss Due To Poor Performance Information PDF
This slide highlights the revenue loss faced by the company due to poor experience faced by users, which is estimated to be 62 billion every year. Presenting redis cache data structure it revenue loss due to poor performance information pdf to provide visual cues and insights. Share and navigate important information on three stages that need your due attention. This template can be used to pitch topics like revenue loss due to poor performance. In addtion, this PPT design contains high resolution images, graphics, etc, that are easily editable and available for immediate download.
-
Growth Strategy For Startup Company Startup Company Growth Performance With Revenue Ideas PDF
This slide Provides the Business evolution performance like units opened, distribution network and net revenue projections. This is a Growth Strategy For Startup Company Startup Company Growth Performance With Revenue Ideas PDF template with various stages. Focus and dispense information on four stages using this creative set, that comes with editable features. It contains large content boxes to add your information on topics like Net Revenue, Performance, Strong Distribution Network, 2022. You can also showcase facts, figures, and other relevant content using this PPT layout. Grab it now.
-
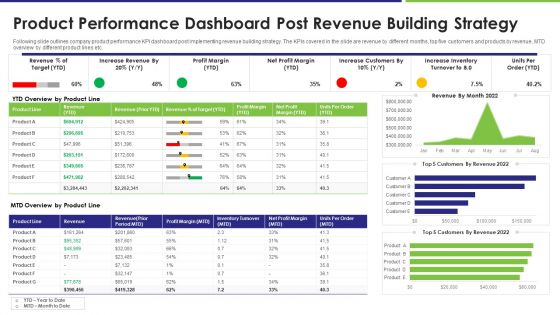
Product Performance Dashboard Post Revenue Building Strategy Brochure PDF
Following slide outlines company product performance KPI dashboard post implementing revenue building strategy. The KPIs covered in the slide are revenue by different months, top five customers and products by revenue, MTD overview by different product lines etc. Showcasing this set of slides titled product performance dashboard post revenue building strategy brochure pdf. The topics addressed in these templates are revenue, target, profit margin. All the content presented in this PPT design is completely editable. Download it and make adjustments in color, background, font etc. as per your unique business setting.
-
Valuing A Pre Revenue Startup Business Startup Valuation Results With Value Per Share Details Designs PDF
This slides shows the startup valuation results with value per share details such as NPV of explicit value, enterprise value, equity value, value per share, etc. This is a valuing a pre revenue startup business startup valuation results with value per share details designs pdf template with various stages. Focus and dispense information on two stages using this creative set, that comes with editable features. It contains large content boxes to add your information on topics like startup valuation results with value per share details. You can also showcase facts, figures, and other relevant content using this PPT layout. Grab it now.
-
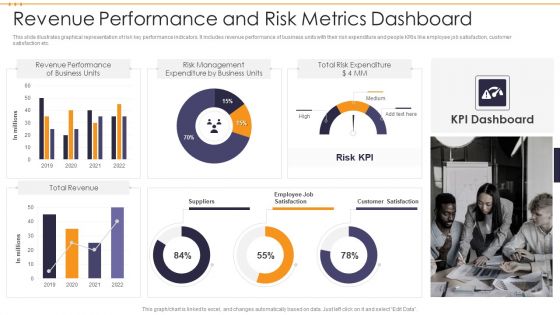
Revenue Performance And Risk Metrics Dashboard Demonstration PDF
This slide illustrates graphical representation of risk key performance indicators. It includes revenue performance of business units with their risk expenditure and people KRIs like employee job satisfaction, customer satisfaction etc. Showcasing this set of slides titled Revenue Performance And Risk Metrics Dashboard Demonstration PDF. The topics addressed in these templates are Total Risk Expenditure, Risk Management, Revenue Performance . All the content presented in this PPT design is completely editable. Download it and make adjustments in color, background, font etc. as per your unique business setting.
-
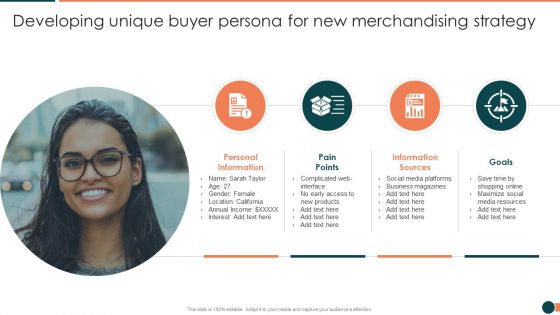
Developing Retail Marketing Strategies To Increase Revenue Developing Unique Buyer Persona Formats PDF
Presenting Developing Retail Marketing Strategies To Increase Revenue Developing Unique Buyer Persona Formats PDF to provide visual cues and insights. Share and navigate important information one stage that need your due attention. This template can be used to pitch topics like Personal Information, Information Sources, Business Magazines In addtion, this PPT design contains high resolution images, graphics, etc, that are easily editable and available for immediate download.
-
Business Revenue Performance Comparison Highlights Ppt Summary Rules PDF
This graph or chart is linked to excel, and changes automatically based on data. Just left click on it and select Edit Data. Showcasing this set of slides titled Business Revenue Performance Comparison Highlights Ppt Summary Rules PDF. The topics addressed in these templates are Customer Acquisition, Customer Actual, Revenue Compared. All the content presented in this PPT design is completely editable. Download it and make adjustments in color, background, font etc. as per your unique business setting.
-
Yearly Product Performance Assessment Repor Total Revenues Generated By The Product Background PDF
Purpose of the following slide is to show the total revenues generated by the product, the provided bar chart displays the various months and the total revenues generated by the product in each. Deliver and pitch your topic in the best possible manner with this Yearly Product Performance Assessment Repor Total Revenues Generated By The Product Background PDF Use them to share invaluable insights on Key Highlights, Revenues Generated, Lowest Revenue and impress your audience. This template can be altered and modified as per your expectations. So, grab it now.
-
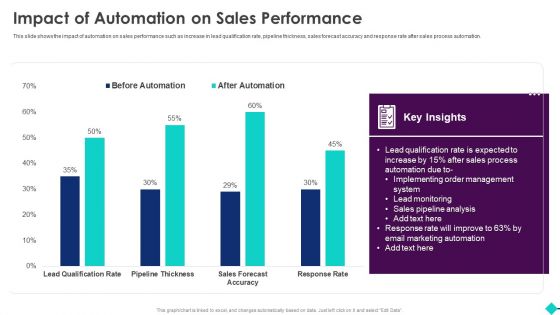
Sales Process Automation For Revenue Growth Impact Of Automation On Sales Performance Graphics PDF
This slide shows the impact of automation on sales performance such as increase in lead qualification rate, pipeline thickness, sales forecast accuracy and response rate after sales process automation.Deliver an awe inspiring pitch with this creative Sales Process Automation For Revenue Growth Impact Of Automation On Sales Performance Graphics PDF bundle. Topics like Lead Qualification, Order Management, Marketing Automation can be discussed with this completely editable template. It is available for immediate download depending on the needs and requirements of the user.
-
Employee Quarterly Sales And Revenue Generation Performance Chart Mockup PDF
This slide depicts annual sales percentage and revenue generated by employee. It provides information regarding overall employee performance for yearly appraisal process. Pitch your topic with ease and precision using this Employee Quarterly Sales And Revenue Generation Performance Chart Mockup PDF. This layout presents information on Performance, Sales, Revenue. It is also available for immediate download and adjustment. So, changes can be made in the color, design, graphics or any other component to create a unique layout.
-
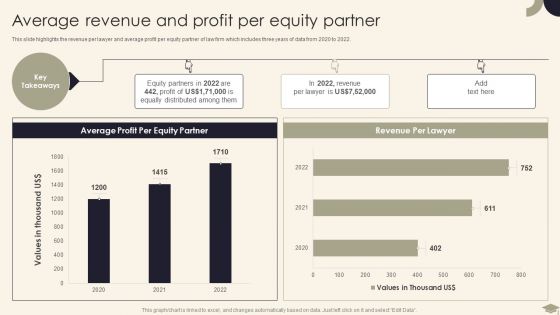
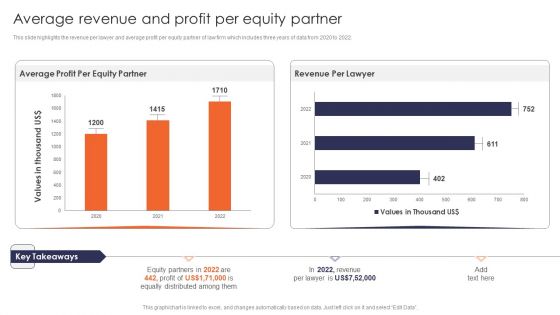
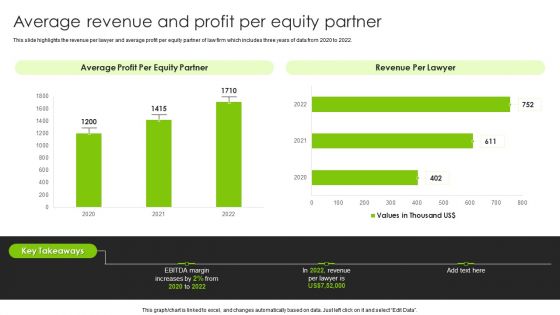
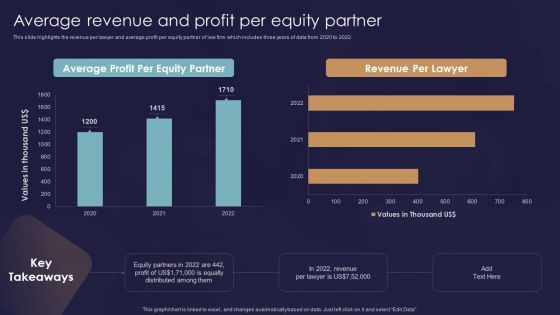
Legal Advisory Company Description Average Revenue And Profit Per Equity Partner Brochure PDF
This slide highlights the revenue per lawyer and average profit per equity partner of law firm which includes three years of data from 2020 to 2022.Deliver and pitch your topic in the best possible manner with this Legal Advisory Company Description Average Revenue And Profit Per Equity Partner Brochure PDF. Use them to share invaluable insights on Distributed Among, Equity Partners, Revenue Lawyer and impress your audience. This template can be altered and modified as per your expectations. So, grab it now.
-
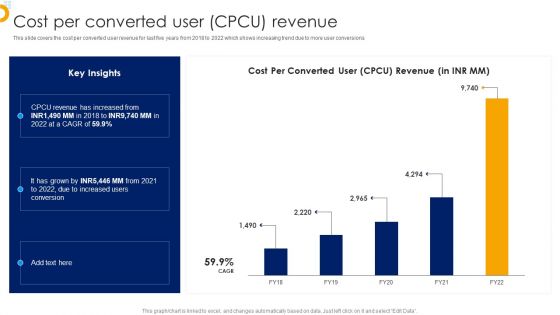
Affle India Ltd Business Profile Cost Per Converted User CPCU Revenue Clipart PDF
Deliver and pitch your topic in the best possible manner with this Affle India Ltd Business Profile Cost Per Converted User CPCU Revenue Clipart PDF. Use them to share invaluable insights on Cost Per Converted User, Revenue and impress your audience. This template can be altered and modified as per your expectations. So, grab it now.
-
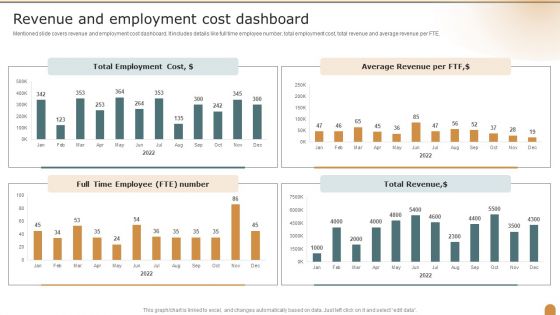
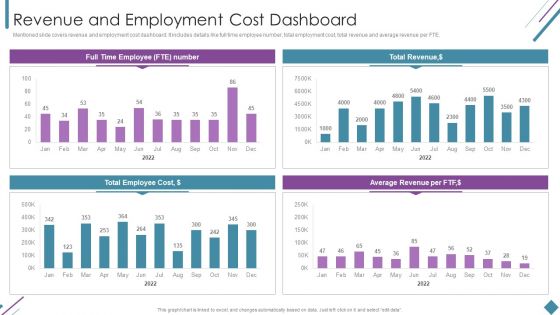
Revenue And Employment Cost Dashboard Company Performance Evaluation Using KPI Microsoft PDF
Mentioned slide covers revenue and employment cost dashboard. It includes details like full time employee number, total employment cost, total revenue and average revenue per FTE. Deliver and pitch your topic in the best possible manner with this Revenue And Employment Cost Dashboard Company Performance Evaluation Using KPI Microsoft PDF. Use them to share invaluable insights on Total Employment, Average Revenue, Dashboard and impress your audience. This template can be altered and modified as per your expectations. So, grab it now.
-
Average Revenue And Profit Per Equity Partner Multinational Legal Firm Company Profile Inspiration PDF
This slide highlights the revenue per lawyer and average profit per equity partner of law firm which includes three years of data from 2020 to 2022. Deliver and pitch your topic in the best possible manner with this Average Revenue And Profit Per Equity Partner Multinational Legal Firm Company Profile Inspiration PDF. Use them to share invaluable insights on Average Profit, Equity Partner, Revenue Per Lawyer and impress your audience. This template can be altered and modified as per your expectations. So, grab it now.
-
Law And Enforcement Company Profile Average Revenue And Profit Per Equity Partner Summary PDF
This slide highlights the revenue per lawyer and average profit per equity partner of law firm which includes three years of data from 2020 to 2022. Deliver and pitch your topic in the best possible manner with this Law And Enforcement Company Profile Average Revenue And Profit Per Equity Partner Summary PDF. Use them to share invaluable insights on Average Profit, Equity Partner, Revenue Per Lawyer and impress your audience. This template can be altered and modified as per your expectations. So, grab it now.
-
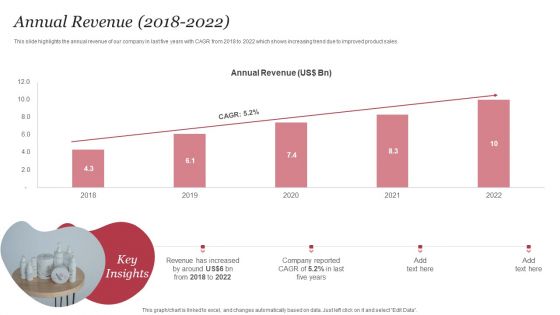
Personal Care Company Profile Annual Revenue 2018 To 2022 Graphics PDF
This slide highlights the annual revenue of our company in last five years with CAGR from 2018 to 2022 which shows increasing trend due to improved product sales. Deliver and pitch your topic in the best possible manner with this Personal Care Company Profile Annual Revenue 2018 To 2022 Graphics PDF. Use them to share invaluable insights on Annual Revenue, Key Insights, Annual Revenue, 2018 To 2022 and impress your audience. This template can be altered and modified as per your expectations. So, grab it now.
-
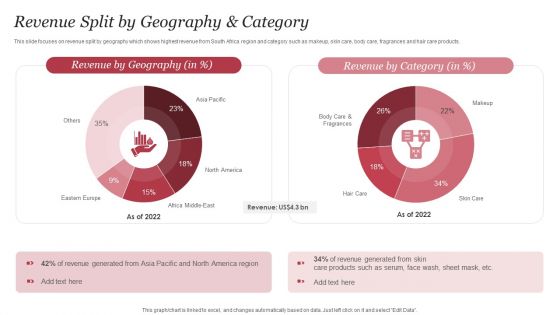
Personal Care Company Profile Revenue Split By Geography And Category Formats PDF
This slide focuses on revenue split by geography which shows highest revenue from South Africa region and category such as makeup, skin care, body care, fragrances and hair care products. Deliver and pitch your topic in the best possible manner with this Personal Care Company Profile Revenue Split By Geography And Category Formats PDF. Use them to share invaluable insights on Revenue Geography, Revenue Category, Revenue Generated and impress your audience. This template can be altered and modified as per your expectations. So, grab it now.
-
International Legal And Business Services Company Profile Average Revenue And Profit Per Equity Partner Diagrams PDF
This slide highlights the revenue per lawyer and average profit per equity partner of law firm which includes three years of data from 2020 to 2022. Deliver an awe inspiring pitch with this creative International Legal And Business Services Company Profile Average Revenue And Profit Per Equity Partner Diagrams PDF bundle. Topics like Revenue Per Lawyer, Average Profit, Equity Partner can be discussed with this completely editable template. It is available for immediate download depending on the needs and requirements of the user.
-
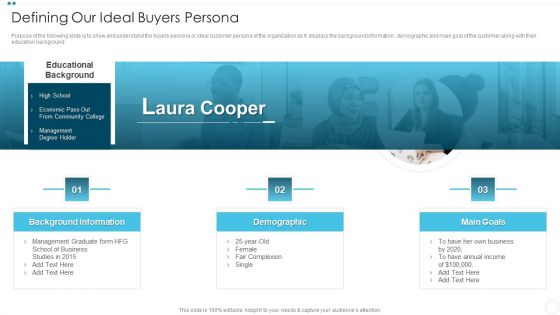
Company Sales Lead Qualification Procedure To Enhance Revenue Defining Our Ideal Buyers Persona Graphics PDF
Purpose of the following slide is to show and understand the buyers persona or ideal customer persona of the organization as It displays the background information , demographic and main goal of the customer along with their education background.Deliver and pitch your topic in the best possible manner with this Company Sales Lead Qualification Procedure To Enhance Revenue Defining Our Ideal Buyers Persona Graphics PDF Use them to share invaluable insights on Background Information, Demographic, Management Graduate and impress your audience. This template can be altered and modified as per your expectations. So, grab it now.
-
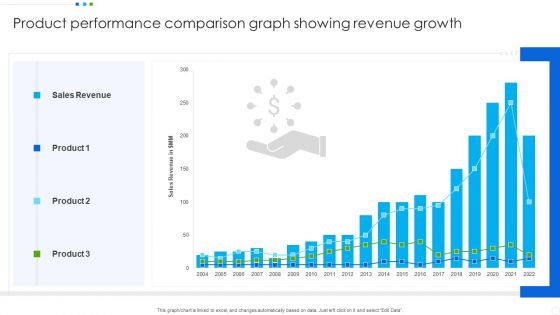
Product Performance Comparison Graph Showing Revenue Growth Portrait PDF
Showcasing this set of slides titled Product Performance Comparison Graph Showing Revenue Growth Portrait PDF. The topics addressed in these templates are Sales Revenue, Product. All the content presented in this PPT design is completely editable. Download it and make adjustments in color, background, font etc. as per your unique business setting.
-
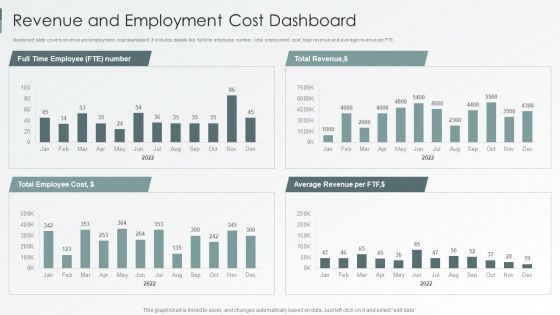
Metrics To Measure Business Performance Revenue And Employment Cost Dashboard Clipart PDF
Mentioned slide covers revenue and employment cost dashboard. It includes details like full time employee number, total employment cost, total revenue and average revenue per FTE. Deliver and pitch your topic in the best possible manner with this Metrics To Measure Business Performance Revenue And Employment Cost Dashboard Clipart PDF. Use them to share invaluable insights on Total Revenue, Average Revenue Per, Total Employee Cost and impress your audience. This template can be altered and modified as per your expectations. So, grab it now.
-
Legal And Law Assistance LLP Business Average Revenue And Profit Per Equity Brochure PDF
This slide highlights the revenue per lawyer and average profit per equity partner of law firm which includes three years of data from 2020 to 2022. Deliver and pitch your topic in the best possible manner with this Legal And Law Assistance LLP Business Average Revenue And Profit Per Equity Brochure PDF. Use them to share invaluable insights on Average Profit, Per Equity Partner, Revenue Per Lawyer and impress your audience. This template can be altered and modified as per your expectations. So, grab it now.
-
Enterprise Sustainability Performance Metrics Revenue And Employment Cost Dashboard Elements PDF
Mentioned slide covers revenue and employment cost dashboard. It includes details like full time employee number, total employment cost, total revenue and average revenue per FTE. Deliver an awe inspiring pitch with this creative Enterprise Sustainability Performance Metrics Revenue And Employment Cost Dashboard Elements PDF bundle. Topics like Total Revenue, Average Revenue, Total Employee can be discussed with this completely editable template. It is available for immediate download depending on the needs and requirements of the user.
-
Disney Plus OTT Platform Company Summary Average Revenue Per Customer Ppt Icon Background Images PDF
The following slide highlights the quarterly revenue generated from each customer. The average revenue depicted is from domestic customers, international customers and Disney plus Hotstar customers. Deliver an awe inspiring pitch with this creative Disney Plus OTT Platform Company Summary Average Revenue Per Customer Ppt Icon Background Images PDF bundle. Topics like Average Revenue, Domestic Market, Average Monthly Revenue can be discussed with this completely editable template. It is available for immediate download depending on the needs and requirements of the user.
-
Distribution Revenue And Logistics With Fleet Performance Status Dashboard Ppt Layouts Background PDF
This slide illustrates facts and figures related to distribution logistics data of a corporation in financial year 2022. It includes fleet performance status, deliveries status, country-wise deliveries, country-wise profit etc. Pitch your topic with ease and precision using this Distribution Revenue And Logistics With Fleet Performance Status Dashboard Ppt Layouts Background PDF. This layout presents information on Deliveries Status, Country Wise Deliveries, Fleet Performance Status. It is also available for immediate download and adjustment. So, changes can be made in the color, design, graphics or any other component to create a unique layout.
-
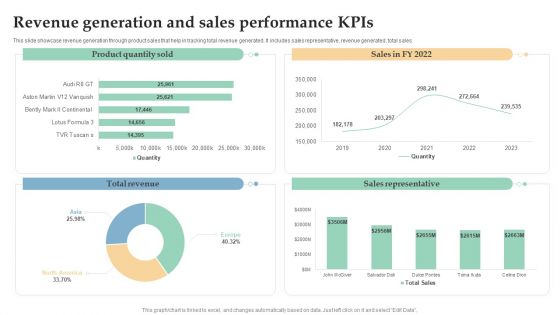
Revenue Generation And Sales Performance Kpis Ppt Inspiration Background Image PDF
This slide showcase revenue generation through product sales that help in tracking total revenue generated. It includes sales representative, revenue generated, total sales. Pitch your topic with ease and precision using this Revenue Generation And Sales Performance Kpis Ppt Inspiration Background Image PDF. This layout presents information on Total Revenue, Sales Representative, Product Quantity Sold. It is also available for immediate download and adjustment. So, changes can be made in the color, design, graphics or any other component to create a unique layout.
-
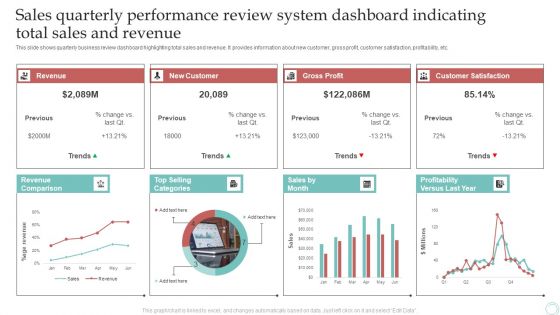
Sales Quarterly Performance Review System Dashboard Indicating Total Sales And Revenue Download PDF
This slide shows quarterly business review dashboard highlighting total sales and revenue. It provides information about new customer, gross profit, customer satisfaction, profitability, etc. Pitch your topic with ease and precision using this Sales Quarterly Performance Review System Dashboard Indicating Total Sales And Revenue Download PDF. This layout presents information on Revenue, New Customer, Gross Profit. It is also available for immediate download and adjustment. So, changes can be made in the color, design, graphics or any other component to create a unique layout.
-
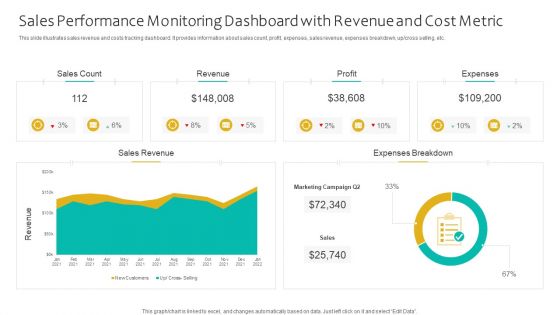
Sales Performance Monitoring Dashboard With Revenue And Cost Metric Ppt Portfolio Good PDF
This slide illustrates sales revenue and costs tracking dashboard. It provides information about sales count, profit, expenses, sales revenue, expenses breakdown, up or cross selling, etc. Showcasing this set of slides titled Sales Performance Monitoring Dashboard With Revenue And Cost Metric Ppt Portfolio Good PDF. The topics addressed in these templates are Sales Count, Revenue, Profit, Expenses. All the content presented in this PPT design is completely editable. Download it and make adjustments in color, background, font etc. as per your unique business setting.
-
KPI Dashboard To Monitor E Commerce Revenue Analysis Performance Mockup PDF
This slide shows the key performance indicators dashboard which can be used to analyze current financial position of e-commerce business. It includes metrics such as revenue, expenses, profit, cash in hand, etc. Showcasing this set of slides titled KPI Dashboard To Monitor E Commerce Revenue Analysis Performance Mockup PDF. The topics addressed in these templates are Accounts Receivable, Accounts Payable, Revenue, Expenses. All the content presented in this PPT design is completely editable. Download it and make adjustments in color, background, font etc. as per your unique business setting.
-
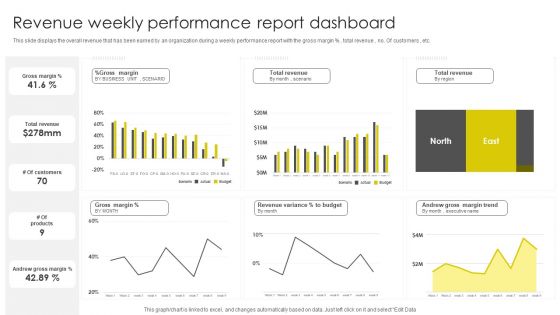
Revenue Weekly Performance Report Dashboard Topics PDF
This slide displays the overall revenue that has been earned by an organization during a weekly performance report with the gross margin percent , total revenue , no. Of customers , etc. Showcasing this set of slides titled Revenue Weekly Performance Report Dashboard Topics PDF. The topics addressed in these templates are Gross Margin, Total Revenue, Customers. All the content presented in this PPT design is completely editable. Download it and make adjustments in color, background, font etc. as per your unique business setting.
-
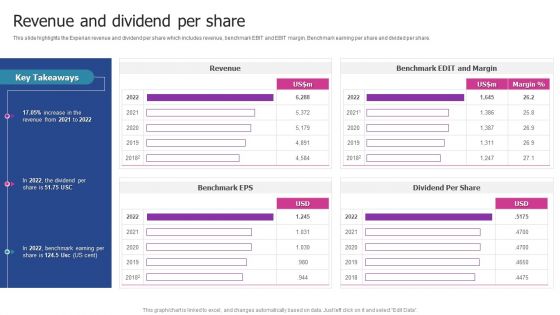
Experian Company Outline Revenue And Dividend Per Share Demonstration PDF
This slide highlights the Experian revenue and dividend per share which includes revenue, benchmark EBIT and EBIT margin, Benchmark earning per share and divided per share. Here you can discover an assortment of the finest PowerPoint and Google Slides templates. With these templates, you can create presentations for a variety of purposes while simultaneously providing your audience with an eye catching visual experience. Download Experian Company Outline Revenue And Dividend Per Share Demonstration PDF to deliver an impeccable presentation. These templates will make your job of preparing presentations much quicker, yet still, maintain a high level of quality. Slidegeeks has experienced researchers who prepare these templates and write high quality content for you. Later on, you can personalize the content by editing the Experian Company Outline Revenue And Dividend Per Share Demonstration PDF.
-
Digital Media Company Quarterly Revenue Per Stream Projections Elements PDF
This slide depicts revenue estimation for a digital media company. It includes stats on revenue generation from game publishers, media rights, sponsorships, advertising, merchandise and tickets. Pitch your topic with ease and precision using this Digital Media Company Quarterly Revenue Per Stream Projections Elements PDF. This layout presents information on Game Publisher Fees, Media Rights, Merchandise And Tickets. It is also available for immediate download and adjustment. So, changes can be made in the color, design, graphics or any other component to create a unique layout.
-
Performance Analysis Using Operating Revenue Business Operational Expenditure And Income Metrics Diagrams PDF
This slide illustrates performance analysis using operating revenue, operating expenditure opex and income metrics which can be referred by organizations to evaluate their inflows and outflows to make relevant decisions for increasing profitability. It includes information about operating revenue, operating expense and income before taxes. Pitch your topic with ease and precision using this Performance Analysis Using Operating Revenue Business Operational Expenditure And Income Metrics Diagrams PDF. This layout presents information on Taxes, Highest Operating, Recorded. It is also available for immediate download and adjustment. So, changes can be made in the color, design, graphics or any other component to create a unique layout.
-
Revenue Projection Post Optimizing Mobile SEO Performing Mobile SEO Audit To Analyze Web Traffic Diagrams PDF
The purpose of this slide is to outline company revenue projection post optimizing mobile search engine optimization SEO. The statistics provides information for 4 years revenue projection in different cities of USA.Welcome to our selection of the Revenue Projection Post Optimizing Mobile SEO Performing Mobile SEO Audit To Analyze Web Traffic Diagrams PDF. These are designed to help you showcase your creativity and bring your sphere to life. Planning and Innovation are essential for any business that is just starting out. This collection contains the designs that you need for your everyday presentations. All of our PowerPoints are 100 precent editable, so you can customize them to suit your needs. This multi-purpose template can be used in various situations. Grab these presentation templates today.
-
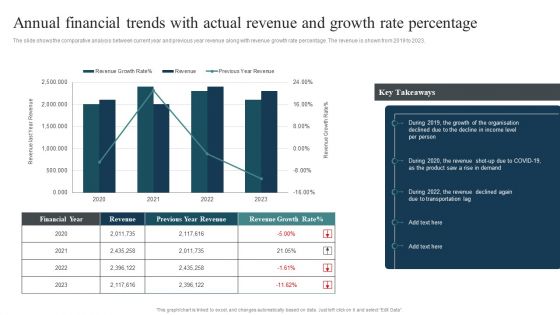
Annual Financial Trends With Actual Revenue And Growth Rate Percentage Download PDF
The slide shows the comparative analysis between current year and previous year revenue along with revenue growth rate percentage. The revenue is shown from 2019 to 2023.Showcasing this set of slides titled Annual Financial Trends With Actual Revenue And Growth Rate Percentage Download PDF. The topics addressed in these templates are Transportation, Revenue Declined, Growth Organisation. All the content presented in this PPT design is completely editable. Download it and make adjustments in color, background, font etc. as per your unique business setting.
-
Revenue Generated Through Personnel Performance Evaluation Report Mockup PDF
This template covers about monthly leads, deals closed in month and revenue generated in whole month . Further, it includes revenue generated by account manager.Pitch your topic with ease and precision using this Revenue Generated Through Personnel Performance Evaluation Report Mockup PDF. This layout presents information on Monthly Lead, Team Activities, Account Manage. It is also available for immediate download and adjustment. So, changes can be made in the color, design, graphics or any other component to create a unique layout.
-
Business Segments Revenue Earning Comparison Financial Performance Report Of Software Firm Topics PDF
The following slide shows the comparison of the revenue share by business segments of a software company. It includes services and solutions revenue share for 2019 and 2023 along with key insights. There are so many reasons you need a Business Segments Revenue Earning Comparison Financial Performance Report Of Software Firm Topics PDF. The first reason is you can not spend time making everything from scratch, Thus, Slidegeeks has made presentation templates for you too. You can easily download these templates from our website easily.
-
Company Historic Revenue Financial Performance Report Of Software Firm Designs PDF
The slide shows annual revenue growth of the company with the CAGR for last five financial years from 2019 to 2023. It also highlights year on year growth along with key insights. Do you have to make sure that everyone on your team knows about any specific topic I yes, then you should give Company Historic Revenue Financial Performance Report Of Software Firm Designs PDF a try. Our experts have put a lot of knowledge and effort into creating this impeccable Company Historic Revenue Financial Performance Report Of Software Firm Designs PDF. You can use this template for your upcoming presentations, as the slides are perfect to represent even the tiniest detail. You can download these templates from the Slidegeeks website and these are easy to edit. So grab these today.
-
Revenue Split By Geography Financial Performance Report Of Software Firm Background PDF
The slide highlights the historical revenue split for software company since its inception and revenue share for current year based on geography. Do you have an important presentation coming up Are you looking for something that will make your presentation stand out from the rest Look no further than Revenue Split By Geography Financial Performance Report Of Software Firm Background PDF. With our professional designs, you can trust that your presentation will pop and make delivering it a smooth process. And with Slidegeeks, you can trust that your presentation will be unique and memorable. So why wait Grab Revenue Split By Geography Financial Performance Report Of Software Firm Background PDF today and make your presentation stand out from the rest.
-
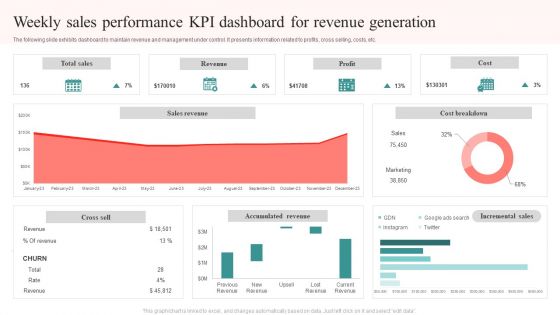
Weekly Sales Performance KPI Dashboard For Revenue Generation Brochure PDF
The following slide exhibits dashboard to maintain revenue and management under control. It presents information related to profits, cross selling, costs, etc. Pitch your topic with ease and precision using this Weekly Sales Performance KPI Dashboard For Revenue Generation Brochure PDF. This layout presents information on Total Sales, Revenue, Profit, Cost. It is also available for immediate download and adjustment. So, changes can be made in the color, design, graphics or any other component to create a unique layout.
-
Company Sales And Revenue Performance Analysis Ppt Ideas Format PDF
This slide covers sales and revenue generated by a business entity. It also includes elements such profits earned, cost incurred, marketing and sales cost breakdown, annual sales revenue graph, sales generated through social media, revenue from up OR cross selling, etc. Pitch your topic with ease and precision using this Company Sales And Revenue Performance Analysis Ppt Ideas Format PDF. This layout presents information on Total Sales, Revenue Generation, Profit Earned, Cost Incurred. It is also available for immediate download and adjustment. So, changes can be made in the color, design, graphics or any other component to create a unique layout.
-
Branch Performance Evaluation Dashboard With Profit And Revenue Diagrams PDF
The slides showcases tips for enhancing branchs workforce performance and efficiency. It covers utilize transaction analysis data, schedule idle time, incent staff for efficiency, get bottom support and use part-time staff.Persuade your audience using this Best Practices To Improve Branch Workforce Performance Evaluation And Efficiency Introduction PDF. This PPT design covers five stages, thus making it a great tool to use. It also caters to a variety of topics including Market Opportunities, Customer Branch, Unnecessary Labor. Download this PPT design now to present a convincing pitch that not only emphasizes the topic but also showcases your presentation skills.
-
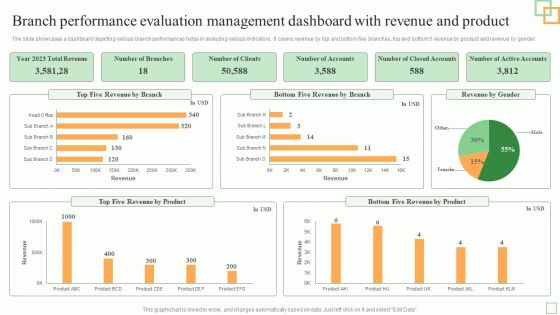
Branch Performance Evaluation Management Dashboard With Revenue And Product Mockup PDF
Pitch your topic with ease and precision using this Branch Performance Evaluation Management Dashboard With Revenue And Product Mockup PDF. This layout presents information on Five Revenue, Revenue Product, Total Revenue. It is also available for immediate download and adjustment. So, changes can be made in the color, design, graphics or any other component to create a unique layout.
-
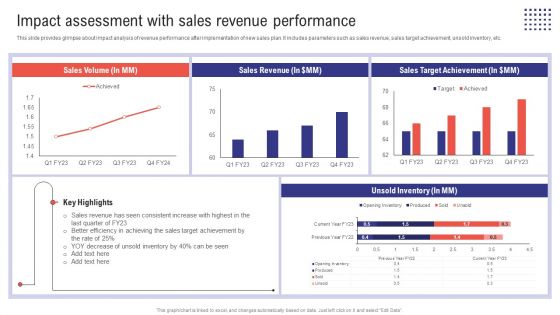
Planning Sales Campaign To Improve Impact Assessment With Sales Revenue Performance Introduction PDF
This slide provides glimpse about impact analysis of revenue performance after implementation of new sales plan. It includes parameters such as sales revenue, sales target achievement, unsold inventory, etc. This modern and well-arranged Planning Sales Campaign To Improve Impact Assessment With Sales Revenue Performance Introduction PDF provides lots of creative possibilities. It is very simple to customize and edit with the Powerpoint Software. Just drag and drop your pictures into the shapes. All facets of this template can be edited with Powerpoint, no extra software is necessary. Add your own material, put your images in the places assigned for them, adjust the colors, and then you can show your slides to the world, with an animated slide included.
-
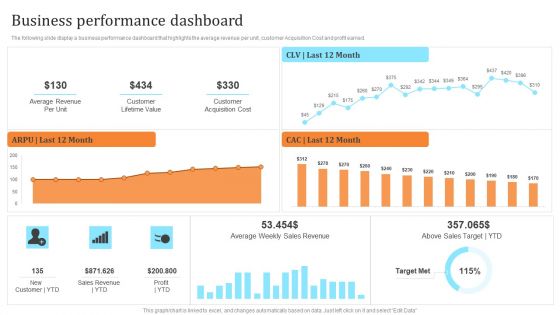
Membership Based Revenue Plan Business Performance Dashboard Ideas PDF
The following slide display a business performance dashboard that highlights the average revenue per unit, customer Acquisition Cost and profit earned. There are so many reasons you need a Membership Based Revenue Plan Business Performance Dashboard Ideas PDF. The first reason is you cant spend time making everything from scratch, Thus, Slidegeeks has made presentation templates for you too. You can easily download these templates from our website easily.
-
Membership Based Revenue Plan Our Financial Performance Over The Year Mockup PDF
The purpose of the following slide is to analyze the financial performance of the organization. The provided graph highlight the revenues, Gross profit and net profit margin of the organization for the year 2020,21,22 and 23. Are you in need of a template that can accommodate all of your creative concepts This one is crafted professionally and can be altered to fit any style. Use it with Google Slides or PowerPoint. Include striking photographs, symbols, depictions, and other visuals. Fill, move around, or remove text boxes as desired. Test out color palettes and font mixtures. Edit and save your work, or work with colleagues. Download Membership Based Revenue Plan Our Financial Performance Over The Year Mockup PDF and observe how to make your presentation outstanding. Give an impeccable presentation to your group and make your presentation unforgettable.
-
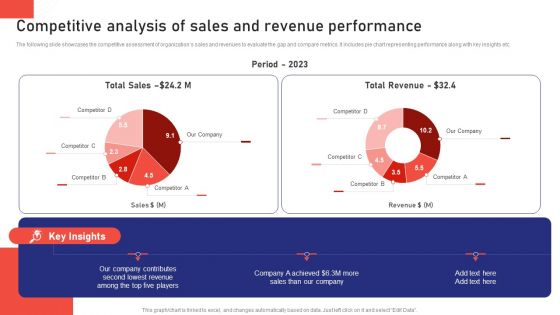
Sales Risk Assessment For Profit Maximization Competitive Analysis Of Sales And Revenue Performance Introduction PDF
The following slide showcases the competitive assessment of organizations sales and revenues to evaluate the gap and compare metrics. It includes pie chart representing performance along with key insights etc. Slidegeeks is one of the best resources for PowerPoint templates. You can download easily and regulate Sales Risk Assessment For Profit Maximization Competitive Analysis Of Sales And Revenue Performance Introduction PDF for your personal presentations from our wonderful collection. A few clicks is all it takes to discover and get the most relevant and appropriate templates. Use our Templates to add a unique zing and appeal to your presentation and meetings. All the slides are easy to edit and you can use them even for advertisement purposes.
-
Content And Permission Marketing Tactics For Enhancing Business Revenues 70 20 10 Rule Social Media Marketing Guidelines PDF
Purpose of the following slide is to display the best practices of utilizing social media marketing. It displays the 70-20-10 rule which defines the type of content to be posted on various social media platforms. Create an editable Content And Permission Marketing Tactics For Enhancing Business Revenues 70 20 10 Rule Social Media Marketing Guidelines PDF that communicates your idea and engages your audience. Whether you are presenting a business or an educational presentation, pre-designed presentation templates help save time. Content And Permission Marketing Tactics For Enhancing Business Revenues 70 20 10 Rule Social Media Marketing Guidelines PDF is highly customizable and very easy to edit, covering many different styles from creative to business presentations. Slidegeeks has creative team members who have crafted amazing templates. So, go and get them without any delay.
-
Content And Permission Marketing Tactics For Enhancing Business Revenues Budget For Marketing Activities Diagrams PDF
Get a simple yet stunning designed Content And Permission Marketing Tactics For Enhancing Business Revenues Budget For Marketing Activities Diagrams PDF. It is the best one to establish the tone in your meetings. It is an excellent way to make your presentations highly effective. So, download this PPT today from Slidegeeks and see the positive impacts. Our easy-to-edit Content And Permission Marketing Tactics For Enhancing Business Revenues Budget For Marketing Activities Diagrams PDF can be your go-to option for all upcoming conferences and meetings. So, what are you waiting for Grab this template today.
-
Content And Permission Marketing Tactics For Enhancing Business Revenues Content Marketing Dashboard Topics PDF
Purpose of the following slide is to show key metrics that can help the organization to track their content marketing efforts, these metrics are ad cost, visits, cost per click etc. Slidegeeks is here to make your presentations a breeze with Content And Permission Marketing Tactics For Enhancing Business Revenues Content Marketing Dashboard Topics PDF With our easy-to-use and customizable templates, you can focus on delivering your ideas rather than worrying about formatting. With a variety of designs to choose from, you are sure to find one that suits your needs. And with animations and unique photos, illustrations, and fonts, you can make your presentation pop. So whether you are giving a sales pitch or presenting to the board, make sure to check out Slidegeeks first
-
Content And Permission Marketing Tactics For Enhancing Business Revenues Social Media Marketing Budget Formats PDF
The following slide displays social media marketing budget which helps in analyzing and understanding the total expenditure done by the organization in the marketing campaign. Key elements of the budget are content creating, social advertisement etc. Find highly impressive Content And Permission Marketing Tactics For Enhancing Business Revenues Social Media Marketing Budget Formats PDF on Slidegeeks to deliver a meaningful presentation. You can save an ample amount of time using these presentation templates. No need to worry to prepare everything from scratch because Slidegeeks experts have already done a huge research and work for you. You need to download Content And Permission Marketing Tactics For Enhancing Business Revenues Social Media Marketing Budget Formats PDF for your upcoming presentation. All the presentation templates are 100 percent editable and you can change the color and personalize the content accordingly. Download now
-
Content And Permission Marketing Tactics For Enhancing Business Revenues Dashboard For Inbound Marketing Efforts Wd Demonstration PDF
The following slide displays key metrics that can help the organization to measure effectiveness of inbound marketing strategy, these can be cost per conversion, clicks, impressions, etc. This modern and well-arranged Content And Permission Marketing Tactics For Enhancing Business Revenues Dashboard For Inbound Marketing Efforts Wd Demonstration PDF provides lots of creative possibilities. It is very simple to customize and edit with the Powerpoint Software. Just drag and drop your pictures into the shapes. All facets of this template can be edited with Powerpoint no extra software is necessary. Add your own material, put your images in the places assigned for them, adjust the colors, and then you can show your slides to the world, with an animated slide included.
-
Content And Permission Marketing Tactics For Enhancing Business Revenues Social Media Marketing Dashboard Download PDF
The following slide displays key metrics that can help the organization to measure effectiveness of social media marketing strategy, these can be growth in engagement, audience growth etc.. Present like a pro with Content And Permission Marketing Tactics For Enhancing Business Revenues Social Media Marketing Dashboard Download PDF Create beautiful presentations together with your team, using our easy-to-use presentation slides. Share your ideas in real-time and make changes on the fly by downloading our templates. So whether you are in the office, on the go, or in a remote location, you can stay in sync with your team and present your ideas with confidence. With Slidegeeks presentation got a whole lot easier. Grab these presentations today.
-
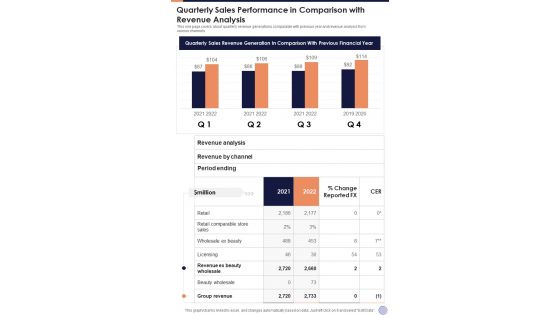
Quarterly Sales Performance In Comparison With Revenue Analysis One Pager Documents
This one page covers about quarterly revenue generations comparable with previous year and revenue analysis from various channels. Presenting you an exemplary Quarterly Sales Performance In Comparison With Revenue Analysis One Pager Documents. Our one-pager comprises all the must-have essentials of an inclusive document. You can edit it with ease, as its layout is completely editable. With such freedom, you can tweak its design and other elements to your requirements. Download this Quarterly Sales Performance In Comparison With Revenue Analysis One Pager Documents brilliant piece now.
-
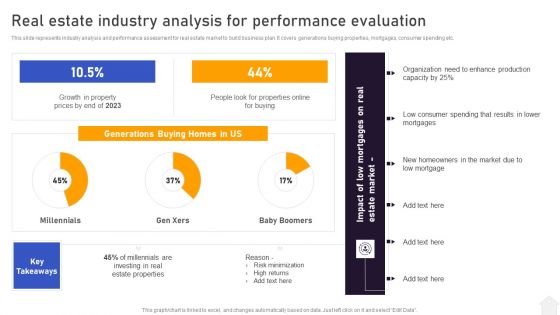
Strategies For Flipping Houses For Maximum Revenue Real Estate Industry Analysis For Performance Evaluation Brochure PDF
This slide represents industry analysis and performance assessment for real estate market to build business plan. It covers generations buying properties, mortgages, consumer spending etc. If your project calls for a presentation, then Slidegeeks is your go to partner because we have professionally designed, easy to edit templates that are perfect for any presentation. After downloading, you can easily edit Strategies For Flipping Houses For Maximum Revenue Real Estate Industry Analysis For Performance Evaluation Brochure PDF and make the changes accordingly. You can rearrange slides or fill them with different images. Check out all the handy templates


