Revenue metrics PowerPoint Presentation Templates and Google Slides
-
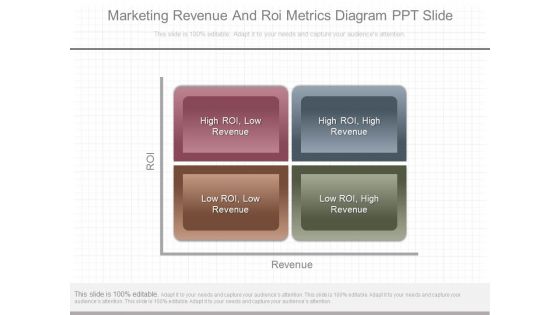
Marketing Revenue And Roi Metrics Diagram Ppt Slide
This is a marketing revenue and roi metrics diagram ppt slide. This is a four stage process. The stages in this process are high roi, low revenue, high roi, high revenue, low roi, low revenue, low roi, high revenue.
-
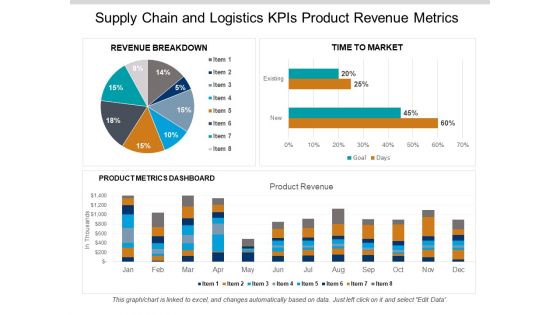
Supply Chain And Logistics Kpis Product Revenue Metrics Ppt PowerPoint Presentation Gallery Aids
This is a supply chain and logistics kpis product revenue metrics ppt powerpoint presentation gallery aids. This is a three stage process. The stages in this process are logistics performance, logistics dashboard, logistics kpis.
-
B2B Marketing KPI Metrics TOP PRODUCTS IN REVENUE Infographics PDF
This is a b2b marketing kpi metrics top products in revenue infographics pdf template with various stages. Focus and dispense information on four stages using this creative set, that comes with editable features. It contains large content boxes to add your information on topics like top products revenue, KPI metrics. You can also showcase facts, figures, and other relevant content using this PPT layout. Grab it now.
-
B2B Marketing KPI Metrics Revenue Ppt File Graphics PDF
Deliver an awe-inspiring pitch with this creative b2b marketing kpi metrics revenue ppt file graphics pdf bundle. Topics like revenue, return investment, roi settled, roi projected can be discussed with this completely editable template. It is available for immediate download depending on the needs and requirements of the user.
-
Key Revenue Funnel Metrics For Assessing Website Performance Ppt PowerPoint Presentation Infographics Master Slide PDF
Persuade your audience using this key revenue funnel metrics for assessing website performance ppt powerpoint presentation infographics master slide pdf. This PPT design covers five stages, thus making it a great tool to use. It also caters to a variety of topics including visitors, prospect, marketing qualified mql, sales qualified sql, won deals, attract and acquire, nurture and qualify, engage when sales ready. Download this PPT design now to present a convincing pitch that not only emphasizes the topic but also showcases your presentation skills.
-
Accounting Advisory Services For Organization Accounting Performance Metrics Evaluated By Our Company Revenue Rules PDF
Presenting this set of slides with name accounting advisory services for organization accounting performance metrics evaluated by our company revenue rules pdf. The topics discussed in these slides are income and expenses, ap and ar balance, quickbooks sales by product, quickbooks revenue. This is a completely editable PowerPoint presentation and is available for immediate download. Download now and impress your audience.
-
Business Revenue KPI Metrics Ppt PowerPoint Presentation File Slide Download PDF
Presenting this set of slides with name business revenue kpi metrics ppt powerpoint presentation file slide download pdf. The topics discussed in these slides are revenue, source, deals. This is a completely editable PowerPoint presentation and is available for immediate download. Download now and impress your audience.
-
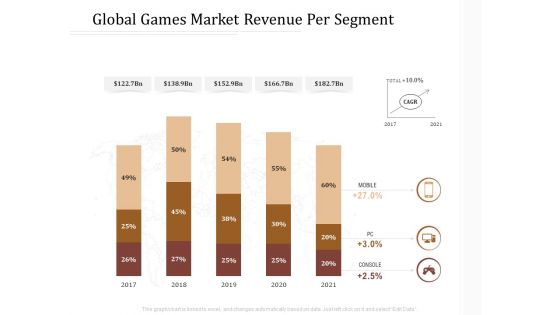
Key Metrics Hotel Administration Management Global Games Market Revenue Per Segment Microsoft PDF
Presenting this set of slides with name key metrics hotel administration management global games market revenue per segment microsoft pdf. The topics discussed in these slides are mobile, pc, console. This is a completely editable PowerPoint presentation and is available for immediate download. Download now and impress your audience.
-
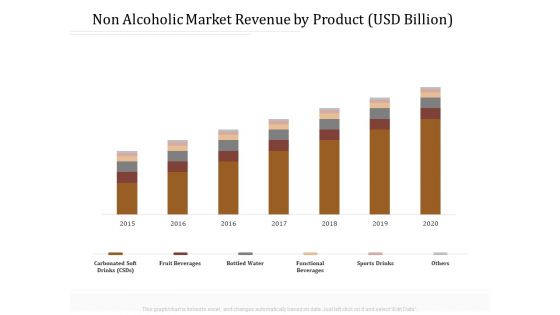
Key Metrics Hotel Administration Management Non Alcoholic Market Revenue By Product USD Billion Inspiration PDF
Presenting this set of slides with name key metrics hotel administration management non alcoholic market revenue by product usd billion inspiration pdf. The topics discussed in these slides are fruit beverages, bottled water, functional beverages, sports drinks, carbonated soft drinks. This is a completely editable PowerPoint presentation and is available for immediate download. Download now and impress your audience.
-
Sales Funnel Management For Revenue Generation Determine Essential Pipeline Metrics Sample PDF
This slide provides information regarding the essential pipeline metrics such as opportunity dollar size vs. average won deal size, opportunity age vs. win cycle and win rate. This is a sales funnel management for revenue generation determine essential pipeline metrics sample pdf template with various stages. Focus and dispense information on three stages using this creative set, that comes with editable features. It contains large content boxes to add your information on topics like opportunity in comparison, likelihood of opportunity, determine duration You can also showcase facts, figures, and other relevant content using this PPT layout. Grab it now.
-
Finance Metrics Dashboard Indicating Product And Service Revenue Designs PDF
This graph or chart is linked to excel, and changes automatically based on data. Just left click on it and select edit data. Showcasing this set of slides titled Finance Metrics Dashboard Indicating Product And Service Revenue Designs PDF. The topics addressed in these templates are Maintenance Revenue Product, Revenue Product Revenues, Service Revenue Rolling. All the content presented in this PPT design is completely editable. Download it and make adjustments in color, background, font etc. as per your unique business setting.
-
Satisfying Consumers Through Strategic Product Building Plan Metrics To Measure Company Revenue And Customers Introduction PDF
This slide shows the metrics to measure company revenues and customers that covers actual revenues with target revenues, average revenue per customer, customer acquisition cost and lifetime value, etc. Deliver an awe inspiring pitch with this creative satisfying consumers through strategic product building plan metrics to measure company revenue and customers introduction pdf bundle. Topics like metrics to measure company revenue and customers can be discussed with this completely editable template. It is available for immediate download depending on the needs and requirements of the user.
-
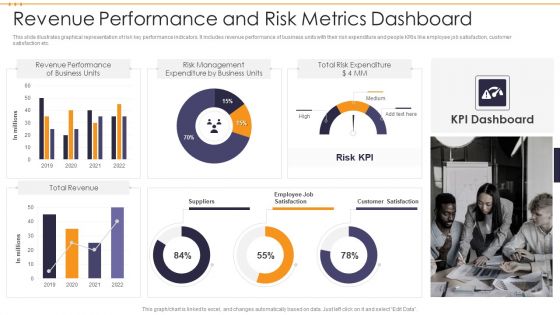
Revenue Performance And Risk Metrics Dashboard Demonstration PDF
This slide illustrates graphical representation of risk key performance indicators. It includes revenue performance of business units with their risk expenditure and people KRIs like employee job satisfaction, customer satisfaction etc. Showcasing this set of slides titled Revenue Performance And Risk Metrics Dashboard Demonstration PDF. The topics addressed in these templates are Total Risk Expenditure, Risk Management, Revenue Performance . All the content presented in this PPT design is completely editable. Download it and make adjustments in color, background, font etc. as per your unique business setting.
-
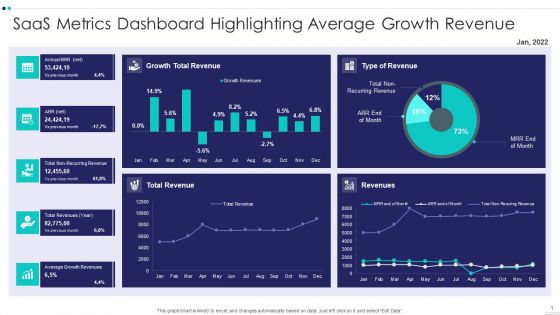
Saas Metrics Dashboard Highlighting Average Growth Revenue Diagrams PDF
Showcasing this set of slides titled Saas Metrics Dashboard Highlighting Average Growth Revenue Diagrams PDF The topics addressed in these templates are Saas Metrics Dashboard Highlighting Average Growth Revenue All the content presented in this PPT design is completely editable. Download it and make adjustments in color, background, font etc. as per your unique business setting.
-
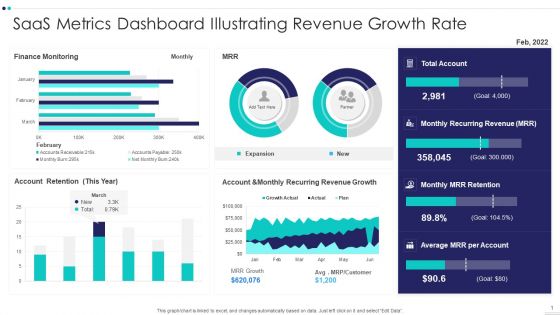
Saas Metrics Dashboard Illustrating Revenue Growth Rate Demonstration PDF
Showcasing this set of slides titled Saas Metrics Dashboard Illustrating Revenue Growth Rate Demonstration PDF The topics addressed in these templates are Saas Metrics Dashboard Illustrating Revenue Growth Rate All the content presented in this PPT design is completely editable. Download it and make adjustments in color, background, font etc. as per your unique business setting.
-
Saas Metrics Dashboard Indicating Net Monthly Recurring Revenue Information PDF
Showcasing this set of slides titled Saas Metrics Dashboard Indicating Net Monthly Recurring Revenue Information PDF The topics addressed in these templates are Saas Metrics Dashboard Indicating Net Monthly Recurring Revenue All the content presented in this PPT design is completely editable. Download it and make adjustments in color, background, font etc. as per your unique business setting.
-
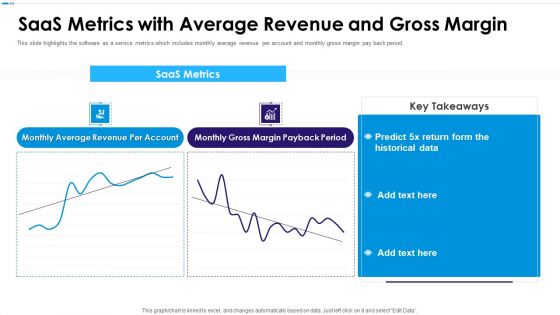
Canvas Capital Raising Elevator Pitch Deck Saas Metrics With Average Revenue And Gross Margin Demonstration PDF
This slide highlights the software as a service metrics which includes monthly average revenue per account and monthly gross margin pay back period.Deliver and pitch your topic in the best possible manner with this Canvas Capital Raising Elevator Pitch Deck Saas Metrics With Average Revenue And Gross Margin Demonstration PDF Use them to share invaluable insights on Average Revenue, Gross Margin, Key Takeaways and impress your audience. This template can be altered and modified as per your expectations. So, grab it now.
-
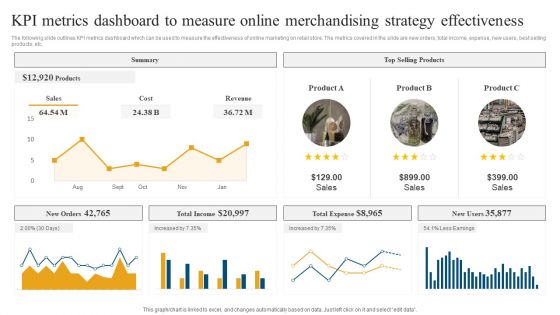
Developing Retail Marketing Strategies To Increase Revenue KPI Metrics Dashboard To Measure Online Portrait PDF
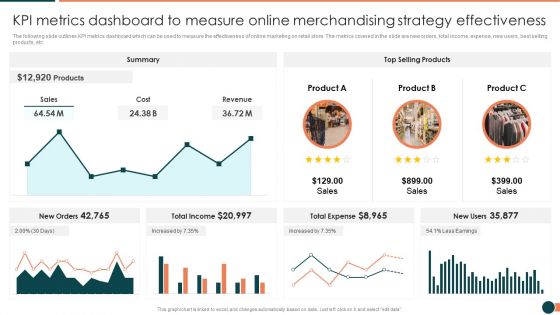
The following slide outlines KPI metrics dashboard which can be used to measure the effectiveness of online marketing on retail store. The metrics covered in the slide are new orders, total income, expense, new users, best selling products, etc.Deliver and pitch your topic in the best possible manner with this Developing Retail Marketing Strategies To Increase Revenue KPI Metrics Dashboard To Measure Online Portrait PDF Use them to share invaluable insights on Total Income, Total Expense, Summary and impress your audience. This template can be altered and modified as per your expectations. So, grab it now.
-
Sales Process Automation For Revenue Growth Digital Marketing Metrics To Monitor Sales Effectiveness Graphics PDF
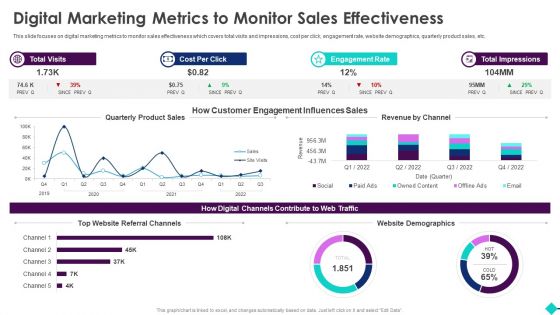
This slide focuses on digital marketing metrics to monitor sales effectiveness which covers total visits and impressions, cost per click, engagement rate, website demographics, quarterly product sales, etc.Deliver and pitch your topic in the best possible manner with this Sales Process Automation For Revenue Growth Digital Marketing Metrics To Monitor Sales Effectiveness Graphics PDF. Use them to share invaluable insights on Automation Potential, Role Of Automation, Included Activities and impress your audience. This template can be altered and modified as per your expectations. So, grab it now.
-
Competitive Sales Strategy Development Plan For Revenue Growth Metrics To Measure Sales Sample PDF
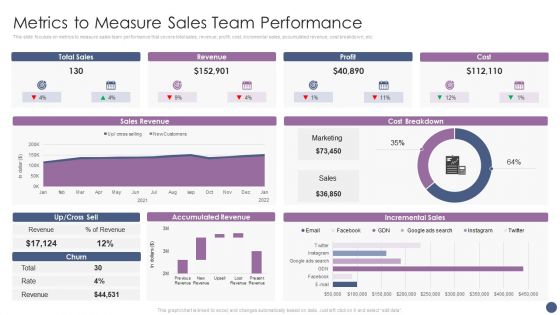
This slide focuses on metrics to measure sales team performance that covers total sales, revenue, profit, cost, incremental sales, accumulated revenue, cost breakdown, etc. Deliver and pitch your topic in the best possible manner with this Competitive Sales Strategy Development Plan For Revenue Growth Metrics To Measure Sales Sample PDF. Use them to share invaluable insights on Sales Revenue, Profit, Cost and impress your audience. This template can be altered and modified as per your expectations. So, grab it now.
-
Content Marketing Freelance Metrics Dashboard With Revenue Generated Demonstration PDF
Showcasing this set of slides titled Content Marketing Freelance Metrics Dashboard With Revenue Generated Demonstration PDF. The topics addressed in these templates are Content Marketing, Freelance Metrics Dashboard, Revenue Generated. All the content presented in this PPT design is completely editable. Download it and make adjustments in color, background, font etc. as per your unique business setting.
-
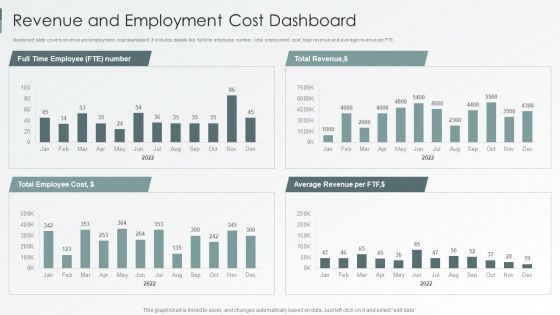
Metrics To Measure Business Performance Revenue And Employment Cost Dashboard Clipart PDF
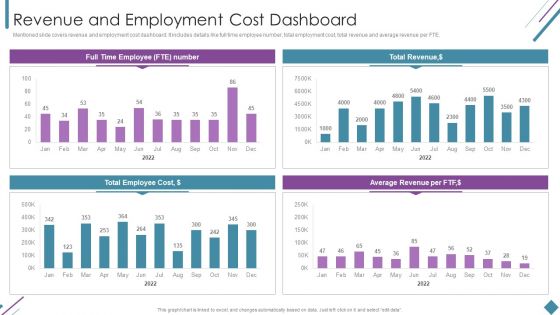
Mentioned slide covers revenue and employment cost dashboard. It includes details like full time employee number, total employment cost, total revenue and average revenue per FTE. Deliver and pitch your topic in the best possible manner with this Metrics To Measure Business Performance Revenue And Employment Cost Dashboard Clipart PDF. Use them to share invaluable insights on Total Revenue, Average Revenue Per, Total Employee Cost and impress your audience. This template can be altered and modified as per your expectations. So, grab it now.
-
Enterprise Sustainability Performance Metrics Revenue And Employment Cost Dashboard Elements PDF
Mentioned slide covers revenue and employment cost dashboard. It includes details like full time employee number, total employment cost, total revenue and average revenue per FTE. Deliver an awe inspiring pitch with this creative Enterprise Sustainability Performance Metrics Revenue And Employment Cost Dashboard Elements PDF bundle. Topics like Total Revenue, Average Revenue, Total Employee can be discussed with this completely editable template. It is available for immediate download depending on the needs and requirements of the user.
-
Project Metrics Dashboard With Revenues And Expenses Icons PDF
This slide shows the project management dashboard which covers the name, priorities, indicators and status which includes strategic priorities, research and development, administration, performance management, etc. With purchases in last 30 days and tasks. Showcasing this set of slides titled Project Metrics Dashboard With Revenues And Expenses Icons PDF. The topics addressed in these templates are Performance Management, Research And Development, Strategic Priorities. All the content presented in this PPT design is completely editable. Download it and make adjustments in color, background, font etc. as per your unique business setting.
-
Customer NPS Metric With Revenue Growth Impact Ppt Show Portrait PDF
This slide illustrates net promoter score with revenue growth impact. It provides information about market average NPS, respondents, promoter, detractor, passive, etc. Pitch your topic with ease and precision using this Customer NPS Metric With Revenue Growth Impact Ppt Show Portrait PDF. This layout presents information on Promoter, Detractor, Passive. It is also available for immediate download and adjustment. So, changes can be made in the color, design, graphics or any other component to create a unique layout.
-
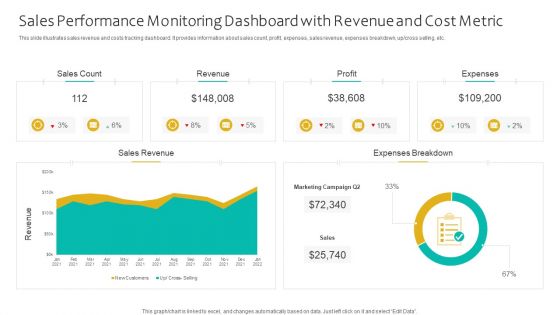
Sales Performance Monitoring Dashboard With Revenue And Cost Metric Ppt Portfolio Good PDF
This slide illustrates sales revenue and costs tracking dashboard. It provides information about sales count, profit, expenses, sales revenue, expenses breakdown, up or cross selling, etc. Showcasing this set of slides titled Sales Performance Monitoring Dashboard With Revenue And Cost Metric Ppt Portfolio Good PDF. The topics addressed in these templates are Sales Count, Revenue, Profit, Expenses. All the content presented in this PPT design is completely editable. Download it and make adjustments in color, background, font etc. as per your unique business setting.
-
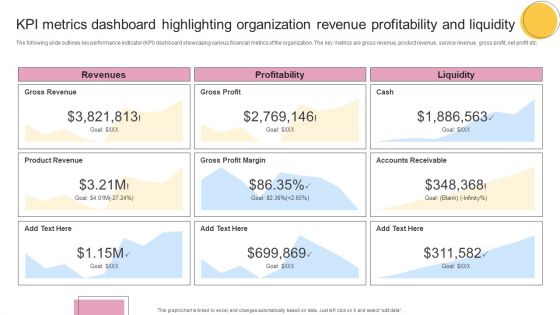
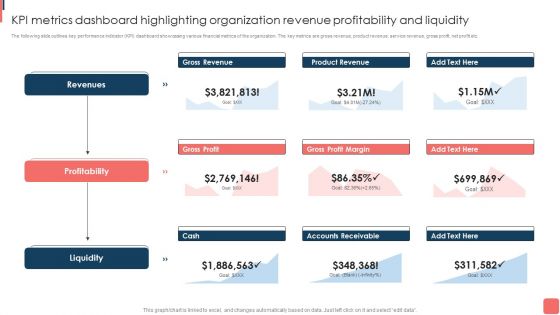
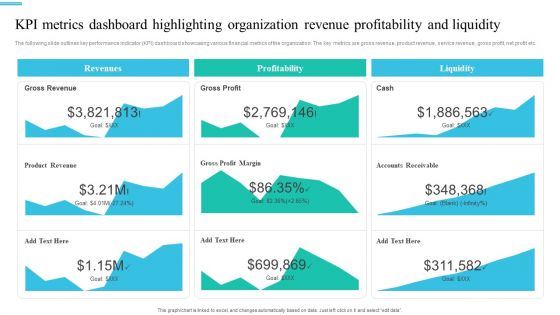
KPI Metrics Dashboard Highlighting Organization Revenue Profitability And Liquidity Formats PDF
The following slide outlines key performance indicator KPI dashboard showcasing various financial metrics of the organization. The key metrics are gross revenue, product revenue, service revenue, gross profit, net profit etc. From laying roadmaps to briefing everything in detail, our templates are perfect for you. You can set the stage with your presentation slides. All you have to do is download these easy to edit and customizable templates. KPI Metrics Dashboard Highlighting Organization Revenue Profitability And Liquidity Formats PDF will help you deliver an outstanding performance that everyone would remember and praise you for. Do download this presentation today.
-
Performance Analysis Using Operating Revenue Business Operational Expenditure And Income Metrics Diagrams PDF
This slide illustrates performance analysis using operating revenue, operating expenditure opex and income metrics which can be referred by organizations to evaluate their inflows and outflows to make relevant decisions for increasing profitability. It includes information about operating revenue, operating expense and income before taxes. Pitch your topic with ease and precision using this Performance Analysis Using Operating Revenue Business Operational Expenditure And Income Metrics Diagrams PDF. This layout presents information on Taxes, Highest Operating, Recorded. It is also available for immediate download and adjustment. So, changes can be made in the color, design, graphics or any other component to create a unique layout.
-
Business Operational Expenditure Dashboard Indicating Revenue And Costs Metrics Pictures PDF
This slide shows operating expenses OPEX dashboard indicating revenue and costs metrics which can be referred by companies to manage various operating expenses of various departments. It contains information about cost center, revenue per company, company code, etc. Pitch your topic with ease and precision using this Business Operational Expenditure Dashboard Indicating Revenue And Costs Metrics Pictures PDF. This layout presents information on Business Operational, Costs Metrics, Revenue. It is also available for immediate download and adjustment. So, changes can be made in the color, design, graphics or any other component to create a unique layout.
-
KPI Metrics Dashboard Highlighting Organization Revenue Profitability And Liquidity Template PDF
The following slide outlines key performance indicator KPI dashboard showcasing various financial metrics of the organization. The key metrics are gross revenue, product revenue, service revenue, gross profit, net profit etc. This KPI Metrics Dashboard Highlighting Organization Revenue Profitability And Liquidity Template PDF from Slidegeeks makes it easy to present information on your topic with precision. It provides customization options, so you can make changes to the colors, design, graphics, or any other component to create a unique layout. It is also available for immediate download, so you can begin using it right away. Slidegeeks has done good research to ensure that you have everything you need to make your presentation stand out. Make a name out there for a brilliant performance.
-
Monetary Planning And Evaluation Guide KPI Metrics Dashboard Highlighting Organization Revenue Profitability And Liquidity Ppt Diagram Images PDF
The following slide outlines key performance indicator KPI dashboard showcasing various financial metrics of the organization. The key metrics are gross revenue, product revenue, service revenue, gross profit, net profit etc. Coming up with a presentation necessitates that the majority of the effort goes into the content and the message you intend to convey. The visuals of a PowerPoint presentation can only be effective if it supplements and supports the story that is being told. Keeping this in mind our experts created Monetary Planning And Evaluation Guide KPI Metrics Dashboard Highlighting Organization Revenue Profitability And Liquidity Ppt Diagram Images PDF to reduce the time that goes into designing the presentation. This way, you can concentrate on the message while our designers take care of providing you with the right template for the situation.
-
Estimating Business Overall Kpi Metrics Dashboard Highlighting Organization Revenue Clipart PDF
The following slide outlines key performance indicator KPI dashboard showcasing various financial metrics of the organization. The key metrics are gross revenue, product revenue, service revenue, gross profit, net profit etc. Formulating a presentation can take up a lot of effort and time, so the content and message should always be the primary focus. The visuals of the PowerPoint can enhance the presenters message, so our Estimating Business Overall Kpi Metrics Dashboard Highlighting Organization Revenue Clipart PDF was created to help save time. Instead of worrying about the design, the presenter can concentrate on the message while our designers work on creating the ideal templates for whatever situation is needed. Slidegeeks has experts for everything from amazing designs to valuable content, we have put everything into Estimating Business Overall Kpi Metrics Dashboard Highlighting Organization Revenue Clipart PDF.
-
Overview Of Organizational Kpi Metrics Dashboard Highlighting Organization Revenue Brochure PDF
The following slide outlines key performance indicator KPI dashboard showcasing various financial metrics of the organization. The key metrics are gross revenue, product revenue, service revenue, gross profit, net profit etc. If your project calls for a presentation, then Slidegeeks is your go-to partner because we have professionally designed, easy-to-edit templates that are perfect for any presentation. After downloading, you can easily edit Overview Of Organizational Kpi Metrics Dashboard Highlighting Organization Revenue Brochure PDF and make the changes accordingly. You can rearrange slides or fill them with different images. Check out all the handy templates.
-
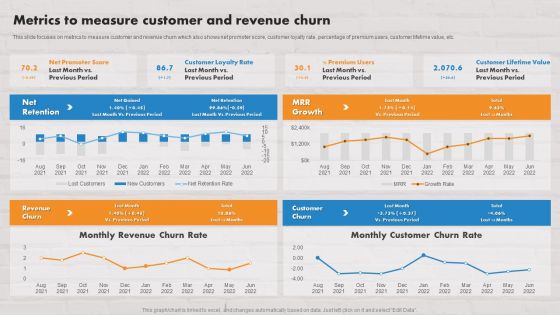
Boosting Customer Base Through Effective Metrics To Measure Customer And Revenue Themes PDF
This slide focuses on metrics to measure customer and revenue churn which also shows net promoter score, customer loyalty rate, percentage of premium users, customer lifetime value, etc. Crafting an eye-catching presentation has never been more straightforward. Let your presentation shine with this tasteful yet straightforward Boosting Customer Base Through Effective Metrics To Measure Customer And Revenue Themes PDF template. It offers a minimalistic and classy look that is great for making a statement. The colors have been employed intelligently to add a bit of playfulness while still remaining professional. Construct the ideal Boosting Customer Base Through Effective Metrics To Measure Customer And Revenue Themes PDF that effortlessly grabs the attention of your audience Begin now and be certain to wow your customers.
-
Customer Service Plan To Improve Sales Metrics To Measure Customer And Revenue Churn Infographics PDF
This slide focuses on metrics to measure customer and revenue churn which also shows net promoter score, customer loyalty rate, percentage of premium users, customer lifetime value, etc. This modern and well arranged Customer Service Plan To Improve Sales Metrics To Measure Customer And Revenue Churn Infographics PDF provides lots of creative possibilities. It is very simple to customize and edit with the Powerpoint Software. Just drag and drop your pictures into the shapes. All facets of this template can be edited with Powerpoint no extra software is necessary. Add your own material, put your images in the places assigned for them, adjust the colors, and then you can show your slides to the world, with an animated slide included.
-
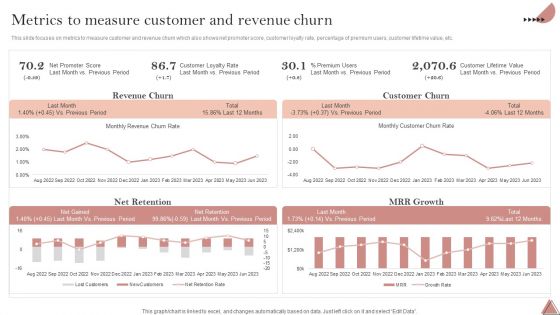
Enhancing Client Engagement Metrics To Measure Customer And Revenue Churn Formats PDF
This slide focuses on metrics to measure customer and revenue churn which also shows net promoter score, customer loyalty rate, percentage of premium users, customer lifetime value, etc. Are you in need of a template that can accommodate all of your creative concepts This one is crafted professionally and can be altered to fit any style. Use it with Google Slides or PowerPoint. Include striking photographs, symbols, depictions, and other visuals. Fill, move around, or remove text boxes as desired. Test out color palettes and font mixtures. Edit and save your work, or work with colleagues. Download Enhancing Client Engagement Metrics To Measure Customer And Revenue Churn Formats PDF and observe how to make your presentation outstanding. Give an impeccable presentation to your group and make your presentation unforgettable.
-
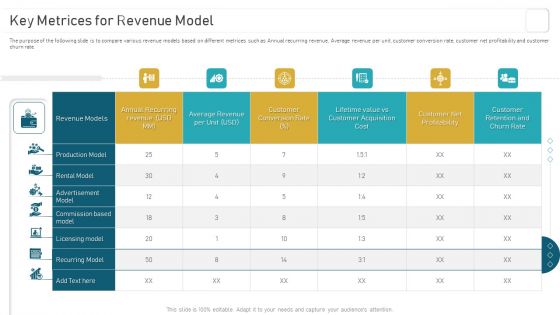
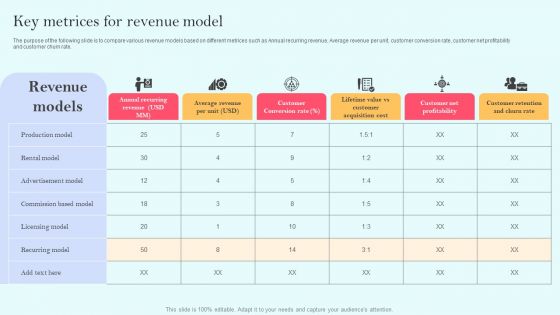
Consumption Based Pricing Model Key Metrices For Revenue Model Elements PDF
The purpose of the following slide is to compare various revenue models based on different metrices such as annual recurring revenue, average revenue per unit, customer conversion rate, customer net profitability and customer churn rate. This modern and well arranged Consumption Based Pricing Model Key Metrices For Forecasting In Recurring Revenue Model Clipart PDF provides lots of creative possibilities. It is very simple to customize and edit with the Powerpoint Software. Just drag and drop your pictures into the shapes. All facets of this template can be edited with Powerpoint no extra software is necessary. Add your own material, put your images in the places assigned for them, adjust the colors, and then you can show your slides to the world, with an animated slide included.
-
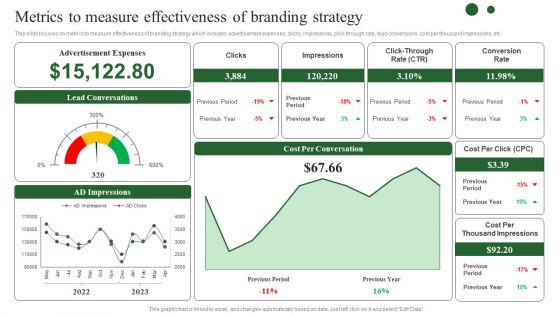
Brand Development Techniques To Increase Revenues Metrics To Measure Effectiveness Branding Demonstration PDF
This slide focuses on metrics to measure effectiveness of branding strategy which includes advertisement expenses, clicks, impressions, click through rate, lead conversions, cost per thousand impressions, etc. Welcome to our selection of the Brand Development Techniques To Increase Revenues Metrics To Measure Effectiveness Branding Demonstration PDF. These are designed to help you showcase your creativity and bring your sphere to life. Planning and Innovation are essential for any business that is just starting out. This collection contains the designs that you need for your everyday presentations. All of our PowerPoints are 100 percent editable, so you can customize them to suit your needs. This multi purpose template can be used in various situations. Grab these presentation templates today.
-
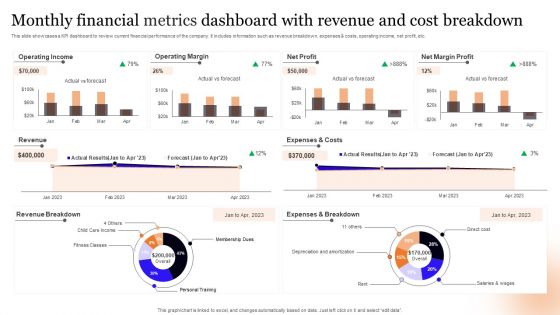
Monthly Financial Metrics Dashboard With Revenue And Cost Breakdown Information PDF
This slide showcases a KPI dashboard to review current financial performance of the company. It includes information such as revenue breakdown, expenses and costs, operating income, net profit, etc. Pitch your topic with ease and precision using this Monthly Financial Metrics Dashboard With Revenue And Cost Breakdown Information PDF. This layout presents information on Operating Income, Operating Margin, Net Profit. It is also available for immediate download and adjustment. So, changes can be made in the color, design, graphics or any other component to create a unique layout.
-
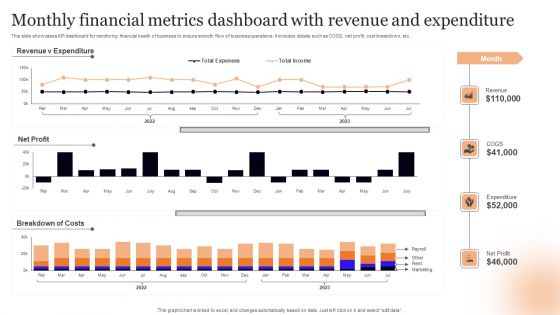
Monthly Financial Metrics Dashboard With Revenue And Expenditure Rules PDF
This slide showcases KPI dashboard for monitoring financial health of business to ensure smooth flow of business operations. It includes details such as COGS, net profit, cost breakdown, etc. Showcasing this set of slides titled Monthly Financial Metrics Dashboard With Revenue And Expenditure Rules PDF. The topics addressed in these templates are Net Profit, Costs, Expenditure. All the content presented in this PPT design is completely editable. Download it and make adjustments in color, background, font etc. as per your unique business setting.
-
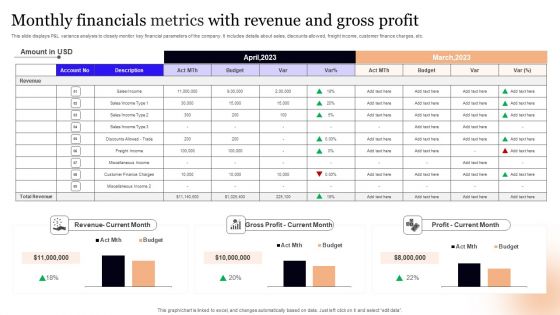
Monthly Financials Metrics With Revenue And Gross Profit Professional PDF
This slide displays P and L variance analysis to closely monitor key financial parameters of the company. It includes details about sales, discounts allowed, freight income, customer finance charges, etc. Showcasing this set of slides titled Monthly Financials Metrics With Revenue And Gross Profit Professional PDF. The topics addressed in these templates are Amount, Current Month, Profit. All the content presented in this PPT design is completely editable. Download it and make adjustments in color, background, font etc. as per your unique business setting.
-
Tactical Communication Plan Metrics To Measure Customer And Revenue Churn Demonstration PDF
This slide focuses on metrics to measure customer and revenue churn which also shows net promoter score, customer loyalty rate, percentage of premium users, customer lifetime value, etc. Presenting this PowerPoint presentation, titled Tactical Communication Plan Metrics To Measure Customer And Revenue Churn Demonstration PDF, with topics curated by our researchers after extensive research. This editable presentation is available for immediate download and provides attractive features when used. Download now and captivate your audience. Presenting this Tactical Communication Plan Metrics To Measure Customer And Revenue Churn Demonstration PDF. Our researchers have carefully researched and created these slides with all aspects taken into consideration. This is a completely customizable Tactical Communication Plan Metrics To Measure Customer And Revenue Churn Demonstration PDF that is available for immediate downloading. Download now and make an impact on your audience. Highlight the attractive features available with our PPTs.
-
Sales Process Automation For Revenue Growth Metrics To Track Prospect Engagement Ideas PDF
This slide focuses on metrics to track prospect engagement such as pageviews, time on page, bounce rate and scroll depth with tracking tools, strategies for optimization and estimated outcome.Deliver and pitch your topic in the best possible manner with this Sales Process Automation For Revenue Growth Metrics To Track Prospect Engagement Ideas PDF. Use them to share invaluable insights on Strategies To Optimize, Estimated Outcome, Feature Popular and impress your audience. This template can be altered and modified as per your expectations. So, grab it now.
-
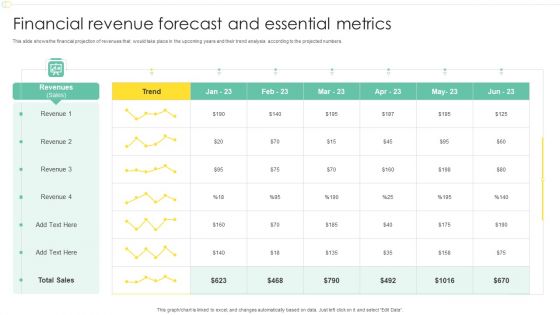
Financial Revenue Forecast And Essential Metrics Ppt Model Infographic Template PDF
This slide shows the financial projection of revenues that would take place in the upcoming years and their trend analysis according to the projected numbers. Showcasing this set of slides titled Financial Revenue Forecast And Essential Metrics Ppt Model Infographic Template PDF. The topics addressed in these templates are Revenues, Sales, Trend. All the content presented in this PPT design is completely editable. Download it and make adjustments in color, background, font etc. as per your unique business setting.
-
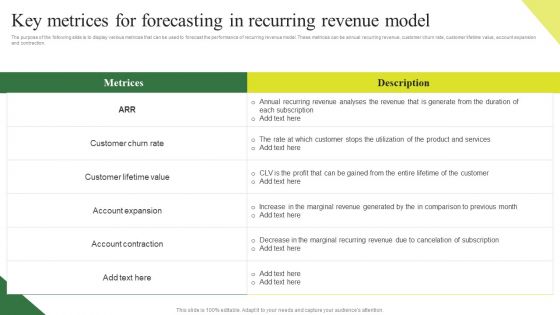
Deploying And Managing Recurring Key Metrices For Forecasting In Recurring Revenue Professional PDF
The purpose of the following slide is to display various metrices that can be used to forecast the performance of recurring revenue model. These metrices can be Annual recurring revenue, Customer churn rate, customer lifetime value, account expansion and contraction. Whether you have daily or monthly meetings, a brilliant presentation is necessary. Deploying And Managing Recurring Key Metrices For Forecasting In Recurring Revenue Professional PDF can be your best option for delivering a presentation. Represent everything in detail using Deploying And Managing Recurring Key Metrices For Forecasting In Recurring Revenue Professional PDF and make yourself stand out in meetings. The template is versatile and follows a structure that will cater to your requirements. All the templates prepared by Slidegeeks are easy to download and edit. Our research experts have taken care of the corporate themes as well. So, give it a try and see the results.
-
Deploying And Managing Recurring Key Metrices For Revenue Model Pictures PDF
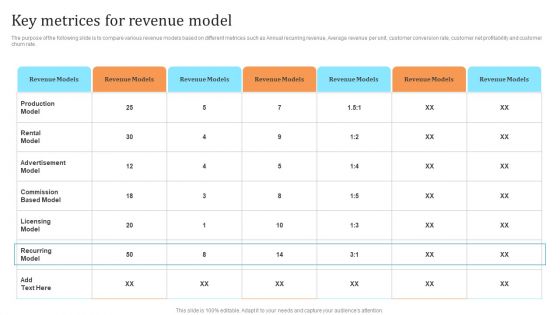
The purpose of the following slide is to compare various revenue models based on different metrices such as Annual recurring revenue, Average revenue per unit, customer conversion rate, customer net profitability and customer churn rate. Find highly impressive Deploying And Managing Recurring Key Metrices For Revenue Model Pictures PDF on Slidegeeks to deliver a meaningful presentation. You can save an ample amount of time using these presentation templates. No need to worry to prepare everything from scratch because Slidegeeks experts have already done a huge research and work for you. You need to download Deploying And Managing Recurring Key Metrices For Revenue Model Pictures PDF for your upcoming presentation. All the presentation templates are 100 percent editable and you can change the color and personalize the content accordingly. Download now.
-
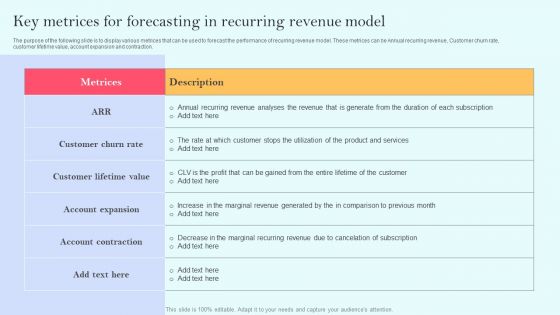
Membership Based Revenue Plan Key Metrices For Forecasting In Recurring Revenue Model Mockup PDF
The purpose of the following slide is to display various metrices that can be used to forecast the performance of recurring revenue model. These metrices can be Annual recurring revenue, Customer churn rate, customer lifetime value, account expansion and contraction. Find highly impressive Membership Based Revenue Plan Key Metrices For Forecasting In Recurring Revenue Model Mockup PDF on Slidegeeks to deliver a meaningful presentation. You can save an ample amount of time using these presentation templates. No need to worry to prepare everything from scratch because Slidegeeks experts have already done a huge research and work for you. You need to download Membership Based Revenue Plan Key Metrices For Forecasting In Recurring Revenue Model Mockup PDF for your upcoming presentation. All the presentation templates are 100 percent editable and you can change the color and personalize the content accordingly. Download now
-
Membership Based Revenue Plan Key Metrices For Revenue Model Inspiration PDF
The purpose of the following slide is to compare various revenue models based on different metrices such as Annual recurring revenue, Average revenue per unit, customer conversion rate, customer net profitability and customer churn rate. If your project calls for a presentation, then Slidegeeks is your go-to partner because we have professionally designed, easy-to-edit templates that are perfect for any presentation. After downloading, you can easily edit Membership Based Revenue Plan Key Metrices For Revenue Model Inspiration PDF and make the changes accordingly. You can rearrange slides or fill them with different images. Check out all the handy templates
-
Content And Permission Marketing Tactics For Enhancing Business Revenues Analyzing Key Marketing Metrics Themes PDF
Slidegeeks is one of the best resources for PowerPoint templates. You can download easily and regulate Content And Permission Marketing Tactics For Enhancing Business Revenues Analyzing Key Marketing Metrics Themes PDF for your personal presentations from our wonderful collection. A few clicks is all it takes to discover and get the most relevant and appropriate templates. Use our Templates to add a unique zing and appeal to your presentation and meetings. All the slides are easy to edit and you can use them even for advertisement purposes.
-
Boosting Yearly Business Revenue Quarterly Sales Goals With Key Metrics Demonstration PDF
This slide can be used by sales managers to represents sales goals per quarter using various metrics. It includes metrics such as sales growth, customer acquisition cost, sales cycle length, customer churn rate, average revenue per unit, etc. Do you have an important presentation coming up Are you looking for something that will make your presentation stand out from the rest Look no further than Boosting Yearly Business Revenue Quarterly Sales Goals With Key Metrics Demonstration PDF. With our professional designs, you can trust that your presentation will pop and make delivering it a smooth process. And with Slidegeeks, you can trust that your presentation will be unique and memorable. So why wait Grab Boosting Yearly Business Revenue Quarterly Sales Goals With Key Metrics Demonstration PDF today and make your presentation stand out from the rest.
-
Consumption Based Pricing Model Key Metrices For Forecasting In Recurring Revenue Model Clipart PDF
The purpose of the following slide is to display various metrices that can be used to forecast the performance of recurring revenue model. These metrices can be annual recurring revenue, customer churn rate, customer lifetime value, account expansion and contraction. Coming up with a presentation necessitates that the majority of the effort goes into the content and the message you intend to convey. The visuals of a PowerPoint presentation can only be effective if it supplements and supports the story that is being told. Keeping this in mind our experts created Consumption Based Pricing Model Key Metrices For Forecasting In Recurring Revenue Model Clipart PDF to reduce the time that goes into designing the presentation. This way, you can concentrate on the message while our designers take care of providing you with the right template for the situation.
-
Recurring Income Generation Model Key Metrices For Forecasting In Recurring Revenue Model Summary PDF
The purpose of the following slide is to display various metrices that can be used to forecast the performance of recurring revenue model. These metrices can be Annual recurring revenue, Customer churn rate, customer lifetime value, account expansion and contraction. This modern and well arranged Recurring Income Generation Model Key Metrices For Forecasting In Recurring Revenue Model Summary PDF provides lots of creative possibilities. It is very simple to customize and edit with the Powerpoint Software. Just drag and drop your pictures into the shapes. All facets of this template can be edited with Powerpoint no extra software is necessary. Add your own material, put your images in the places assigned for them, adjust the colors, and then you can show your slides to the world, with an animated slide included.
-
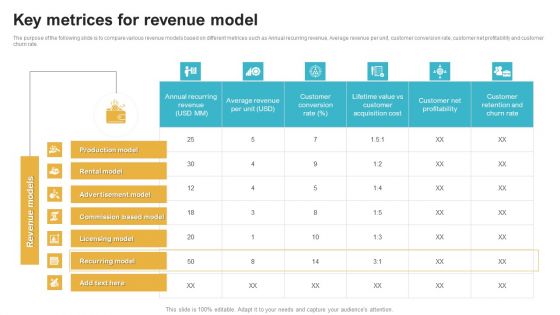
Recurring Income Generation Model Key Metrices For Revenue Model Pictures PDF
The purpose of the following slide is to compare various revenue models based on different metrices such as Annual recurring revenue, Average revenue per unit, customer conversion rate, customer net profitability and customer churn rate. This Recurring Income Generation Model Key Metrices For Revenue Model Pictures PDF is perfect for any presentation, be it in front of clients or colleagues. It is a versatile and stylish solution for organizing your meetings. The Recurring Income Generation Model Key Metrices For Revenue Model Pictures PDF features a modern design for your presentation meetings. The adjustable and customizable slides provide unlimited possibilities for acing up your presentation. Slidegeeks has done all the homework before launching the product for you. So, do not wait, grab the presentation templates today
-
Periodic Revenue Model Key Metrices For Forecasting In Recurring Revenue Model Portrait PDF
The purpose of the following slide is to display various metrices that can be used to forecast the performance of recurring revenue model. These metrices can be Annual recurring revenue, Customer churn rate, customer lifetime value, account expansion and contraction. Find a pre designed and impeccable Periodic Revenue Model Key Metrices For Forecasting In Recurring Revenue Model Portrait PDF. The templates can ace your presentation without additional effort. You can download these easy to edit presentation templates to make your presentation stand out from others. So, what are you waiting for Download the template from Slidegeeks today and give a unique touch to your presentation.
-
Periodic Revenue Model Key Metrices For Revenue Model Topics PDF
The purpose of the following slide is to compare various revenue models based on different metrices such as Annual recurring revenue, Average revenue per unit, customer conversion rate, customer net profitability and customer churn rate. Boost your pitch with our creative Periodic Revenue Model Key Metrices For Revenue Model Topics PDF. Deliver an awe-inspiring pitch that will mesmerize everyone. Using these presentation templates you will surely catch everyones attention. You can browse the ppts collection on our website. We have researchers who are experts at creating the right content for the templates. So you do not have to invest time in any additional work. Just grab the template now and use them.
-
Agriculture Marketing Strategy To Improve Revenue Performance Performance Metrics To Measure Effectiveness Brochure PDF
This slide provides an overview of the performance indicators to measure the results of the farm marketing plan. Major metrics covered are total market sales, asset turnover ratio, working capital and revenue. Do you know about Slidesgeeks Agriculture Marketing Strategy To Improve Revenue Performance Performance Metrics To Measure Effectiveness Brochure PDF. These are perfect for delivering any kind od presentation. Using it, create PowerPoint presentations that communicate your ideas and engage audiences. Save time and effort by using our pre designed presentation templates that are perfect for a wide range of topic. Our vast selection of designs covers a range of styles, from creative to business, and are all highly customizable and easy to edit. Download as a PowerPoint template or use them as Google Slides themes.
-
Retail Ecommerce Merchandising Tactics For Boosting Revenue KPI Metrics Dashboard To Measure Online Background PDF
The following slide outlines KPI metrics dashboard which can be used to measure the effectiveness of online marketing on retail store. The metrics covered in the slide are new orders, total income, expense, new users, best selling products, etc. Make sure to capture your audiences attention in your business displays with our gratis customizable Retail Ecommerce Merchandising Tactics For Boosting Revenue KPI Metrics Dashboard To Measure Online Background PDF. These are great for business strategies, office conferences, capital raising or task suggestions. If you desire to acquire more customers for your tech business and ensure they stay satisfied, create your own sales presentation with these plain slides.
-
Saas Continuous Income Generation Model For Software Startup Key Metrices For Revenue Model Introduction PDF
The purpose of the following slide is to compare various revenue models based on different metrices such as Annual recurring revenue, Average revenue per unit, customer conversion rate, customer net profitability and customer churn rate. This modern and well arranged Saas Continuous Income Generation Model For Software Startup Key Metrices For Revenue Model Introduction PDF provides lots of creative possibilities. It is very simple to customize and edit with the Powerpoint Software. Just drag and drop your pictures into the shapes. All facets of this template can be edited with Powerpoint no extra software is necessary. Add your own material, put your images in the places assigned for them, adjust the colors, and then you can show your slides to the world, with an animated slide included.
-
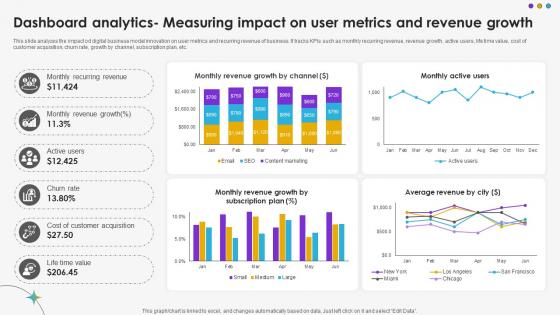
Dashboard Analytics Measuring Impact On User Metrics And Revenue Growth DT SS V
This slide analyzes the impact od digital business model innovation on user metrics and recurring revenue of business. It tracks KPIs such as monthly recurring revenue, revenue growth, active users, life time value, cost of customer acquisition, churn rate, growth by channel, subscription plan, etc.Are you searching for a Dashboard Analytics Measuring Impact On User Metrics And Revenue Growth DT SS V that is uncluttered, straightforward, and original Its easy to edit, and you can change the colors to suit your personal or business branding. For a presentation that expresses how much effort you have put in, this template is ideal With all of its features, including tables, diagrams, statistics, and lists, its perfect for a business plan presentation. Make your ideas more appealing with these professional slides. Download Dashboard Analytics Measuring Impact On User Metrics And Revenue Growth DT SS V from Slidegeeks today.

