Revenue graph PowerPoint Presentation Templates and Google Slides
-
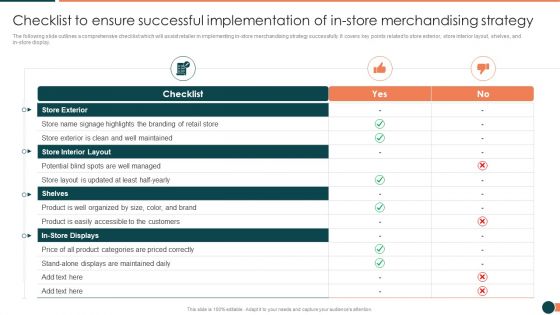
Developing Retail Marketing Strategies To Increase Revenue Checklist To Ensure Successful Graphics PDF
The following slide outlines a comprehensive checklist which will assist retailer in implementing in store merchandising strategy successfully. It covers key points related to store exterior, store interior layout, shelves, and instore display.Deliver and pitch your topic in the best possible manner with this Developing Retail Marketing Strategies To Increase Revenue Checklist To Ensure Successful Graphics PDF Use them to share invaluable insights on Product Categories, Maintained Daily, Product Categories and impress your audience. This template can be altered and modified as per your expectations. So, grab it now.
-
Makeup And Beauty Care Products Company Profile Revenue Split By Geography And Category Graphics PDF
This slide focuses on revenue split by geography which shows highest revenue from South Africa region and category such as makeup, skin care, body care, fragrances and hair care products.Deliver an awe inspiring pitch with this creative Makeup And Beauty Care Products Company Profile Revenue Split By Geography And Category Graphics PDF bundle. Topics like Revenue Geography, Revenue Category, Revenue Generated can be discussed with this completely editable template. It is available for immediate download depending on the needs and requirements of the user.
-
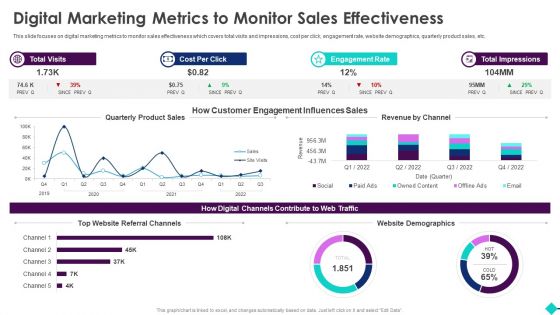
Sales Process Automation For Revenue Growth Digital Marketing Metrics To Monitor Sales Effectiveness Graphics PDF
This slide focuses on digital marketing metrics to monitor sales effectiveness which covers total visits and impressions, cost per click, engagement rate, website demographics, quarterly product sales, etc.Deliver and pitch your topic in the best possible manner with this Sales Process Automation For Revenue Growth Digital Marketing Metrics To Monitor Sales Effectiveness Graphics PDF. Use them to share invaluable insights on Automation Potential, Role Of Automation, Included Activities and impress your audience. This template can be altered and modified as per your expectations. So, grab it now.
-
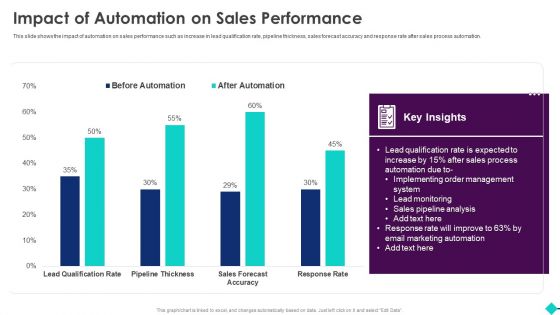
Sales Process Automation For Revenue Growth Impact Of Automation On Sales Performance Graphics PDF
This slide shows the impact of automation on sales performance such as increase in lead qualification rate, pipeline thickness, sales forecast accuracy and response rate after sales process automation.Deliver an awe inspiring pitch with this creative Sales Process Automation For Revenue Growth Impact Of Automation On Sales Performance Graphics PDF bundle. Topics like Lead Qualification, Order Management, Marketing Automation can be discussed with this completely editable template. It is available for immediate download depending on the needs and requirements of the user.
-
Security Officer Service Company Profile Revenue And Net Profit Ppt PowerPoint Presentation Gallery Graphic Images PDF
This slide highlights the revenue and net profit of security guard company through bar graph and tabular format. It covers three years data of revenue, and net profit. Deliver an awe inspiring pitch with this creative Security Officer Service Company Profile Revenue And Net Profit Ppt PowerPoint Presentation Gallery Graphic Images PDF bundle. Topics like Net Profit, Increase Revenue, 2018 To 2022 can be discussed with this completely editable template. It is available for immediate download depending on the needs and requirements of the user.
-
IT Consultancy Services Company Profile Revenue Split By Geography Graphics PDF
This slide represents the revenue generation by geography which shows data from last four years by comparing revenues of United States with rest of the world.Deliver and pitch your topic in the best possible manner with this IT Consultancy Services Company Profile Revenue Split By Geography Graphics PDF. Use them to share invaluable insights on Highest Revenue, Key Insights, Companys Revenue and impress your audience. This template can be altered and modified as per your expectations. So, grab it now.
-
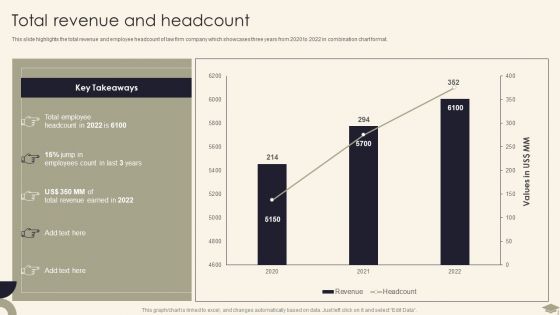
Legal Advisory Company Description Total Revenue And Headcount Graphics PDF
This slide highlights the total revenue and employee headcount of law firm company which showcases three years from 2020 to 2022 in combination chart format.Deliver and pitch your topic in the best possible manner with this Legal Advisory Company Description Total Revenue And Headcount Graphics PDF. Use them to share invaluable insights on Total Employee, Revenue Earned, Employees Count and impress your audience. This template can be altered and modified as per your expectations. So, grab it now.
-
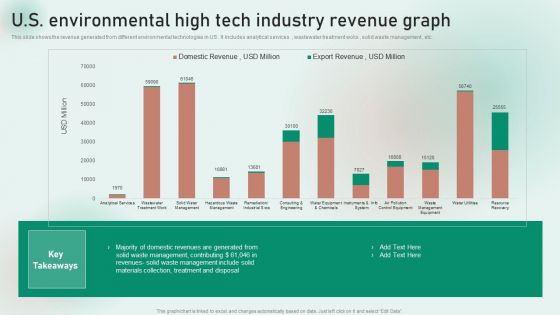
U S Environmental High Tech Industry Revenue Graph Professional PDF
This slide shows the revenue generated from different environmental technologies in US . It includes analytical services , wastewater treatment woks , solid waste management , etc. Showcasing this set of slides titled U S Environmental High Tech Industry Revenue Graph Professional PDF. The topics addressed in these templates are Management, Materials Collection, Revenues. All the content presented in this PPT design is completely editable. Download it and make adjustments in color, background, font etc. as per your unique business setting.
-
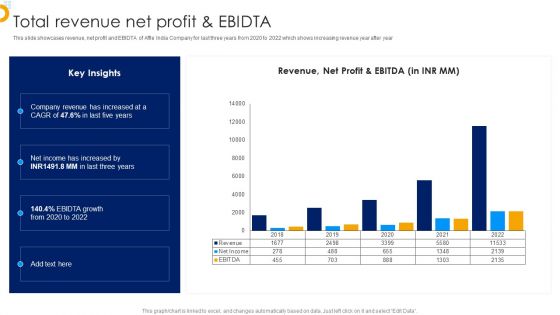
Affle India Ltd Business Profile Total Revenue Net Profit And Ebidta Graphics PDF
Deliver an awe inspiring pitch with this creative Affle India Ltd Business Profile Total Revenue Net Profit And Ebidta Graphics PDF bundle. Topics like Company Revenue, Growth, Net Profit can be discussed with this completely editable template. It is available for immediate download depending on the needs and requirements of the user.
-
Total Revenue And Headcount Multinational Legal Firm Company Profile Graphics PDF
This slide highlights the total revenue and employee headcount of law firm company which showcases three years from 2020 to 2022 in combination chart format. Deliver an awe inspiring pitch with this creative Total Revenue And Headcount Multinational Legal Firm Company Profile Graphics PDF bundle. Topics like Total Revenue, Headcount can be discussed with this completely editable template. It is available for immediate download depending on the needs and requirements of the user.
-
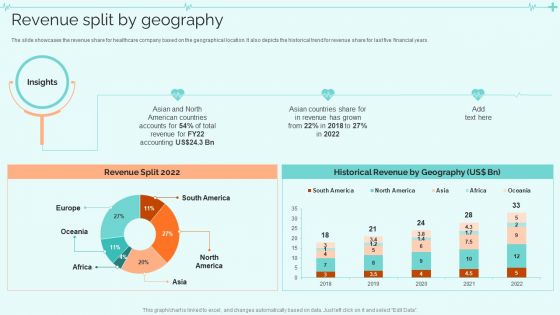
Clinical Services Company Profile Revenue Split By Geography Graphics PDF
The slide showcases the revenue share for healthcare company based on the geographical location. It also depicts the historical trend for revenue share for last five financial years. Deliver an awe inspiring pitch with this creative Clinical Services Company Profile Revenue Split By Geography Graphics PDF bundle. Topics like Revenue Split, Historical Revenue By Geography can be discussed with this completely editable template. It is available for immediate download depending on the needs and requirements of the user.
-
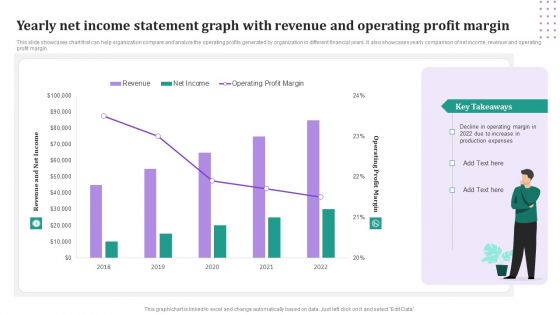
Yearly Net Income Statement Graph With Revenue And Operating Profit Margin Download PDF
This slide showcases chart that can help organization compare and analyze the operating profits generated by organization in different financial years. It also showcases yearly comparison of net income, revenue and operating profit margin. Pitch your topic with ease and precision using this Yearly Net Income Statement Graph With Revenue And Operating Profit Margin Download PDF. This layout presents information on Revenue, Net Income, Operating Profit Margin. It is also available for immediate download and adjustment. So, changes can be made in the color, design, graphics or any other component to create a unique layout.
-
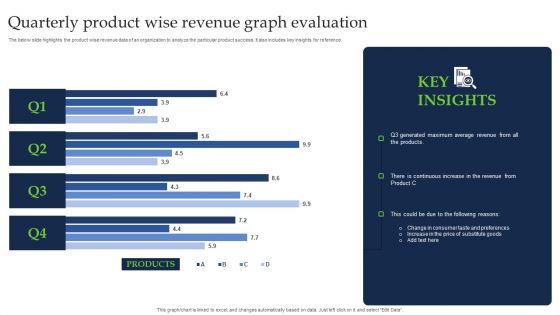
Quarterly Product Wise Revenue Graph Evaluation Brochure PDF
The below slide highlights the product wise revenue data of an organization to analyze the particular product success. It also includes key insights for reference. Pitch your topic with ease and precision using this Quarterly Product Wise Revenue Graph Evaluation Brochure PDF. This layout presents information on Products, Average Revenue. It is also available for immediate download and adjustment. So, changes can be made in the color, design, graphics or any other component to create a unique layout.
-
6 Year Revenue Declining Graph Ppt PowerPoint Presentation Outline Sample PDF
This slide shows the revenues of the company over the last years to have a clear idea of organization growth and financial status . It includes the 6 year 2017 to 2022 revenue earned by the company.Showcasing this set of slides titled 6 Year Revenue Declining Graph Ppt PowerPoint Presentation Outline Sample PDF. The topics addressed in these templates are Revenue Company, Highest Comparison, Conditions Restrictions. All the content presented in this PPT design is completely editable. Download it and make adjustments in color, background, font etc. as per your unique business setting.
-
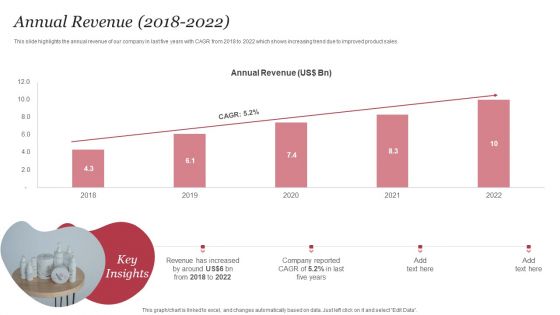
Personal Care Company Profile Annual Revenue 2018 To 2022 Graphics PDF
This slide highlights the annual revenue of our company in last five years with CAGR from 2018 to 2022 which shows increasing trend due to improved product sales. Deliver and pitch your topic in the best possible manner with this Personal Care Company Profile Annual Revenue 2018 To 2022 Graphics PDF. Use them to share invaluable insights on Annual Revenue, Key Insights, Annual Revenue, 2018 To 2022 and impress your audience. This template can be altered and modified as per your expectations. So, grab it now.
-
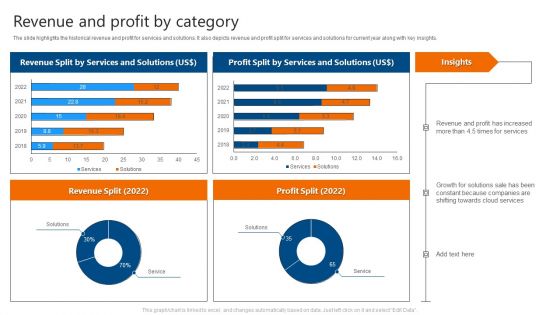
Revenue And Profit By Category IT Software Development Company Profile Graphics PDF
The slide highlights the historical revenue and profit for services and solutions. It also depicts revenue and profit split for services and solutions for current year along with key insights. Deliver an awe inspiring pitch with this creative Revenue And Profit By Category IT Software Development Company Profile Graphics PDF bundle. Topics like Revenue Split By Services, Profit Split By Services can be discussed with this completely editable template. It is available for immediate download depending on the needs and requirements of the user.
-
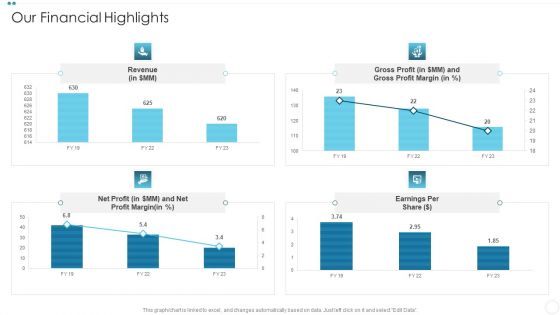
Company Sales Lead Qualification Procedure To Enhance Revenue Our Financial Highlights Graphics PDF
Deliver and pitch your topic in the best possible manner with this Company Sales Lead Qualification Procedure To Enhance Revenue Our Financial Highlights Graphics PDF Use them to share invaluable insights on Gross Profit, Profit Margin, Revenue and impress your audience. This template can be altered and modified as per your expectations. So, grab it now.
-
Company Sales Lead Qualification Procedure To Enhance Revenue Utilizing The GPCTBAC Model Graphics PDF
Purpose of the following slide is to display the utilization of the GPCTBAC model as it displays the key qualification criteria of the customer, these criterias are customers goal, plan, challenges, timeline, budget, authority, negative consequences etc. Deliver an awe inspiring pitch with this creative Company Sales Lead Qualification Procedure To Enhance Revenue Utilizing The GPCTBAC Model Graphics PDF bundle. Topics like Negative Consequences, Potential Implementation, Qualification can be discussed with this completely editable template. It is available for immediate download depending on the needs and requirements of the user.
-
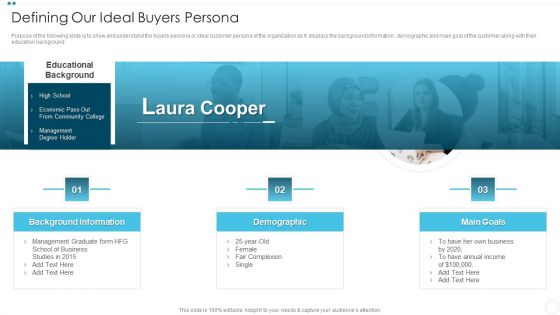
Company Sales Lead Qualification Procedure To Enhance Revenue Defining Our Ideal Buyers Persona Graphics PDF
Purpose of the following slide is to show and understand the buyers persona or ideal customer persona of the organization as It displays the background information , demographic and main goal of the customer along with their education background.Deliver and pitch your topic in the best possible manner with this Company Sales Lead Qualification Procedure To Enhance Revenue Defining Our Ideal Buyers Persona Graphics PDF Use them to share invaluable insights on Background Information, Demographic, Management Graduate and impress your audience. This template can be altered and modified as per your expectations. So, grab it now.
-
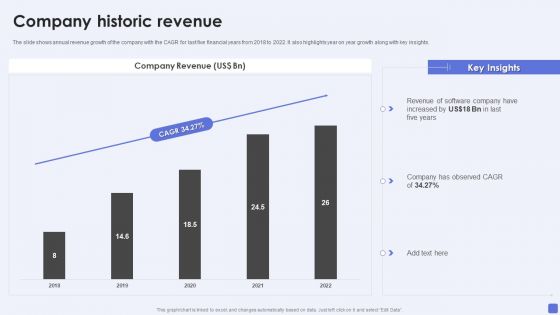
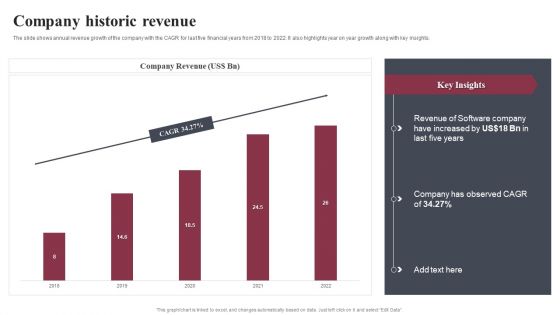
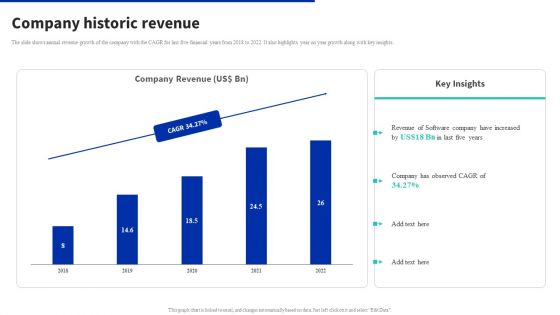
Software Services Business Profile Company Historic Revenue Ppt PowerPoint Presentation Gallery Graphics Download PDF
The slide shows annual revenue growth of the company with the CAGR for last five financial years from 2018 to 2022. It also highlights year on year growth along with key insights. Deliver and pitch your topic in the best possible manner with this Software Services Business Profile Company Historic Revenue Ppt PowerPoint Presentation Gallery Graphics Download PDF. Use them to share invaluable insights on Company Revenue, Observed CAGR, 2018 To 2022 and impress your audience. This template can be altered and modified as per your expectations. So, grab it now.
-
Graphic Designing And Visual Arts Company Profile Revenue And Net Profits Mockup PDF
This slide focuses on financial highlights of graphic design company which represents revenue and net profits for last five years from 2018 to 2022. Deliver and pitch your topic in the best possible manner with this Graphic Designing And Visual Arts Company Profile Revenue And Net Profits Mockup PDF. Use them to share invaluable insights on Companys Revenue, Net Profit Increased, Value and impress your audience. This template can be altered and modified as per your expectations. So, grab it now.
-
Graphic Designing And Visual Arts Company Profile Revenue Split By Geography Rules PDF
This slide represents the revenue split by geography which includes revenue comparison between United States and rest of the world for last five years from 2018 to 2022. Deliver an awe inspiring pitch with this creative Graphic Designing And Visual Arts Company Profile Revenue Split By Geography Rules PDF bundle. Topics like Revenue Distribution, Geography can be discussed with this completely editable template. It is available for immediate download depending on the needs and requirements of the user.
-
Customizable Circle Charts For Revenue Split Of The Company Graphics PDF
Showcasing this set of slides titled Customizable Circle Charts For Revenue Split Of The Company Graphics PDF The topics addressed in these templates are Customizable Circle, Charts Revenue, Split Company All the content presented in this PPT design is completely editable. Download it and make adjustments in color, background, font etc. as per your unique business setting.
-
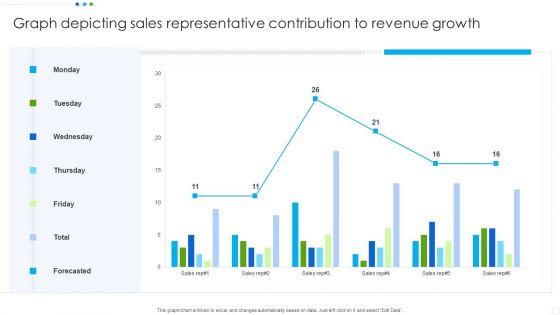
Graph Depicting Sales Representative Contribution To Revenue Growth Graphics PDF
Showcasing this set of slides titled Graph Depicting Sales Representative Contribution To Revenue Growth Graphics PDF. The topics addressed in these templates are Graph Depicting Sales, Revenue Growth. All the content presented in this PPT design is completely editable. Download it and make adjustments in color, background, font etc. as per your unique business setting.
-
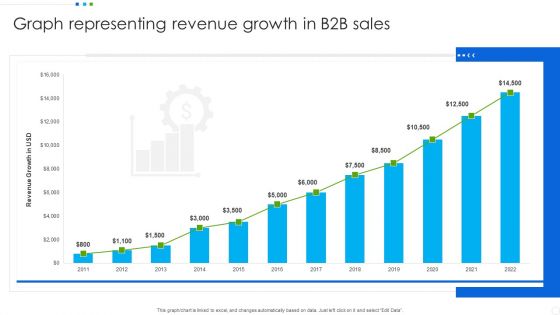
Graph Representing Revenue Growth In B2b Sales Background PDF
Pitch your topic with ease and precision using this Graph Representing Revenue Growth In B2b Sales Background PDF. This layout presents information on Graph Representing, Revenue Growth, Sales. It is also available for immediate download and adjustment. So, changes can be made in the color, design, graphics or any other component to create a unique layout.
-
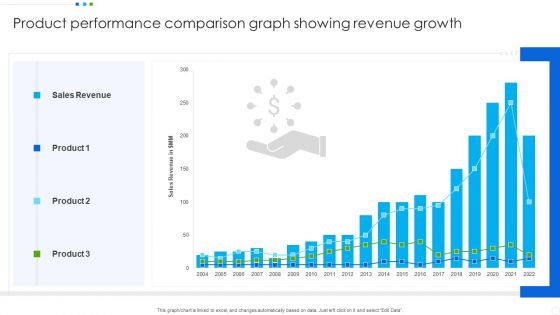
Product Performance Comparison Graph Showing Revenue Growth Portrait PDF
Showcasing this set of slides titled Product Performance Comparison Graph Showing Revenue Growth Portrait PDF. The topics addressed in these templates are Sales Revenue, Product. All the content presented in this PPT design is completely editable. Download it and make adjustments in color, background, font etc. as per your unique business setting.
-
Front Capital Funding Revenue And Expenses Projections Of Front Ppt Portfolio Graphic Tips PDF
This slide shows the revenue projections of Front with related information such as MRR and headcount. Also, this slide provides information about the expenses such as payroll, selling and marketing, other etc. in the form of a graph. Deliver an awe inspiring pitch with this creative Front Capital Funding Revenue And Expenses Projections Of Front Ppt Portfolio Graphic Tips PDF bundle. Topics like Selling AND Marketing, Payroll Eng, Annual Recurring Revenue can be discussed with this completely editable template. It is available for immediate download depending on the needs and requirements of the user.
-
Business Software Development Company Profile Company Historic Revenue Graphics PDF
The slide shows annual revenue growth of the company with the CAGR for last five financial years from 2018 to 2022. It also highlights year on year growth along with key insights. Deliver and pitch your topic in the best possible manner with this Business Software Development Company Profile Company Historic Revenue Graphics PDF. Use them to share invaluable insights on Company Revenue, Observed CAGR, 2018 To 2022 and impress your audience. This template can be altered and modified as per your expectations. So, grab it now.
-
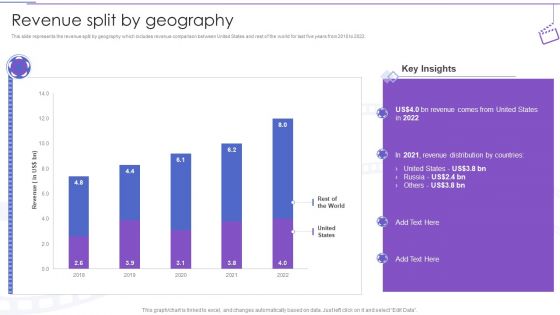
Film Making Company Outline Revenue Split By Geography Ppt PowerPoint Presentation Professional Graphic Images PDF
This slide represents the revenue split by geography which includes revenue comparison between United States and rest of the world for last five years from 2018 to 2022.Deliver and pitch your topic in the best possible manner with this Film Making Company Outline Revenue Split By Geography Ppt PowerPoint Presentation Professional Graphic Images PDF. Use them to share invaluable insights on United States, Revenue Distribution, Revenue Comes and impress your audience. This template can be altered and modified as per your expectations. So, grab it now.
-
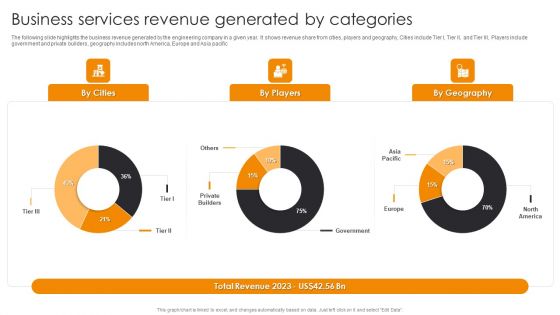
Business Services Revenue Generated By Categories Engineering Company Financial Analysis Report Graphics PDF
The following slide highlights the business revenue generated by the engineering company in a given year. It shows revenue share from cities, players and geography, Cities include Tier I, Tier II, and Tier III, Players include government and private builders, geography includes north America, Europe and Asia pacific.If you are looking for a format to display your unique thoughts, then the professionally designed Business Services Revenue Generated By Categories Engineering Company Financial Analysis Report Graphics PDF is the one for you. You can use it as a Google Slides template or a PowerPoint template. Incorporate impressive visuals, symbols, images, and other charts. Modify or reorganize the text boxes as you desire. Experiment with shade schemes and font pairings. Alter, share or cooperate with other people on your work. Download Business Services Revenue Generated By Categories Engineering Company Financial Analysis Report Graphics PDF and find out how to give a successful presentation. Present a perfect display to your team and make your presentation unforgettable.
-
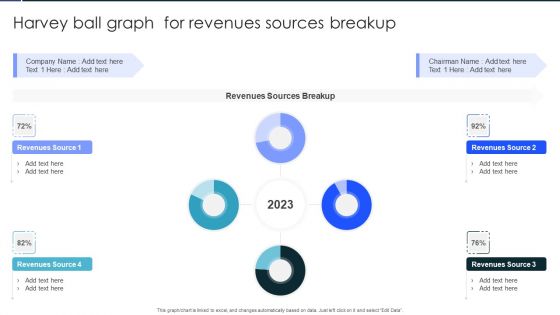
Harvey Ball Graph For Revenues Sources Breakup Infographics PDF
Showcasing this set of slides titled Harvey Ball Graph For Revenues Sources Breakup Infographics PDF. The topics addressed in these templates are Revenues Sources Breakup, Revenues, Sources Breakup. All the content presented in this PPT design is completely editable. Download it and make adjustments in color, background, font etc. as per your unique business setting.
-
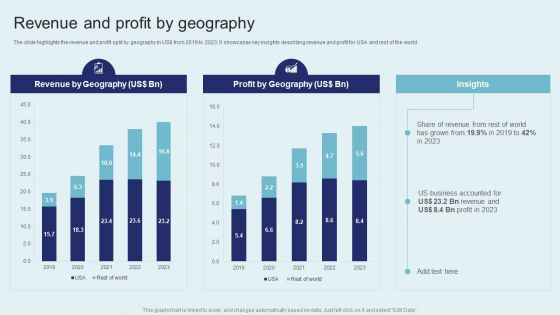
IT Firm Financial Statement Revenue And Profit By Geography Graphics PDF
The slide highlights the revenue and profit split by geography in US dollar from 2019 to 2023. It showcases key insights describing revenue and profit for USA and rest of the world. Present like a pro with IT Firm Financial Statement Revenue And Profit By Geography Graphics PDF Create beautiful presentations together with your team, using our easy to use presentation slides. Share your ideas in real time and make changes on the fly by downloading our templates. So whether you are in the office, on the go, or in a remote location, you can stay in sync with your team and present your ideas with confidence. With Slidegeeks presentation got a whole lot easier. Grab these presentations today.
-
Brand Extension Positioning Example Projected Sales Revenue Graphics PDF
This slide displays informational statistics about the firms expected sales revenue based on its brand extension strategy. It also implies that sales revenue will rise month after month.Explore a selection of the finest Brand Extension Positioning Example Projected Sales Revenue Graphics PDF here. With a plethora of professionally designed and pre-made slide templates, you can quickly and easily find the right one for your upcoming presentation. You can use our Brand Extension Positioning Example Projected Sales Revenue Graphics PDF to effectively convey your message to a wider audience. Slidegeeks has done a lot of research before preparing these presentation templates. The content can be personalized and the slides are highly editable. Grab templates today from Slidegeeks.
-
Business Revenue Bar Graph With Business Operational Expenditure Details Summary PDF
This slide represents business revenue bar graph with OPEX details which can be referred by companies to earn more revenue by controlling expenditures. It also provides information about marketing and sales, research and development, administration, total revenue, etc. Pitch your topic with ease and precision using this Business Revenue Bar Graph With Business Operational Expenditure Details Summary PDF. This layout presents information on Cost Of Marketing, Sales, Highest Amount. It is also available for immediate download and adjustment. So, changes can be made in the color, design, graphics or any other component to create a unique layout.
-
Corporate Financial Summary Report For Revenue Statement Ppt Ideas Graphic Images
This slide represents corporate financial statement snapshot. It includes income statement, profit, profit and loss trend, expenditure, revenue etc that enables organization to showcase cost incurred. Showcasing this set of slides titled Corporate Financial Summary Report For Revenue Statement Ppt Ideas Graphic Images. The topics addressed in these templates are Income Statement, Net Profit, Expenditure. All the content presented in this PPT design is completely editable. Download it and make adjustments in color, background, font etc. as per your unique business setting.
-
Sales Revenue Comparison Stacked Bar Graph Mockup PDF
This slide shows revenue comparison chart of product sales in various companies to understand profitability of business. It includes companies and revenues. Showcasing this set of slides titled Sales Revenue Comparison Stacked Bar Graph Mockup PDF. The topics addressed in these templates are Sales Revenue Comparison, Revenue From Clothing, Revenue From Equipment. All the content presented in this PPT design is completely editable. Download it and make adjustments in color, background, font etc. as per your unique business setting.
-
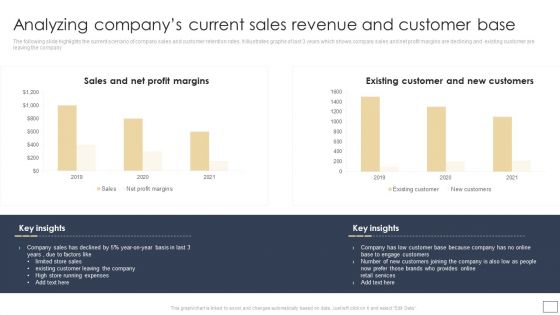
Analyzing Companys Current Sales Revenue And Customer Base Graphics PDF
The following slide highlights the current scenario of company sales and customer retention rates. It illustrates graphs of last 3 years which shows company sales and net profit margins are declining and existing customer are leaving the company.Here you can discover an assortment of the finest PowerPoint and Google Slides templates. With these templates, you can create presentations for a variety of purposes while simultaneously providing your audience with an eye-catching visual experience. Download Analyzing Companys Current Sales Revenue And Customer Base Graphics PDF to deliver an impeccable presentation. These templates will make your job of preparing presentations much quicker, yet still, maintain a high level of quality. Slidegeeks has experienced researchers who prepare these templates and write high-quality content for you. Later on, you can personalize the content by editing the Analyzing Companys Current Sales Revenue And Customer Base Graphics PDF.
-
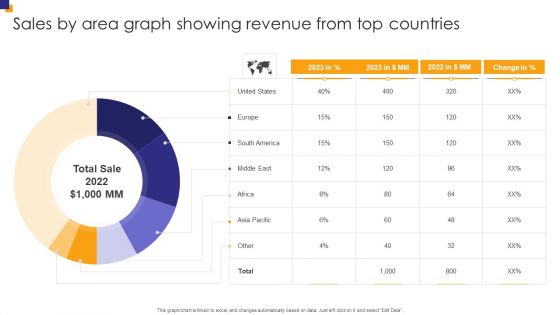
Sales By Area Graph Showing Revenue From Top Countries Inspiration PDF
Showcasing this set of slides titled Sales By Area Graph Showing Revenue From Top Countries Inspiration PDF. The topics addressed in these templates are Sales Area, Graph Showing, Revenue Countries. All the content presented in this PPT design is completely editable. Download it and make adjustments in color, background, font etc. as per your unique business setting.
-
6 Months Company Revenue Comparison Dashboard Graphics PDF
This slide showcases the half yearly profit comparison dashboard. It also includes comparison kp is such as monthly profit, profit margin growth, branch profit percentage, top 3 profitable products, etc. Showcasing this set of slides titled 6 Months Company Revenue Comparison Dashboard Graphics PDF. The topics addressed in these templates are Growth Rate, Overall Profit Margin, Branch Profit. All the content presented in this PPT design is completely editable. Download it and make adjustments in color, background, font etc. as per your unique business setting.
-
Digital Products Company Outline Company Historic Revenue Graphics PDF
The slide shows annual revenue growth of the company with the CAGR for last five financial years from 2018 to 2022. It also highlights year on year growth along with key insights. Presenting this PowerPoint presentation, titled Digital Products Company Outline Company Historic Revenue Graphics PDF, with topics curated by our researchers after extensive research. This editable presentation is available for immediate download and provides attractive features when used. Download now and captivate your audience. Presenting this Digital Products Company Outline Company Historic Revenue Graphics PDF. Our researchers have carefully researched and created these slides with all aspects taken into consideration. This is a completely customizable Digital Products Company Outline Company Historic Revenue Graphics PDF that is available for immediate downloading. Download now and make an impact on your audience. Highlight the attractive features available with our PPTs.
-
Equity Funding And Debt Financing Pitchbook Major Client And Total Revenue Graphics PDF
The slide provides a list of companys clients in different sectors manufacturing, construction, financials services, energy. Mining, automobile etc. along with the total revenue from each sector. Make sure to capture your audiences attention in your business displays with our gratis customizable Equity Funding And Debt Financing Pitchbook Major Client And Total Revenue Graphics PDF. These are great for business strategies, office conferences, capital raising or task suggestions. If you desire to acquire more customers for your tech business and ensure they stay satisfied, create your own sales presentation with these plain slides.
-
Insurance Business Financial Analysis Historical Revenue Ppt Styles Graphics PDF
The slide showcases company revenue for last five years along with yearly on year growth. It also depicts CAGR and key insights for revenue analysis. Crafting an eye-catching presentation has never been more straightforward. Let your presentation shine with this tasteful yet straightforward Insurance Business Financial Analysis Historical Revenue Ppt Styles Graphics PDF template. It offers a minimalistic and classy look that is great for making a statement. The colors have been employed intelligently to add a bit of playfulness while still remaining professional. Construct the ideal Insurance Business Financial Analysis Historical Revenue Ppt Styles Graphics PDF that effortlessly grabs the attention of your audience Begin now and be certain to wow your customers.
-
Strategic Organization Evaluation Of Geography Wise Revenue Split Ppt File Graphics Download PDF
This slide showcases strategic review of income earned from various business locations to help company formulate appropriate expansion strategies. It further includes information about percentage share of each country in total revenue. Showcasing this set of slides titled Strategic Organization Evaluation Of Geography Wise Revenue Split Ppt File Graphics Download PDF. The topics addressed in these templates are Total Revenue 2023, Key Analysis, FY 22 Revenue, FY 23 Revenue. All the content presented in this PPT design is completely editable. Download it and make adjustments in color, background, font etc. as per your unique business setting.
-
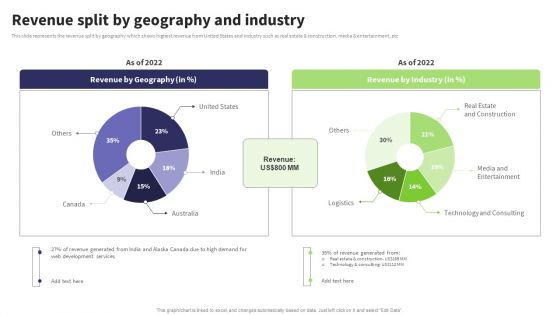
Website Design And Development Services Company Profile Revenue Split By Geography Graphics PDF
This slide represents the revenue split by geography which shows highest revenue from United States and industry such as real estate and construction, media and entertainment, etc. Do you have to make sure that everyone on your team knows about any specific topic I yes, then you should give Website Design And Development Services Company Profile Revenue Split By Geography Graphics PDF a try. Our experts have put a lot of knowledge and effort into creating this impeccable Website Design And Development Services Company Profile Revenue Split By Geography Graphics PDF. You can use this template for your upcoming presentations, as the slides are perfect to represent even the tiniest detail. You can download these templates from the Slidegeeks website and these are easy to edit. So grab these today.
-
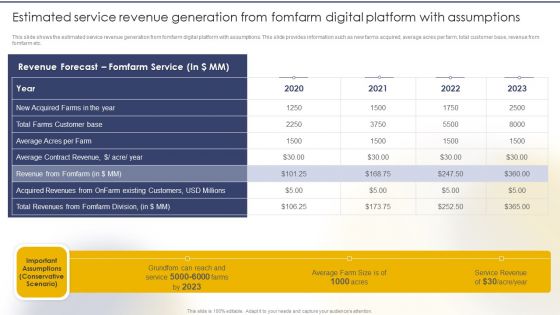
Estimated Service Revenue Generation From Fomfarm Digital Platform With Assumptions Graphics PDF
This slide shows the estimated service revenue generation from fomfarm digital platform with assumptions. This slide provides information such as new farms acquired, average acres per farm, total customer base, revenue from fomfarm etc.Deliver and pitch your topic in the best possible manner with this Estimated Service Revenue Generation From Fomfarm Digital Platform With Assumptions Graphics PDF. Use them to share invaluable insights on Revenue Forecast, Fomfarm Service, Acquired Revenues and impress your audience. This template can be altered and modified as per your expectations. So, grab it now.
-
Data Valuation And Monetization Assessing Data Monetization Revenue Model And Suitability Graphics PDF
This slide covers details about analysis of different monetization revenue model and crucial success factors associated to such models. Firm can choose the monetization model based on its suitability. Deliver an awe inspiring pitch with this creative Data Valuation And Monetization Assessing Data Monetization Revenue Model And Suitability Graphics PDF bundle. Topics like Hardware Premium, Service Revenue, Data Revenue can be discussed with this completely editable template. It is available for immediate download depending on the needs and requirements of the user.
-
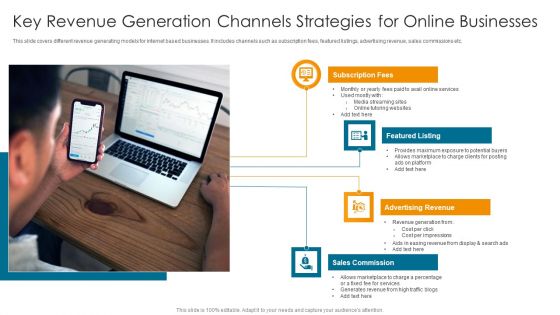
Key Revenue Generation Channels Strategies For Online Businesses Graphics PDF
This slide covers different revenue generating models for internet based businesses. It includes channels such as subscription fees, featured listings, advertising revenue, sales commissions etc.Persuade your audience using this Key Revenue Generation Channels Strategies For Online Businesses Graphics PDF. This PPT design covers four stages, thus making it a great tool to use. It also caters to a variety of topics including Featured Listing, Advertising Revenue, Sales Commission. Download this PPT design now to present a convincing pitch that not only emphasizes the topic but also showcases your presentation skills.
-
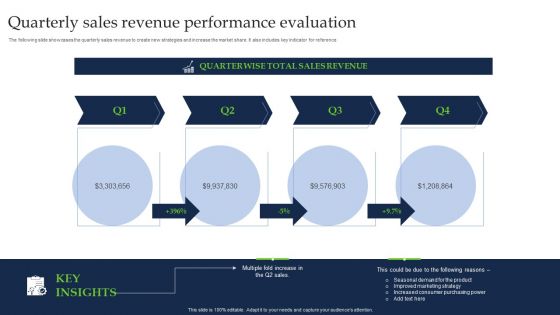
Quarterly Sales Revenue Performance Evaluation Graphics PDF
Persuade your audience using this Quarterly Sales Revenue Performance Evaluation Graphics PDF. This PPT design covers four stages, thus making it a great tool to use. It also caters to a variety of topics including Improved Marketing Strategy, Increased Consumer Purchasing, Seasonal Demand. Download this PPT design now to present a convincing pitch that not only emphasizes the topic but also showcases your presentation skills.
-
5 Year Financial Forecast Strategy With Users And Revenue Ppt PowerPoint Presentation Show Graphics Download PDF
This slide includes financial plan of five years to identify, describe and analyze business opportunities. It further includes users, revenues, operating cost, total cost and net income.Pitch your topic with ease and precision using this 5 Year Financial Forecast Strategy With Users And Revenue Ppt PowerPoint Presentation Show Graphics Download PDF. This layout presents information on Research Development, Sales Marketing, Business Specific. It is also available for immediate download and adjustment. So, changes can be made in the color, design, graphics or any other component to create a unique layout.
-
Automobile Business Digital Evolution With Revenue And Unit Sold Graphics PDF
This slide represent evolution in the market of auto mobile industry with continuous growth in revenue and production. It consists figures from before 2002 to 2021 onwards. Persuade your audience using this Automobile Business Digital Evolution With Revenue And Unit Sold Graphics PDF. This PPT design covers four stages, thus making it a great tool to use. It also caters to a variety of topics including Market, Manufacture, Global Identity. Download this PPT design now to present a convincing pitch that not only emphasizes the topic but also showcases your presentation skills.
-
Effective Company Event Communication Tactics Dashboard For Tracking Event Revenue And Registrations Graphics PDF
This slide covers metrics for analyzing the event revenue and registrations. It includes KPIs such as gross revenue, gross revenue from promos, total refund, total registration, visits to purchase conversion, check-in- status, etc. Deliver and pitch your topic in the best possible manner with this Effective Company Event Communication Tactics Dashboard For Tracking Event Revenue And Registrations Graphics PDF. Use them to share invaluable insights on Gross Revenue, Registration Analysis, Purchase Conversion and impress your audience. This template can be altered and modified as per your expectations. So, grab it now.
-
Product Launch Time Relationship With Cost And Revenue Ppt Graphics PDF
The following slide highlights the time to market relationship with cost and revenue illustrating graphical representation of shorter time to market and longer time to market impact on cost, revenue and market establishment. Pitch your topic with ease and precision using this Product Launch Time Relationship With Cost And Revenue Ppt Graphics PDF. This layout presents information on Product Launch, Market Cost, Establish Market. It is also available for immediate download and adjustment. So, changes can be made in the color, design, graphics or any other component to create a unique layout.
-
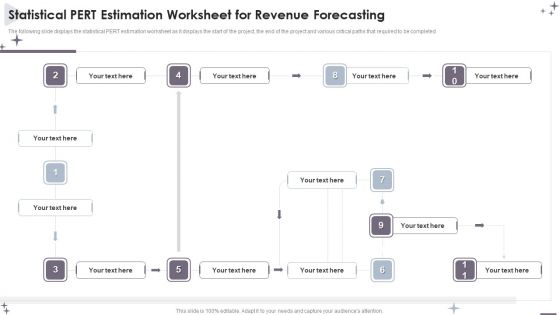
Project Administration Bundle Statistical PERT Estimation Worksheet For Revenue Forecasting Graphics PDF
The following slide displays the statistical PERT estimation worksheet as it displays the start of the project, the end of the project and various critical paths that required to be completed. Deliver an awe inspiring pitch with this creative Project Administration Bundle Statistical PERT Estimation Worksheet For Revenue Forecasting Graphics PDF bundle. Topics like Revenue Forecasting, Estimation Worksheet can be discussed with this completely editable template. It is available for immediate download depending on the needs and requirements of the user.
-
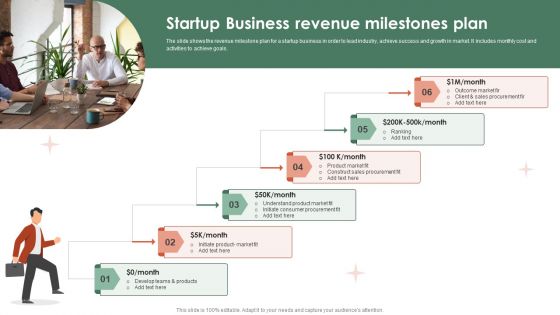
Startup Business Revenue Milestones Plan Ppt Layouts Graphics Template PDF
The slide shows the revenue milestone plan for a startup business in order to lead industry, achieve success and growth in market. It includes monthly cost and activities to achieve goals. Persuade your audience using this Startup Business Revenue Milestones Plan Ppt Layouts Graphics Template PDF. This PPT design covers six stages, thus making it a great tool to use. It also caters to a variety of topics including Outcome Market, Product Market Fit, Initiate Product. Download this PPT design now to present a convincing pitch that not only emphasizes the topic but also showcases your presentation skills.
-
CRM Pipeline Administration How To Earn Bigger Revenue And Profits Graphics PDF
This slide provides information regarding how sales department will be able to incur bigger revenue and profits by catering more deals, higher conversion, etc. Are you searching for a CRM Pipeline Administration How To Earn Bigger Revenue And Profits Graphics PDF that is uncluttered, straightforward, and original Its easy to edit, and you can change the colors to suit your personal or business branding. For a presentation that expresses how much effort youve put in, this template is ideal With all of its features, including tables, diagrams, statistics, and lists, its perfect for a business plan presentation. Make your ideas more appealing with these professional slides. Download CRM Pipeline Administration How To Earn Bigger Revenue And Profits Graphics PDF from Slidegeeks today.
-
Selling Forecasts Revenue Report Icon Graphics PDF
Persuade your audience using this Selling Forecasts Revenue Report Icon Graphics PDF. This PPT design covers three stages, thus making it a great tool to use. It also caters to a variety of topics including Selling Forecasts, Revenue Report Icon. Download this PPT design now to present a convincing pitch that not only emphasizes the topic but also showcases your presentation skills.
-
Gross Revenue Margin Comparison Graph Icon Clipart PDF
Persuade your audience using this Gross Revenue Margin Comparison Graph Icon Clipart PDF. This PPT design covers three stages, thus making it a great tool to use. It also caters to a variety of topics including Gross Revenue Margin, Comparison Graph Icon. Download this PPT design now to present a convincing pitch that not only emphasizes the topic but also showcases your presentation skills.
-
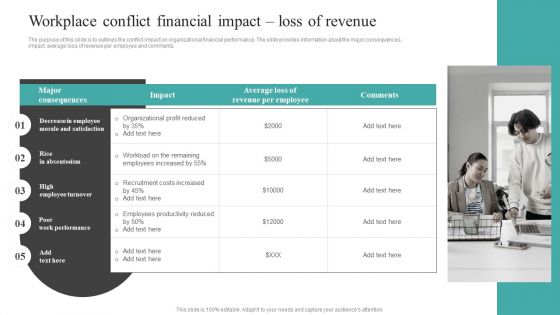
Common Conflict Situations Workplace Conflict Financial Impact Loss Of Revenue Graphics PDF
The purpose of this slide is to outlines the conflict impact on organizational financial performance. The slide provides information about the major consequences, impact, average loss of revenue per employee and comments. Want to ace your presentation in front of a live audience Our Common Conflict Situations Workplace Conflict Financial Impact Loss Of Revenue Graphics PDF can help you do that by engaging all the users towards you. Slidegeeks experts have put their efforts and expertise into creating these impeccable powerpoint presentations so that you can communicate your ideas clearly. Moreover, all the templates are customizable, and easy-to-edit and downloadable. Use these for both personal and commercial use.
-
Data Monetization And Management Assessing Data Monetization Revenue Model Graphics PDF
This slide covers details about analysis of different monetization revenue model and crucial success factors associated to such models. Firm can choose the monetization model based on its suitability. Create an editable Data Monetization And Management Assessing Data Monetization Revenue Model Graphics PDF that communicates your idea and engages your audience. Whether youre presenting a business or an educational presentation, pre-designed presentation templates help save time. Data Monetization And Management Assessing Data Monetization Revenue Model Graphics PDF is highly customizable and very easy to edit, covering many different styles from creative to business presentations. Slidegeeks has creative team members who have crafted amazing templates. So, go and get them without any delay.
-
Agenda For Membership Based Revenue Plan Graphics PDF
Find a pre-designed and impeccable Agenda For Membership Based Revenue Plan Graphics PDF. The templates can ace your presentation without additional effort. You can download these easy-to-edit presentation templates to make your presentation stand out from others. So, what are you waiting for Download the template from Slidegeeks today and give a unique touch to your presentation.


