Revenue dashboard PowerPoint Presentation Templates and Google Slides
-
Online Merchandising Techniques Enhance Conversion Rate Digital Marketing Dashboard With Conversions And Revenue Growth Rate Elements PDF
Deliver and pitch your topic in the best possible manner with this online merchandising techniques enhance conversion rate digital marketing dashboard with conversions and revenue growth rate elements pdf. Use them to share invaluable insights on social media, website performance, conversion funnel, traffic sources and impress your audience. This template can be altered and modified as per your expectations. So, grab it now.
-
How Make Impactful Product Marketing Message Build Product Differentiation Product Performance Dashboard With Total Revenues Information PDF
The following slide displays a brand awareness dashboard as it highlights the key metrics for measuring brand awareness such as brand search, social media searches, links, brand and mentions. Deliver and pitch your topic in the best possible manner with this how make impactful product marketing message build product differentiation product performance dashboard with total revenues information pdf. Use them to share invaluable insights on social, organic, performance, traffic and impress your audience. This template can be altered and modified as per your expectations. So, grab it now.
-
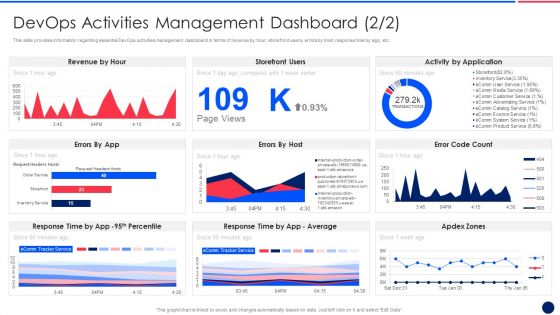
Key Components Critical To Devops Viability IT Devops Activities Management Dashboard Revenue Ideas PDF
This slide provides information regarding essential DevOps activities management dashboard in terms of revenue by hour, storefront users, errors by host, response time by app, etc. Deliver an awe inspiring pitch with this creative key components critical to devops viability it devops activities management dashboard revenue ideas pdf bundle. Topics like revenue by hour, storefront users, errors by host, response time by app can be discussed with this completely editable template. It is available for immediate download depending on the needs and requirements of the user.
-
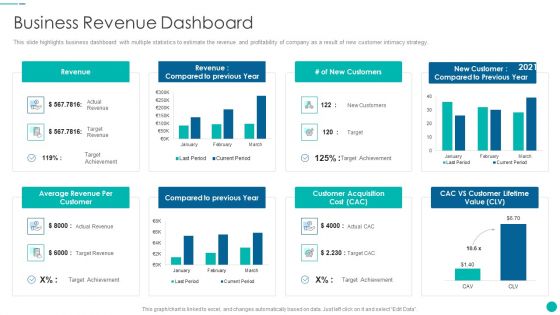
Tactical Procedure For Increasing Customer Intimacy Business Revenue Dashboard Diagrams PDF
This slide highlights business dashboard with multiple statistics to estimate the revenue and profitability of company as a result of new customer intimacy strategy. Deliver an awe inspiring pitch with this creative tactical procedure for increasing customer intimacy business revenue dashboard diagrams pdf bundle. Topics like average revenue per customer, compared to previous year, customer acquisition cost, cac vs customer lifetime value, revenue can be discussed with this completely editable template. It is available for immediate download depending on the needs and requirements of the user.
-
Omnichannel Marketing Dashboard With Revenue And Total Spend Formats PDF
This slide shows an Omnichannel Marketing Dashboard with marketing spend by channel, total spend, revenue, total impressions, cost per impression, weekly social media engagement by channel etc. Deliver and pitch your topic in the best possible manner with this omnichannel marketing dashboard with revenue and total spend formats pdf. Use them to share invaluable insights on revenue, impressions, marketing and impress your audience. This template can be altered and modified as per your expectations. So, grab it now.
-
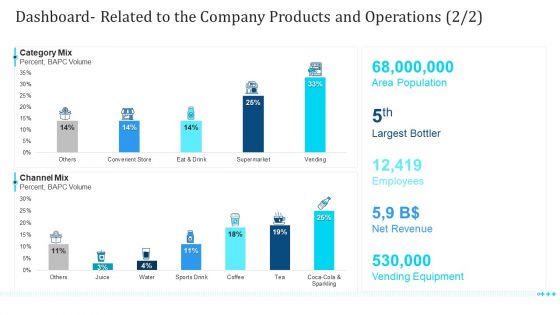
Dashboard Related To The Company Products And Operations Revenue Ppt Portfolio Deck PDF
Deliver and pitch your topic in the best possible manner with this dashboard related to the company products and operations revenue ppt portfolio deck pdf. Use them to share invaluable insights on dashboard related to the company products and operations and impress your audience. This template can be altered and modified as per your expectations. So, grab it now.
-
Customer Relationship Management Dashboard Revenue Background PDF
This slide covers the competitive analysis of different partner relationship management software which are compared based on features ratings and software prices. Deliver and pitch your topic in the best possible manner with this customer relationship management dashboard revenue background pdf. Use them to share invaluable insights on supply chain planning, fulfillment management, transportation management, inventory management and impress your audience. This template can be altered and modified as per your expectations. So, grab it now.
-
Customer Relationship Management Marketing Dashboard With Revenue Graph And Deals Funnel Ideas PDF
The following slides highlights the CRM marketing dashboard with provides key details about new contacts, campaign email sent, revenue graph and worth of new deals. Showcasing this set of slides titled customer relationship management marketing dashboard with revenue graph and deals funnel ideas pdf. The topics addressed in these templates are funnel, revenue graph, campaign. All the content presented in this PPT design is completely editable. Download it and make adjustments in color, background, font etc. as per your unique business setting.
-
Customer Relationship Strategy For Building Loyalty Business Revenue Dashboard Icons PDF
This slide highlights business dashboard with multiple statistics to estimate the revenue and profitability of company as a result of new customer intimacy strategy. Deliver an awe inspiring pitch with this creative customer relationship strategy for building loyalty business revenue dashboard icons pdf bundle. Topics like average revenue per customer, compared to previous year, customer acquisition cost, cac vs customer lifetime value, revenue can be discussed with this completely editable template. It is available for immediate download depending on the needs and requirements of the user.
-
Business Management Dashboards Revenue Ppt Layouts Gridlines PDF
Deliver an awe inspiring pitch with this creative business management dashboards revenue ppt layouts gridlines pdf bundle. Topics like revenue, manufacturing, costs, products can be discussed with this completely editable template. It is available for immediate download depending on the needs and requirements of the user.
-
Dashboard Related To The Company Products And Operations Revenue Rules PDF
Deliver and pitch your topic in the best possible manner with this dashboard related to the company products and operations revenue rules pdf. Use them to share invaluable insights on area population, largest bottler, employees, net revenue, vending equipment and impress your audience. This template can be altered and modified as per your expectations. So, grab it now.
-
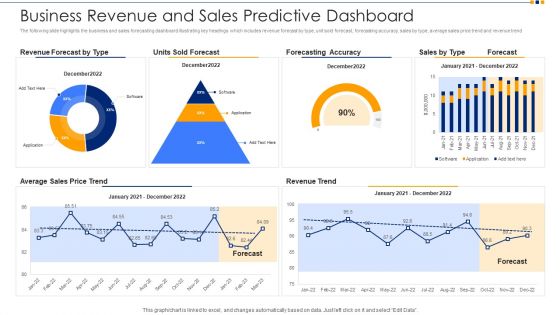
Business Revenue And Sales Predictive Dashboard Ppt Inspiration Background Designs PDF
The following slide highlights the business and sales forecasting dashboard illustrating key headings which includes revenue forecast by type, unit sold forecast, forecasting accuracy, sales by type, average sales price trend and revenue trend. Pitch your topic with ease and precision using this business revenue and sales predictive dashboard ppt inspiration background designs pdf. This layout presents information on revenue forecast by type, units sold forecast, forecasting accuracy, average sales price trend, revenue trend. It is also available for immediate download and adjustment. So, changes can be made in the color, design, graphics or any other component to create a unique layout.
-
Company Performance Dashboard With Quarterly Revenue Download PDF
This slide showcases the quarterly organizational performance dashboard. It include campaign performance, acquisitions by campaign and sales performance. Showcasing this set of slides titled company performance dashboard with quarterly revenue download pdf. The topics addressed in these templates are marketing, performance. All the content presented in this PPT design is completely editable. Download it and make adjustments in color, background, font etc. as per your unique business setting.
-
Company Performance Dashboard With Weekly Sales Revenue Structure PDF
This slide showcases the dashboard of financial organizational performance. It include average revenue per unit, customer lifetime value etc. Showcasing this set of slides titled company performance dashboard with weekly sales revenue structure pdf. The topics addressed in these templates are company performance dashboard with weekly sales revenue. All the content presented in this PPT design is completely editable. Download it and make adjustments in color, background, font etc. as per your unique business setting.
-
Revenue And Customer Acquisition Analysis Strategic Administration Dashboard Clipart PDF
This slide shows the dashboard representing analysis of the revenue and customers acquired by the organization. It shows comparison between current and previous year revenue and customer acquisition.Pitch your topic with ease and precision using this Revenue And Customer Acquisition Analysis Strategic Administration Dashboard Clipart PDF This layout presents information on Revenue Customer, Compared Previous, Customer Acquisition It is also available for immediate download and adjustment. So, changes can be made in the color, design, graphics or any other component to create a unique layout.
-
Finance Metrics Dashboard Indicating Product And Service Revenue Designs PDF
This graph or chart is linked to excel, and changes automatically based on data. Just left click on it and select edit data. Showcasing this set of slides titled Finance Metrics Dashboard Indicating Product And Service Revenue Designs PDF. The topics addressed in these templates are Maintenance Revenue Product, Revenue Product Revenues, Service Revenue Rolling. All the content presented in this PPT design is completely editable. Download it and make adjustments in color, background, font etc. as per your unique business setting.
-
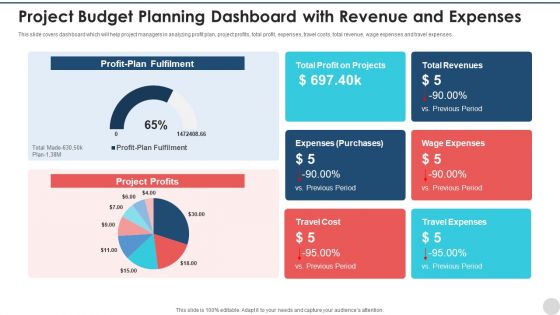
Project Budget Planning Dashboard With Revenue And Expenses Ideas PDF
This slide covers dashboard which will help project managers in analyzing profit plan, project profits, total profit, expenses, travel costs, total revenue, wage expenses and travel expenses. Showcasing this set of slides titled project budget planning dashboard with revenue and expenses ideas pdf. The topics addressed in these templates are project budget planning dashboard with revenue and expenses. All the content presented in this PPT design is completely editable. Download it and make adjustments in color, background, font etc. as per your unique business setting.
-
Sustainability Calculation With KPI Customer Service Dashboard Revenue Ideas PDF Graphics PDF
Following slide illustrates customer service dashboard covering details such as request answered, total requests, total revenue and support cost revenue. It also includes customer satisfaction score, customer retention in a 12 months format. Deliver and pitch your topic in the best possible manner with this sustainability calculation with kpi customer service dashboard microsoft pdf. Use them to share invaluable insights on customer satisfaction, revenue, customer retention and impress your audience. This template can be altered and modified as per your expectations. So, grab it now.
-
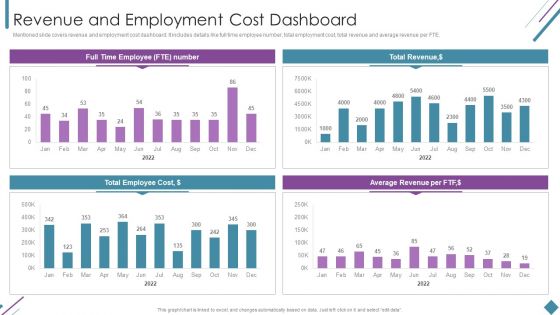
Sustainability Calculation With KPI Revenue And Employment Cost Dashboard Introduction PDF Professional PDF
Mentioned slide covers revenue and employment cost dashboard. It includes details like full time employee number, total employment cost, total revenue and average revenue per FTE. Deliver an awe inspiring pitch with this creative sustainability calculation with kpi revenue and employment cost dashboard introduction pdf bundle. Topics like full time employee, employee cost, revenue can be discussed with this completely editable template. It is available for immediate download depending on the needs and requirements of the user.
-
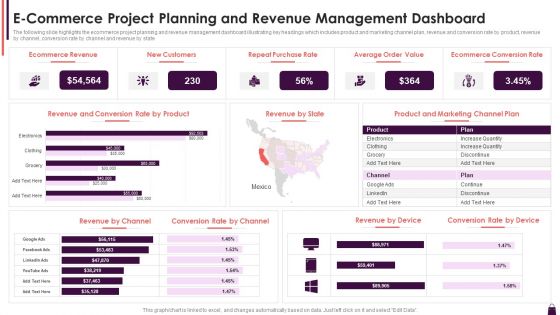
E Commerce Project Planning And Revenue Management Dashboard Introduction PDF
The following slide highlights the ecommerce project planning and revenue management dashboard illustrating key headings which includes product and marketing channel plan, revenue and conversion rate by product, revenue by channel, conversion rate by channel and revenue by state. Showcasing this set of slides titled E Commerce Project Planning And Revenue Management Dashboard Introduction PDF. The topics addressed in these templates are New Customers, Ecommerce Revenue, Repeat Purchase Rate. All the content presented in this PPT design is completely editable. Download it and make adjustments in color, background, font etc. as per your unique business setting.
-
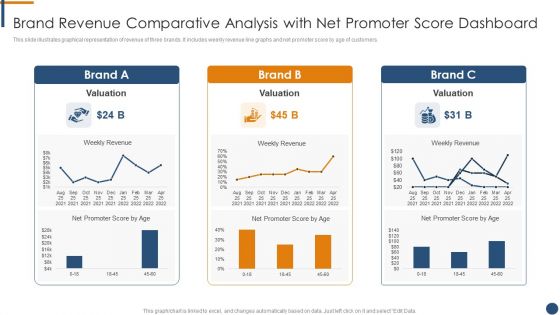
Brand Revenue Comparative Analysis With Net Promoter Score Dashboard Mockup PDF
This slide illustrates graphical representation of revenue of three brands. It includes weekly revenue line graphs and net promoter score by age of customers.Pitch your topic with ease and precision using this Brand Revenue Comparative Analysis With Net Promoter Score Dashboard Mockup PDF. This layout presents information on Brand Revenue Comparative Analysis With Net Promoter Score Dashboard. It is also available for immediate download and adjustment. So, changes can be made in the color, design, graphics or any other component to create a unique layout.
-
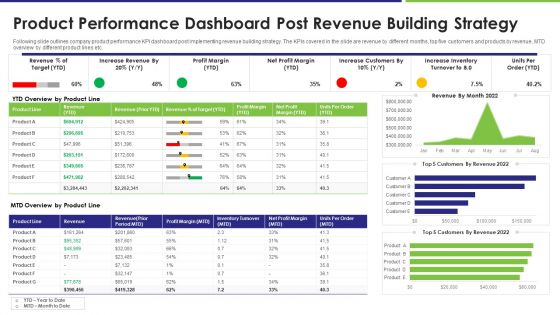
Product Performance Dashboard Post Revenue Building Strategy Brochure PDF
Following slide outlines company product performance KPI dashboard post implementing revenue building strategy. The KPIs covered in the slide are revenue by different months, top five customers and products by revenue, MTD overview by different product lines etc. Showcasing this set of slides titled product performance dashboard post revenue building strategy brochure pdf. The topics addressed in these templates are revenue, target, profit margin. All the content presented in this PPT design is completely editable. Download it and make adjustments in color, background, font etc. as per your unique business setting.
-
Revenue Analysis KPI Dashboard Post Building Marketing Strategy Infographics PDF
Following slide outlines a revenue analysis dashboard showcasing the business results after implementing marketing strategy. It provides information about total revenue for the month, revenue for year to date, revenue trend, product revenue and services revenue etc. Pitch your topic with ease and precision using this revenue analysis kpi dashboard post building marketing strategy infographics pdf. This layout presents information on revenue analysis kpi dashboard post building marketing strategy. It is also available for immediate download and adjustment. So, changes can be made in the color, design, graphics or any other component to create a unique layout.
-
Customer Rapport Strategy To Build Loyal Client Base Business Revenue Dashboard Elements PDF
This slide highlights business dashboard with multiple statistics to estimate the revenue and profitability of company as a result of new customer intimacy strategy. Deliver and pitch your topic in the best possible manner with this customer rapport strategy to build loyal client base business revenue dashboard elements pdf. Use them to share invaluable insights on revenue, previous year, customer and impress your audience. This template can be altered and modified as per your expectations. So, grab it now.
-
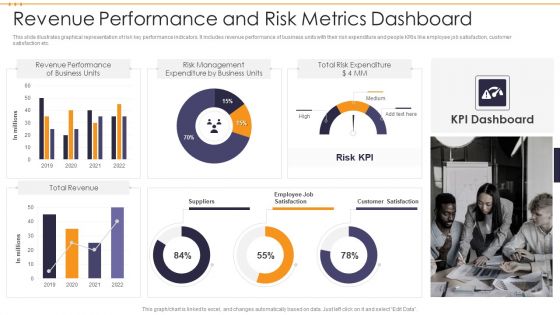
Revenue Performance And Risk Metrics Dashboard Demonstration PDF
This slide illustrates graphical representation of risk key performance indicators. It includes revenue performance of business units with their risk expenditure and people KRIs like employee job satisfaction, customer satisfaction etc. Showcasing this set of slides titled Revenue Performance And Risk Metrics Dashboard Demonstration PDF. The topics addressed in these templates are Total Risk Expenditure, Risk Management, Revenue Performance . All the content presented in this PPT design is completely editable. Download it and make adjustments in color, background, font etc. as per your unique business setting.
-
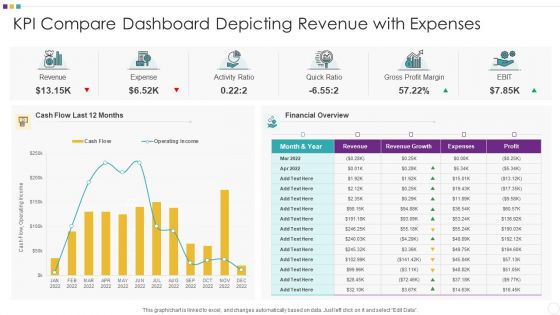
KPI Compare Dashboard Depicting Revenue With Expenses Information PDF
Showcasing this set of slides titled KPI Compare Dashboard Depicting Revenue With Expenses Information PDF The topics addressed in these templates are KPI Compare Dashboard Depicting Revenue With Expenses All the content presented in this PPT design is completely editable. Download it and make adjustments in color, background, font etc. as per your unique business setting.
-
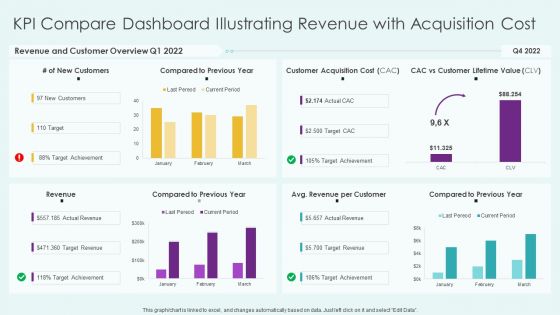
KPI Compare Dashboard Illustrating Revenue With Acquisition Cost Professional PDF
Showcasing this set of slides titled KPI Compare Dashboard Illustrating Revenue With Acquisition Cost Professional PDF The topics addressed in these templates are KPI Compare Dashboard Illustrating Revenue With Acquisition Cost All the content presented in this PPT design is completely editable. Download it and make adjustments in color, background, font etc. as per your unique business setting.
-
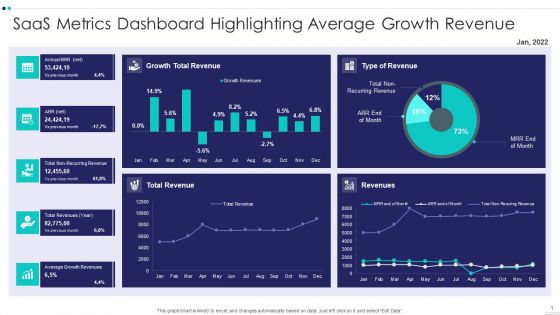
Saas Metrics Dashboard Highlighting Average Growth Revenue Diagrams PDF
Showcasing this set of slides titled Saas Metrics Dashboard Highlighting Average Growth Revenue Diagrams PDF The topics addressed in these templates are Saas Metrics Dashboard Highlighting Average Growth Revenue All the content presented in this PPT design is completely editable. Download it and make adjustments in color, background, font etc. as per your unique business setting.
-
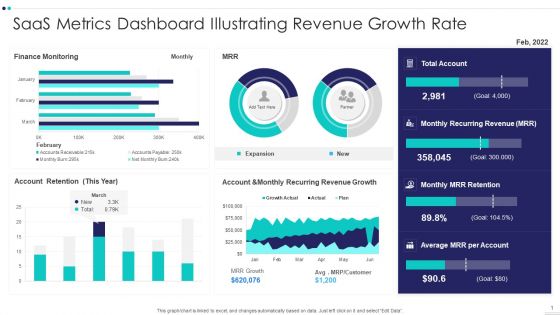
Saas Metrics Dashboard Illustrating Revenue Growth Rate Demonstration PDF
Showcasing this set of slides titled Saas Metrics Dashboard Illustrating Revenue Growth Rate Demonstration PDF The topics addressed in these templates are Saas Metrics Dashboard Illustrating Revenue Growth Rate All the content presented in this PPT design is completely editable. Download it and make adjustments in color, background, font etc. as per your unique business setting.
-
Saas Metrics Dashboard Indicating Net Monthly Recurring Revenue Information PDF
Showcasing this set of slides titled Saas Metrics Dashboard Indicating Net Monthly Recurring Revenue Information PDF The topics addressed in these templates are Saas Metrics Dashboard Indicating Net Monthly Recurring Revenue All the content presented in this PPT design is completely editable. Download it and make adjustments in color, background, font etc. as per your unique business setting.
-
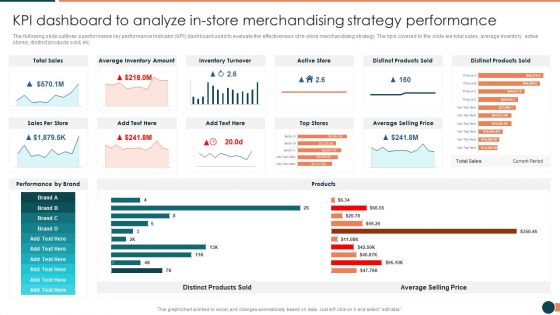
Developing Retail Marketing Strategies To Increase Revenue KPI Dashboard To Analyze Instore Information PDF
The following slide outlines a performance key performance indicator KPI dashboard used to evaluate the effectiveness of in store merchandising strategy. The kpis covered in the slide are total sales, average inventory, active stores, distinct products sold, etc.Deliver an awe inspiring pitch with this creative Developing Retail Marketing Strategies To Increase Revenue KPI Dashboard To Analyze Instore Information PDF bundle. Topics like Inventory Turnover, Distinct Products, Average Inventory can be discussed with this completely editable template. It is available for immediate download depending on the needs and requirements of the user.
-
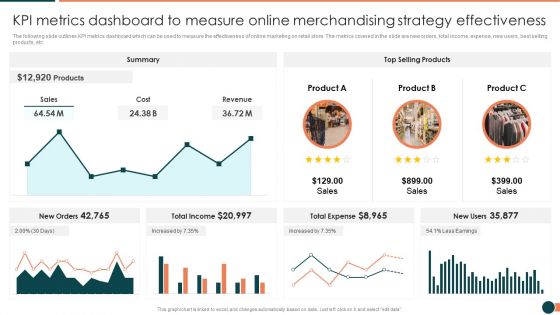
Developing Retail Marketing Strategies To Increase Revenue KPI Metrics Dashboard To Measure Online Portrait PDF
The following slide outlines KPI metrics dashboard which can be used to measure the effectiveness of online marketing on retail store. The metrics covered in the slide are new orders, total income, expense, new users, best selling products, etc.Deliver and pitch your topic in the best possible manner with this Developing Retail Marketing Strategies To Increase Revenue KPI Metrics Dashboard To Measure Online Portrait PDF Use them to share invaluable insights on Total Income, Total Expense, Summary and impress your audience. This template can be altered and modified as per your expectations. So, grab it now.
-
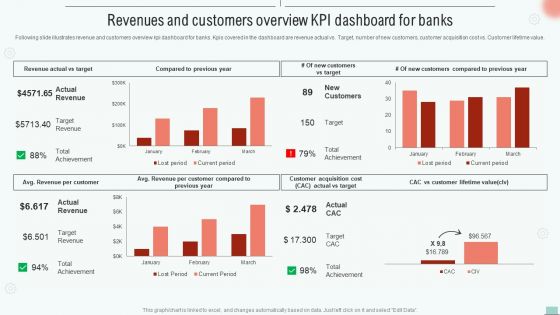
Implementing BPM Techniques Revenues And Customers Overview KPI Dashboard For Banks Microsoft PDF
Following slide illustrates revenue and customers overview kpi dashboard for banks. KPIs covered in the dashboard are revenue actual vs. target, number of new customers, customer acquisition cost vs. customer lifetime value. Deliver an awe inspiring pitch with this creative Implementing BPM Techniques Revenues And Customers Overview KPI Dashboard For Banks Microsoft PDF bundle. Topics like Target Revenue, Customers Compared, Customer Lifetime can be discussed with this completely editable template. It is available for immediate download depending on the needs and requirements of the user.
-
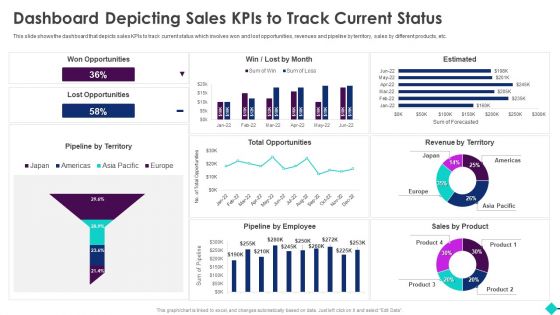
Sales Process Automation For Revenue Growth Dashboard Depicting Sales Kpis To Track Current Status Introduction PDF
This slide shows the dashboard that depicts sales KPIs to track current status which involves won and lost opportunities, revenues and pipeline by territory, sales by different products, etc.Deliver and pitch your topic in the best possible manner with this Sales Process Automation For Revenue Growth Dashboard Depicting Sales Kpis To Track Current Status Introduction PDF. Use them to share invaluable insights on Marketing Effectiveness, Forecast Accuracy, Pipeline Thickness and impress your audience. This template can be altered and modified as per your expectations. So, grab it now.
-
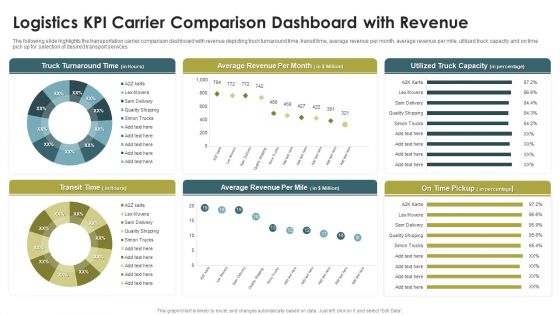
Logistics KPI Carrier Comparison Dashboard With Revenue Ppt Infographics Portfolio PDF
The following slide highlights the transportation carrier comparison dashboard with revenue depicting truck turnaround time, transit time, average revenue per month, average revenue per mile, utilized truck capacity and on time pick up for selection of desired transport services. Pitch your topic with ease and precision using this Logistics KPI Carrier Comparison Dashboard With Revenue Ppt Infographics Portfolio PDF. This layout presents information on Truck Turnaround Time, Average Revenue, Per Month, Transit Time. It is also available for immediate download and adjustment. So, changes can be made in the color, design, graphics or any other component to create a unique layout.
-
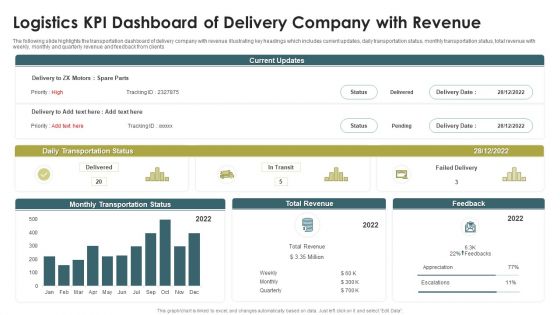
Logistics KPI Dashboard Of Delivery Company With Revenue Ppt Show PDF
The following slide highlights the transportation dashboard of delivery company with revenue illustrating key headings which includes current updates, daily transportation status, monthly transportation status, total revenue with weekly, monthly and quarterly revenue and feedback from clients. Showcasing this set of slides titled Logistics KPI Dashboard Of Delivery Company With Revenue Ppt Show PDF. The topics addressed in these templates are Daily Transportation Status, Monthly Transportation Status, Total Revenue. All the content presented in this PPT design is completely editable. Download it and make adjustments in color, background, font etc. as per your unique business setting.
-
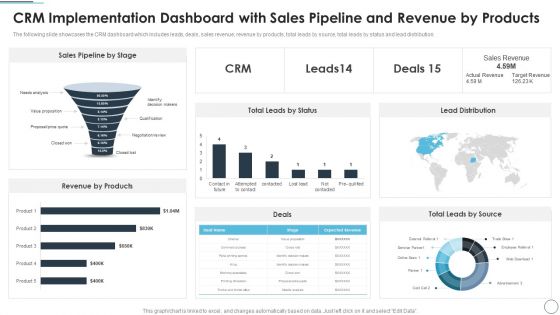
CRM Implementation Dashboard With Sales Pipeline And Revenue By Products Mockup PDF
The following slide showcases the CRM dashboard which includes leads, deals, sales revenue, revenue by products, total leads by source, total leads by status and lead distribution.Deliver an awe inspiring pitch with this creative CRM Implementation Dashboard With Sales Pipeline And Revenue By Products Mockup PDF bundle. Topics like Lead Distribution, Revenue By Products, Total Leads can be discussed with this completely editable template. It is available for immediate download depending on the needs and requirements of the user.
-
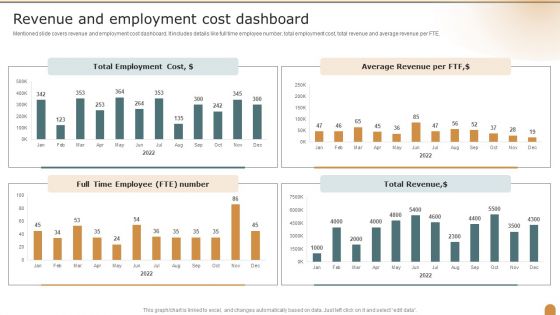
Revenue And Employment Cost Dashboard Company Performance Evaluation Using KPI Microsoft PDF
Mentioned slide covers revenue and employment cost dashboard. It includes details like full time employee number, total employment cost, total revenue and average revenue per FTE. Deliver and pitch your topic in the best possible manner with this Revenue And Employment Cost Dashboard Company Performance Evaluation Using KPI Microsoft PDF. Use them to share invaluable insights on Total Employment, Average Revenue, Dashboard and impress your audience. This template can be altered and modified as per your expectations. So, grab it now.
-
Gross Profit Margin Dashboard With Revenue Vs Expenses Icons PDF
This slide showcases dashboard that can help organization to evaluate the revenue generated and expenses incurred in conducting operations. It also showcases gross profit and margin of last financial year. Pitch your topic with ease and precision using this Gross Profit Margin Dashboard With Revenue Vs Expenses Icons PDF. This layout presents information on Gross Profit Margin, EBITDA Margin, Net Profit Margin. It is also available for immediate download and adjustment. So, changes can be made in the color, design, graphics or any other component to create a unique layout.
-
Competitive Sales Strategy Development Plan For Revenue Growth Dashboard Depicting Product Sales Kpis Elements PDF
This slide shows the dashboard that depicts product sales metrics which focuses on revenue generated from top products, incremental sales by campaign, cost of goods sold, etc. Deliver an awe inspiring pitch with this creative Competitive Sales Strategy Development Plan For Revenue Growth Dashboard Depicting Product Sales Kpis Elements PDF bundle. Topics like Incremental Sales, Cost, Store Purchases can be discussed with this completely editable template. It is available for immediate download depending on the needs and requirements of the user.
-
Content Marketing Freelance Metrics Dashboard With Revenue Generated Demonstration PDF
Showcasing this set of slides titled Content Marketing Freelance Metrics Dashboard With Revenue Generated Demonstration PDF. The topics addressed in these templates are Content Marketing, Freelance Metrics Dashboard, Revenue Generated. All the content presented in this PPT design is completely editable. Download it and make adjustments in color, background, font etc. as per your unique business setting.
-
Effective Company Event Communication Tactics Dashboard For Tracking Event Gross Revenue Introduction PDF
This slide covers metrics for analyzing gross revenue generated throughout the event. It includes a graphical and tabular representation of revenue generated via promo codes and tracking links. Deliver an awe inspiring pitch with this creative Effective Company Event Communication Tactics Dashboard For Tracking Event Gross Revenue Introduction PDF bundle. Topics like Discount Claimed, Gross Revenue, Codes Tracking can be discussed with this completely editable template. It is available for immediate download depending on the needs and requirements of the user.
-
Financial Procedure Dashboard Indicating Yearly Revenue Analysis Icons PDF
This slide illustrates finance process dashboard indicating yearly revenue analysis which contains gross profit margin, operating profit ratio, net profit, revenue and cost of goods sold cogs operating expenses, etc. It can be referred by company owners who can compare it with previous years performance and make related decisions for future. Showcasing this set of slides titled Financial Procedure Dashboard Indicating Yearly Revenue Analysis Icons PDF. The topics addressed in these templates are Operating Profit Percentage, Net Profit Percentage, Operating Profit Ratio. All the content presented in this PPT design is completely editable. Download it and make adjustments in color, background, font etc. as per your unique business setting.
-
Dashboard To Track Sales Revenue Growth And New Customer Acquisition Guidelines PDF
Showcasing this set of slides titled Dashboard To Track Sales Revenue Growth And New Customer Acquisition Guidelines PDF. The topics addressed in these templates are New Customer, Sales Revenue, Congrats Target. All the content presented in this PPT design is completely editable. Download it and make adjustments in color, background, font etc. as per your unique business setting.
-
Effective Company Event Communication Plan Dashboard For Tracking Event Gross Revenue Portrait PDF
This slide covers metrics for analyzing gross revenue generated throughout the event. It includes a graphical and tabular representation of revenue generated via promo codes and tracking links. Deliver an awe inspiring pitch with this creative Effective Company Event Communication Plan Dashboard For Tracking Event Gross Revenue Portrait PDF bundle. Topics like Gross Revenue, Promo Codes, Tracking Links can be discussed with this completely editable template. It is available for immediate download depending on the needs and requirements of the user.
-
Non Life Insurance Analytics Agent Dashboard With Revenue Chart Infographics PDF
This slide illustrates insurance agent sales statistics. It includes his total proposals, total policies, total claims and monthly revenue graph etc. Showcasing this set of slides titled Non Life Insurance Analytics Agent Dashboard With Revenue Chart Infographics PDF. The topics addressed in these templates are Revenue, Cost, Total Proposals. All the content presented in this PPT design is completely editable. Download it and make adjustments in color, background, font etc. as per your unique business setting.
-
Metrics To Measure Business Performance Revenue And Employment Cost Dashboard Clipart PDF
Mentioned slide covers revenue and employment cost dashboard. It includes details like full time employee number, total employment cost, total revenue and average revenue per FTE. Deliver and pitch your topic in the best possible manner with this Metrics To Measure Business Performance Revenue And Employment Cost Dashboard Clipart PDF. Use them to share invaluable insights on Total Revenue, Average Revenue Per, Total Employee Cost and impress your audience. This template can be altered and modified as per your expectations. So, grab it now.
-
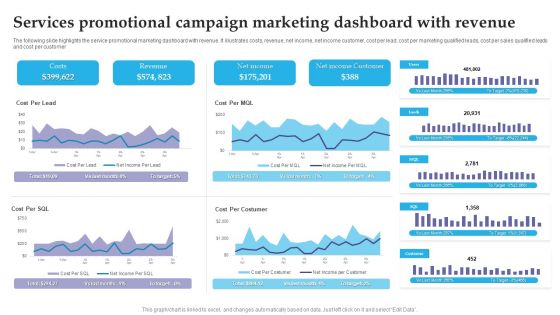
Services Promotional Campaign Marketing Dashboard With Revenue Brochure PDF
The following slide highlights the service promotional marketing dashboard with revenue. It illustrates costs, revenue, net income, net income customer, cost per lead, cost per marketing qualified leads, cost per sales qualified leads and cost per customer. Pitch your topic with ease and precision using this Services Promotional Campaign Marketing Dashboard With Revenue Brochure PDF. This layout presents information on Costs, Revenue, Net Income. It is also available for immediate download and adjustment. So, changes can be made in the color, design, graphics or any other component to create a unique layout.
-
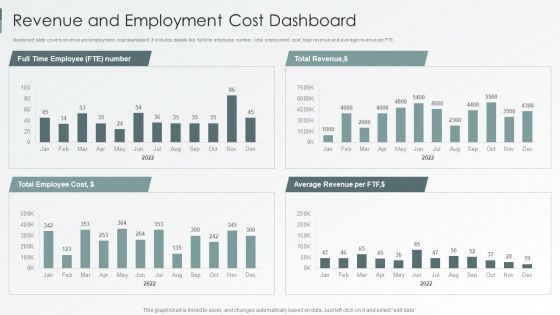
Enterprise Sustainability Performance Metrics Revenue And Employment Cost Dashboard Elements PDF
Mentioned slide covers revenue and employment cost dashboard. It includes details like full time employee number, total employment cost, total revenue and average revenue per FTE. Deliver an awe inspiring pitch with this creative Enterprise Sustainability Performance Metrics Revenue And Employment Cost Dashboard Elements PDF bundle. Topics like Total Revenue, Average Revenue, Total Employee can be discussed with this completely editable template. It is available for immediate download depending on the needs and requirements of the user.
-
Project Metrics Dashboard With Revenues And Expenses Icons PDF
This slide shows the project management dashboard which covers the name, priorities, indicators and status which includes strategic priorities, research and development, administration, performance management, etc. With purchases in last 30 days and tasks. Showcasing this set of slides titled Project Metrics Dashboard With Revenues And Expenses Icons PDF. The topics addressed in these templates are Performance Management, Research And Development, Strategic Priorities. All the content presented in this PPT design is completely editable. Download it and make adjustments in color, background, font etc. as per your unique business setting.
-
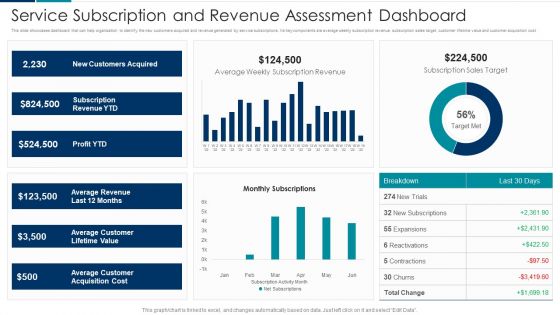
Managing New Service Roll Out And Marketing Procedure Service Subscription And Revenue Assessment Dashboard Themes PDF
Deliver an awe inspiring pitch with this creative Managing New Service Roll Out And Marketing Procedure Service Subscription And Revenue Assessment Dashboard Themes PDF bundle. Topics like New Customers Acquired, Subscription Revenue, Profit can be discussed with this completely editable template. It is available for immediate download depending on the needs and requirements of the user.
-
Distribution Revenue And Logistics With Fleet Performance Status Dashboard Ppt Layouts Background PDF
This slide illustrates facts and figures related to distribution logistics data of a corporation in financial year 2022. It includes fleet performance status, deliveries status, country-wise deliveries, country-wise profit etc. Pitch your topic with ease and precision using this Distribution Revenue And Logistics With Fleet Performance Status Dashboard Ppt Layouts Background PDF. This layout presents information on Deliveries Status, Country Wise Deliveries, Fleet Performance Status. It is also available for immediate download and adjustment. So, changes can be made in the color, design, graphics or any other component to create a unique layout.
-
Landing Page Leads And Revenue Generation Analytics For User Experience Optimization Dashboard Formats PDF
This slide covers website analytics based on revenue earned. It also included leads generated, bounce rates, customer churn stats, annual and monthly recurring revenue, etc. Pitch your topic with ease and precision using this Landing Page Leads And Revenue Generation Analytics For User Experience Optimization Dashboard Formats PDF. This layout presents information on Monthly Recurring Revenue, Bounce Rate, Gross Volume. It is also available for immediate download and adjustment. So, changes can be made in the color, design, graphics or any other component to create a unique layout.
-
Financial Budgeting And Assessment Dashboard With Revenue Variance Designs PDF
This slide shows the dashboard representing financial analysis and planning of an organization. It highlights the set revenue targets and actual revenue with the help of graphs. Showcasing this set of slides titled Financial Budgeting And Assessment Dashboard With Revenue Variance Designs PDF. The topics addressed in these templates are YTD Revenue, Revenue Delta, Revenue Variance. All the content presented in this PPT design is completely editable. Download it and make adjustments in color, background, font etc. as per your unique business setting.
-
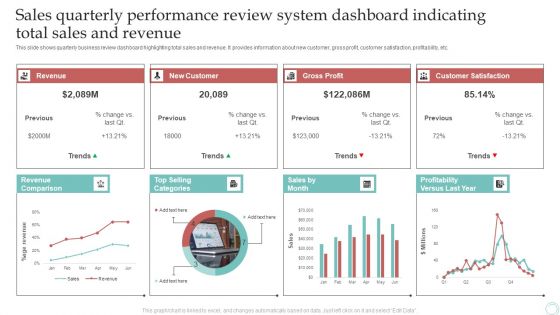
Sales Quarterly Performance Review System Dashboard Indicating Total Sales And Revenue Download PDF
This slide shows quarterly business review dashboard highlighting total sales and revenue. It provides information about new customer, gross profit, customer satisfaction, profitability, etc. Pitch your topic with ease and precision using this Sales Quarterly Performance Review System Dashboard Indicating Total Sales And Revenue Download PDF. This layout presents information on Revenue, New Customer, Gross Profit. It is also available for immediate download and adjustment. So, changes can be made in the color, design, graphics or any other component to create a unique layout.
-
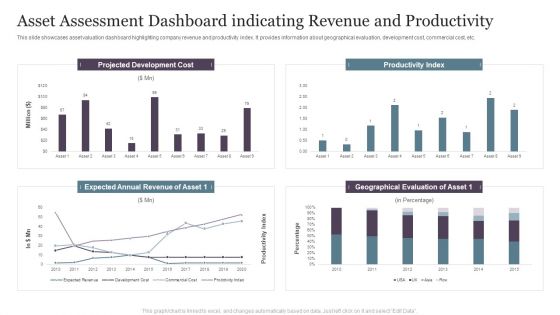
Asset Assessment Dashboard Indicating Revenue And Productivity Infographics PDF
This slide showcases asset valuation dashboard highlighting company revenue and productivity index. It provides information about geographical evaluation, development cost, commercial cost, etc.Pitch your topic with ease and precision using this Asset Assessment Dashboard Indicating Revenue And Productivity Infographics PDF. This layout presents information on Projected Development, Productivity Index, Geographical Evaluation. It is also available for immediate download and adjustment. So, changes can be made in the color, design, graphics or any other component to create a unique layout.
-
Implementing BPM Tool To Enhance Operational Efficiency Revenues And Customers Overview Kpi Dashboard Rules PDF
Following slide illustrates revenue and customers overview kpi dashboard for banks. Kpis covered in the dashboard are revenue actual vs. Target, number of new customers, customer acquisition cost vs. Customer lifetime value.This Implementing BPM Tool To Enhance Operational Efficiency Revenues And Customers Overview Kpi Dashboard Rules PDF is perfect for any presentation, be it in front of clients or colleagues. It is a versatile and stylish solution for organizing your meetings. The Implementing BPM Tool To Enhance Operational Efficiency Revenues And Customers Overview Kpi Dashboard Rules PDF features a modern design for your presentation meetings. The adjustable and customizable slides provide unlimited possibilities for acing up your presentation. Slidegeeks has done all the homework before launching the product for you. So, do not wait, grab the presentation templates today.
-
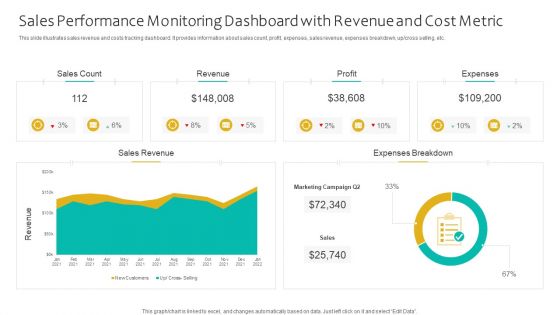
Sales Performance Monitoring Dashboard With Revenue And Cost Metric Ppt Portfolio Good PDF
This slide illustrates sales revenue and costs tracking dashboard. It provides information about sales count, profit, expenses, sales revenue, expenses breakdown, up or cross selling, etc. Showcasing this set of slides titled Sales Performance Monitoring Dashboard With Revenue And Cost Metric Ppt Portfolio Good PDF. The topics addressed in these templates are Sales Count, Revenue, Profit, Expenses. All the content presented in this PPT design is completely editable. Download it and make adjustments in color, background, font etc. as per your unique business setting.
-
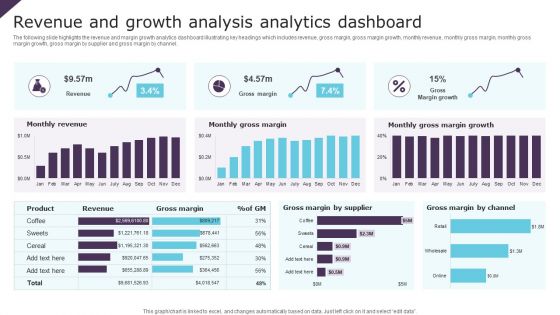
Revenue And Growth Analysis Analytics Dashboard Ppt Infographic Template Brochure PDF
The following slide highlights the revenue and margin growth analytics dashboard illustrating key headings which includes revenue, gross margin, gross margin growth, monthly revenue, monthly gross margin, monthly gross margin growth, gross margin by supplier and gross margin by channel. Pitch your topic with ease and precision using this Revenue And Growth Analysis Analytics Dashboard Ppt Infographic Template Brochure PDF. This layout presents information on Monthly Revenue, Monthly Gross Margin, Gross Margin Growth. It is also available for immediate download and adjustment. So, changes can be made in the color, design, graphics or any other component to create a unique layout.
-
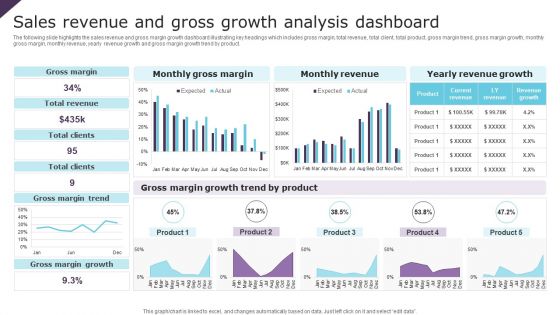
Sales Revenue And Gross Growth Analysis Dashboard Ppt Inspiration Background Image PDF
The following slide highlights the sales revenue and gross margin growth dashboard illustrating key headings which includes gross margin, total revenue, total client, total product, gross margin trend, gross margin growth, monthly gross margin, monthly revenue, yearly revenue growth and gross margin growth trend by product. Showcasing this set of slides titled Sales Revenue And Gross Growth Analysis Dashboard Ppt Inspiration Background Image PDF. The topics addressed in these templates are Gross Margin, Total Revenue, Total Clients. All the content presented in this PPT design is completely editable. Download it and make adjustments in color, background, font etc. as per your unique business setting.


