Representation infographics PowerPoint Presentation Templates and Google Slides
-
Data Representation Vector Icon Ppt Powerpoint Presentation Infographic Template Example File
This is a data representation vector icon ppt powerpoint presentation infographic template example file. This is a four stage process. The stages in this process are data visualization icon, data management icon.
-
8 Segments Pie Chart For Data Representation Ppt PowerPoint Presentation Infographics Design Templates
This is a 8 segments pie chart for data representation ppt powerpoint presentation infographics design templates. This is a eight stage process. The stages in this process are 6 piece pie chart, 6 segment pie chart, 6 parts pie chart.
-
Data Representation Vector Icon Ppt PowerPoint Presentation Infographic Template Samples
Presenting this set of slides with name data representation vector icon ppt powerpoint presentation infographic template samples. This is a one stage process. The stages in this process are data visualization icon, research analysis, business focus. This is a completely editable PowerPoint presentation and is available for immediate download. Download now and impress your audience.
-
Income Statement Graphical Representation Template Ppt PowerPoint Presentation Model Infographic Template
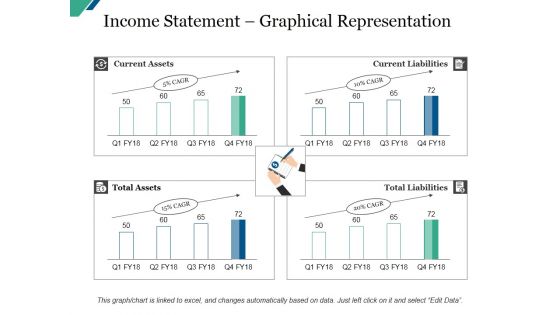
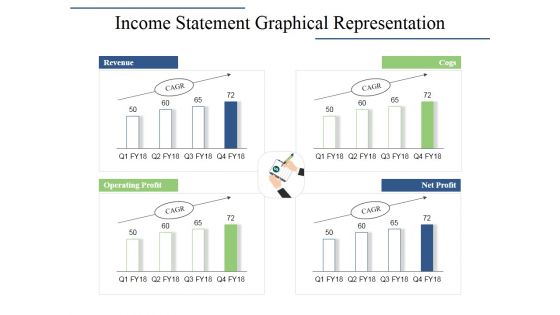
This is a income statement graphical representation template ppt powerpoint presentation model infographic template. This is a four stage process. The stages in this process are revenue, cogs, operating profit, net profit.
-
Income Statement Graphical Representation Ppt PowerPoint Presentation Infographics Layouts
This is a income statement graphical representation ppt powerpoint presentation infographics layouts. This is a four stage process. The stages in this process are revenue, cogs, operating profit, net profit.
-
Income Statement Graphical Representation Ppt PowerPoint Presentation Infographic Template Influencers
This is a income statement graphical representation ppt powerpoint presentation infographic template influencers. This is a four stage process. The stages in this process are revenue, cogs, operating profit, profit.
-
Balance Sheet Graphical Representation Ppt PowerPoint Presentation Infographics Layouts
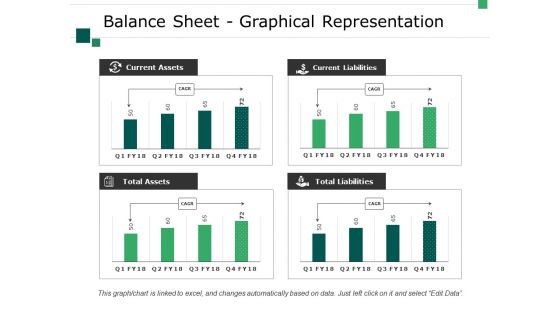
This is a balance sheet graphical representation ppt powerpoint presentation infographics layouts. This is a four stage process. The stages in this process are business, current assets, total assets, total liabilities, current liabilities.
-
Business Diagram Infographics With Multiple Icons For Data Representation Presentation Template
This business diagram has been designed with graphic of multiple icons info graphics. Download this diagram to analyze the key points. This diagram offers a way for your audience to visually conceptualize the process.
-
Business Diagram Five Staged Linear Infographics With Icons For Data Representation Ppt Template
Five staged linear info graphics with icons has been used to craft this power point template. This diagram template contains the concept of data representation. Use this PPT for your business and marketing data related topics in any presentations.
-
Business Diagram Four Staged Pencil Infographics For Data Representation PowerPoint Template
Four staged pencil info graphics has been used to design this power point template. This diagram template contains the concept of data representations. Use this PPT for your business and marketing presentations.
-
Busines Diagram Five Staged Business Infographics For Data Representation Ppt Template
This business diagram displays five staged business info graphics. This professional diagram text boxes for data representation. Ideas are best expressed easily with the help of this diagram slide.
-
Business Diagram Five Staged Infographics For Text Representation Presentation Template
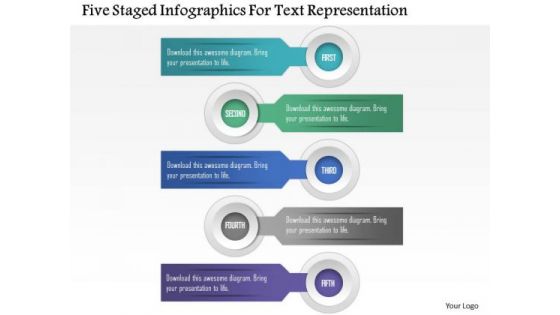
Five staged info graphics has been used to design this PowerPoint template. This slide can be used for text representation. Present your views using this innovative slide and be assured of leaving a lasting impression.
-
Business Diagram Four Staged Text Infographics For Data Representation Presentation Template
Four staged info graphics has been used to design this PowerPoint template. This slide can be used for text representation. Present your views using this innovative slide and be assured of leaving a lasting impression.
-
Business Diagram Three Staged Business Infographics For Data Representation Presentation Template
Three staged info graphics has been used to design this PowerPoint template. This slide can be used for text representation. Present your views using this innovative slide and be assured of leaving a lasting impression.
-
Business Diagram Three Staged Infographics For Text Representation Presentation Template
Three staged info graphics has been used to design this PowerPoint template. This slide can be used for text representation. Present your views using this innovative slide and be assured of leaving a lasting impression.
-
Banners Infographic For Text Representation Powerpoint Templates
Communicate with your group through this slide of banners infographic. It will facilitate understanding of your views. This diagram can be used to explain the process steps in business presentations.
-
Colorful Infographic For Text Representation Powerpoint Templates
Our above business diagram has been designed with colorful circular tags with icons. This slide is suitable for text representation in visual manner. Use this business diagram to present your work in a more smart and precise manner.
-
Circle Infographics For Visual Representation Powerpoint Template
This business slide provides background for four option display. Display the options, business steps or workflow using this diagram as a tool. You can present your opinions using this impressive slide.
-
Circle Infographics For Text Representation PowerPoint Templates
This creative slide is designed with graphics of circles. This slide has been designed for text representation. Use this diagram in business presentations to give better impact.
-
Business Diagram Colorful Infographics For Data Representation Presentation Template
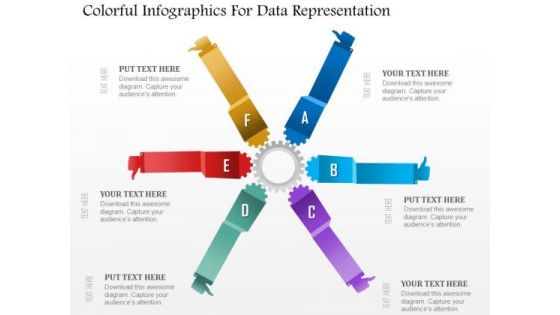
This power point template diagram has been crafted with graphic of colorful info graphics. This PPT diagram contains the concept of analysis and data representations. Use this PPT for marketing and business related presentations.
-
Market Sizing Market Survey Graphical Representation Ppt Infographic Template Examples PDF
Presenting this set of slides with name market sizing market survey graphical representation ppt infographic template examples pdf. The topics discussed in these slides are market survey graphical representation. This is a completely editable PowerPoint presentation and is available for immediate download. Download now and impress your audience.
-
Income Statement Graphical Representation Company Profile Ppt Infographic Template Guidelines PDF
Deliver an awe inspiring pitch with this creative income statement graphical representation company profile ppt infographic template guidelines pdf bundle. Topics like operating profit, net profit, revenue, cogs can be discussed with this completely editable template. It is available for immediate download depending on the needs and requirements of the user.
-
8 Cycle Representation Infographic For End User Productivity Ppt PowerPoint Presentation File Graphic Tips PDF
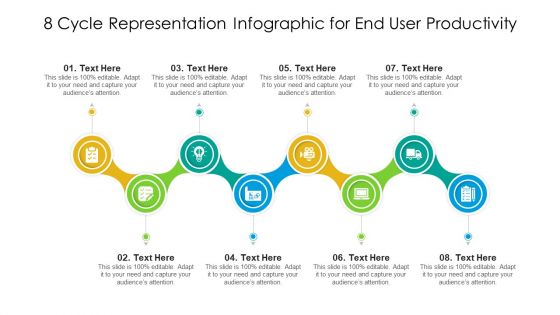
Presenting 8 cycle representation infographic for end user productivity ppt powerpoint presentation file graphic tips pdf to dispense important information. This template comprises eight stages. It also presents valuable insights into the topics including 8 cycle representation infographic for end user productivity. This is a completely customizable PowerPoint theme that can be put to use immediately. So, download it and address the topic impactfully.
-
Graphical Representation Of Research IT D3 Data Driven Documents Infographics PDF
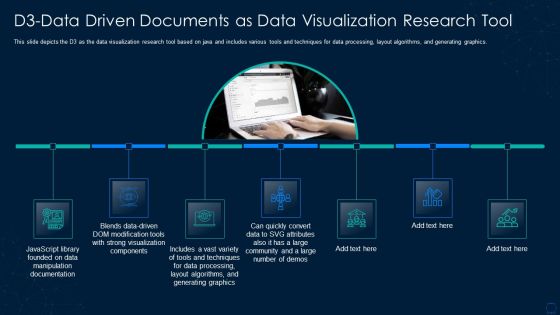
This slide depicts the D3 as the data visualization research tool based on java and includes various tools and techniques for data processing, layout algorithms, and generating graphics. Presenting graphical representation of research it d3 data driven documents infographics pdf to provide visual cues and insights. Share and navigate important information on seven stages that need your due attention. This template can be used to pitch topics like documentation, graphics, techniques, community. In addtion, this PPT design contains high resolution images, graphics, etc, that are easily editable and available for immediate download.
-
10 Piece Wheel Represent Elements Of Investment Analysis Ppt Infographics Show PDF
Presenting 10 Piece Wheel Represent Elements Of Investment Analysis Ppt Infographics Show PDF to dispense important information. This template comprises ten stages. It also presents valuable insights into the topics including Mission And Vision, Objectives, Investment Analysis. This is a completely customizable PowerPoint theme that can be put to use immediately. So, download it and address the topic impactfully.
-
11 Piece Wheel Represent Elements Of Investment Analysis Ppt Infographics Samples PDF
Presenting 11 Piece Wheel Represent Elements Of Investment Analysis Ppt Infographics Samples PDF to dispense important information. This template comprises eleven stages. It also presents valuable insights into the topics including Mission And Vision, Objectives, Investment Analysis. This is a completely customizable PowerPoint theme that can be put to use immediately. So, download it and address the topic impactfully.
-
12 Piece Wheel Represent Elements Of Investment Analysis Ppt Infographics Sample PDF
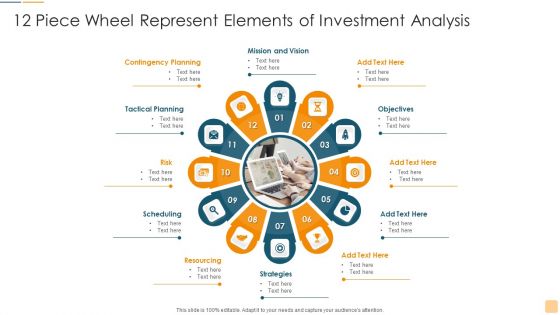
Presenting 12 Piece Wheel Represent Elements Of Investment Analysis Ppt Infographics Sample PDF to dispense important information. This template comprises tweleve stages. It also presents valuable insights into the topics including Mission And Vision, Objectives, Investment Analysis. This is a completely customizable PowerPoint theme that can be put to use immediately. So, download it and address the topic impactfully.
-
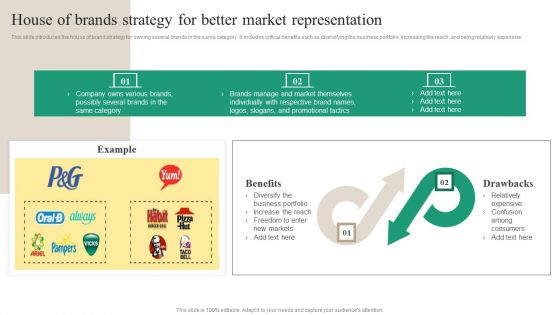
House Of Brands Strategy For Better Market Representation Infographics PDF
This slide introduces the house of brand strategy for owning several brands in the same category. It includes critical benefits such as diversifying the business portfolio, increasing the reach, and being relatively expensive. Do you have to make sure that everyone on your team knows about any specific topic I yes, then you should give House Of Brands Strategy For Better Market Representation Infographics PDF a try. Our experts have put a lot of knowledge and effort into creating this impeccable House Of Brands Strategy For Better Market Representation Infographics PDF. You can use this template for your upcoming presentations, as the slides are perfect to represent even the tiniest detail. You can download these templates from the Slidegeeks website and these are easy to edit. So grab these today.
-
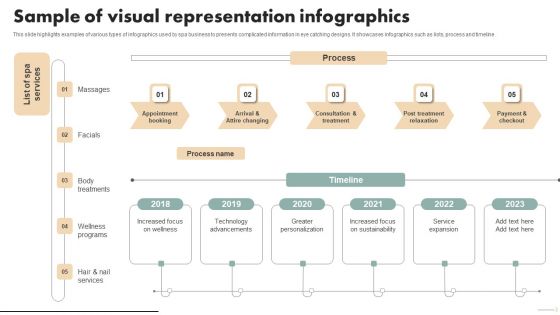
Sample Of Visual Representation Infographics Ppt PowerPoint Presentation File Styles PDF
This slide highlights examples of various types of infographics used by business to presents complicated information in eye catching designs. It showcases infographics such as lists, process and timeline. Take your projects to the next level with our ultimate collection of Sample Of Visual Representation Infographics Ppt PowerPoint Presentation File Styles PDF. Slidegeeks has designed a range of layouts that are perfect for representing task or activity duration, keeping track of all your deadlines at a glance. Tailor these designs to your exact needs and give them a truly corporate look with your own brand colors they will make your projects stand out from the rest.
-
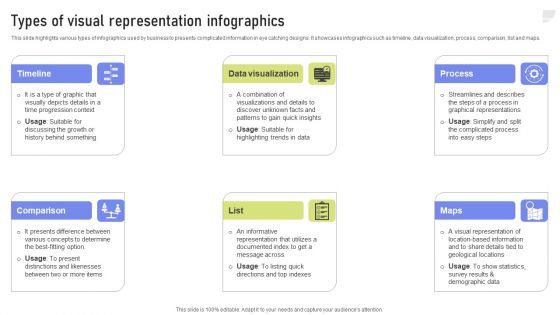
Types Of Visual Representation Infographics Ppt PowerPoint Presentation File Files PDF
This slide highlights various types of infographics used by business to presents complicated information in eye catching designs. It showcases infographics such as timeline, data visualization, process, comparison, list and maps. This Types Of Visual Representation Infographics Ppt PowerPoint Presentation File Files PDF is perfect for any presentation, be it in front of clients or colleagues. It is a versatile and stylish solution for organizing your meetings. The Types Of Visual Representation Infographics Ppt PowerPoint Presentation File Files PDF features a modern design for your presentation meetings. The adjustable and customizable slides provide unlimited possibilities for acing up your presentation. Slidegeeks has done all the homework before launching the product for you. So, do not wait, grab the presentation templates today
-
Spa Marketing Strategy Boost Reservations Enhance Revenue Sample Of Visual Representation Infographics Summary PDF
This slide highlights examples of various types of infographics used by spa business to presents complicated information in eye catching designs. It showcases infographics such as lists, process and timeline. Presenting this PowerPoint presentation, titled Spa Marketing Strategy Boost Reservations Enhance Revenue Sample Of Visual Representation Infographics Summary PDF, with topics curated by our researchers after extensive research. This editable presentation is available for immediate download and provides attractive features when used. Download now and captivate your audience. Presenting this Spa Marketing Strategy Boost Reservations Enhance Revenue Sample Of Visual Representation Infographics Summary PDF. Our researchers have carefully researched and created these slides with all aspects taken into consideration. This is a completely customizable Spa Marketing Strategy Boost Reservations Enhance Revenue Sample Of Visual Representation Infographics Summary PDF that is available for immediate downloading. Download now and make an impact on your audience. Highlight the attractive features available with our PPTs.


