Proportion circle graphics for revenue cycle profitability analysis PowerPoint Presentation Templates and Google Slides
-
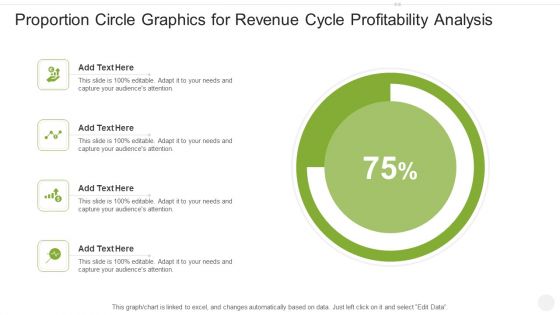
Proportion Circle Graphics For Revenue Cycle Profitability Analysis Introduction PDF
Showcasing this set of slides titled proportion circle graphics for revenue cycle profitability analysis introduction pdf. The topics addressed in these templates are proportion circle graphics for revenue cycle profitability analysis. All the content presented in this PPT design is completely editable. Download it and make adjustments in color, background, font etc. as per your unique business setting.


