Project Completion Rate PowerPoint Presentation Templates and Google Slides
-
Defining The Success Rate Of Projects Completed Since 2021 Pictures PDF
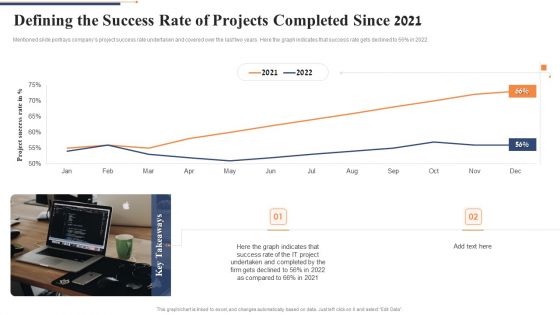
Mentioned slide portrays companys project success rate undertaken and covered over the last two years. Here the graph indicates that success rate gets declined to 56percentsge in 2022. Deliver an awe inspiring pitch with this creative defining the success rate of projects completed since 2021 pictures pdf bundle. Topics like project success rate can be discussed with this completely editable template. It is available for immediate download depending on the needs and requirements of the user.
-
Quality Assurance Model For Agile IT Defining The Success Rate Of Projects Completed Themes PDF
Mentioned slide portrays companys project success rate undertaken and covered over the last two years. Here the graph indicates that success rate gets declined to 56 percent in 2022. Deliver an awe inspiring pitch with this creative quality assurance model for agile it defining the success rate of projects completed themes pdf bundle. Topics like success rate, it project, 2021 to 2022 can be discussed with this completely editable template. It is available for immediate download depending on the needs and requirements of the user.
-
Declining Graph Of Task Completion Rate Digital Transformation In Project Management
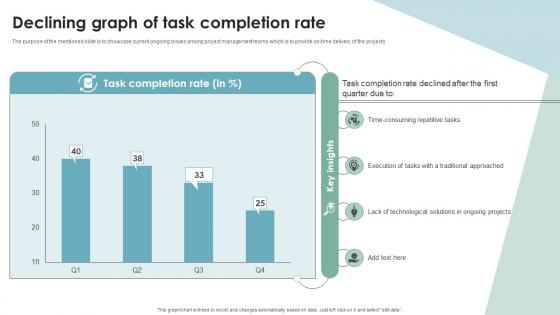
The purpose of the mentioned slide is to showcase current ongoing issues among project management teams which is to provide on-time delivery of the projects. From laying roadmaps to briefing everything in detail, our templates are perfect for you. You can set the stage with your presentation slides. All you have to do is download these easy-to-edit and customizable templates. Declining Graph Of Task Completion Rate Digital Transformation In Project Management will help you deliver an outstanding performance that everyone would remember and praise you for. Do download this presentation today.
-
Digital Project Management Strategies Declining Graph Of Task Completion Rate
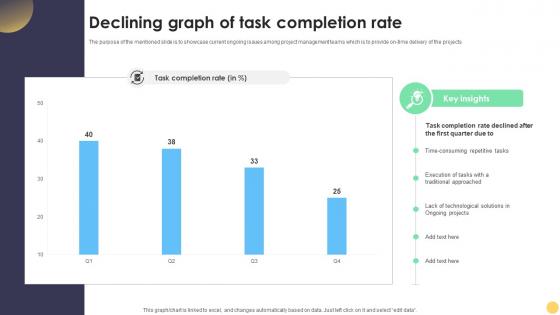
The purpose of the mentioned slide is to showcase current ongoing issues among project management teams which is to provide on-time delivery of the projects. From laying roadmaps to briefing everything in detail, our templates are perfect for you. You can set the stage with your presentation slides. All you have to do is download these easy-to-edit and customizable templates. Digital Project Management Strategies Declining Graph Of Task Completion Rate will help you deliver an outstanding performance that everyone would remember and praise you for. Do download this presentation today.
-
The Digital Project Managers Declining Graph Of Task Completion Rate
The purpose of the mentioned slide is to showcase current ongoing issues among project management teams which is to provide on-time delivery of the projects. Whether you have daily or monthly meetings, a brilliant presentation is necessary. The Digital Project Managers Declining Graph Of Task Completion Rate can be your best option for delivering a presentation. Represent everything in detail using The Digital Project Managers Declining Graph Of Task Completion Rate and make yourself stand out in meetings. The template is versatile and follows a structure that will cater to your requirements. All the templates prepared by Slidegeeks are easy to download and edit. Our research experts have taken care of the corporate themes as well. So, give it a try and see the results.


