Performance chart PowerPoint Presentation Templates and Google Slides
-
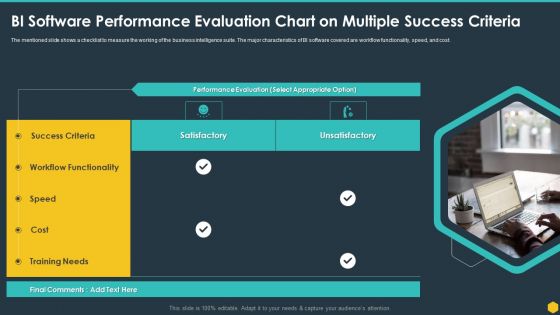
BI Software Performance Evaluation Chart On Multiple Success Criteria BI Transformation Toolset Ideas PDF
The mentioned slide shows a checklist to measure the working of the business intelligence suite. The major characteristics of BI software covered are workflow functionality, speed, and cost. This is a BI Software Performance Evaluation Chart On Multiple Success Criteria BI Transformation Toolset Ideas PDF template with various stages. Focus and dispense information on one stages using this creative set, that comes with editable features. It contains large content boxes to add your information on topics like BI Software Performance Evaluation Chart On Multiple Success Criteria. You can also showcase facts, figures, and other relevant content using this PPT layout. Grab it now.
-
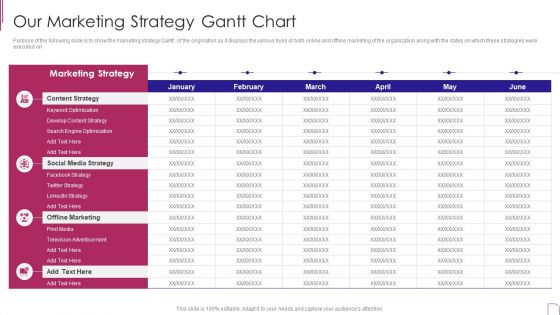
Yearly Product Performance Assessment Repor Our Marketing Strategy Gantt Chart Demonstration PDF
Purpose of the following slide is to show the marketing strategy Gantt of the origination as it displays the various tools of both online and offline marketing of the organization along with the dates on which these strategies were executed on.Deliver and pitch your topic in the best possible manner with this Yearly Product Performance Assessment Repor Our Marketing Strategy Gantt Chart Demonstration PDF Use them to share invaluable insights on Marketing Strategy, Content Strategy, Television Advertisement and impress your audience. This template can be altered and modified as per your expectations. So, grab it now.
-
Employee Quarterly Sales And Revenue Generation Performance Chart Mockup PDF
This slide depicts annual sales percentage and revenue generated by employee. It provides information regarding overall employee performance for yearly appraisal process. Pitch your topic with ease and precision using this Employee Quarterly Sales And Revenue Generation Performance Chart Mockup PDF. This layout presents information on Performance, Sales, Revenue. It is also available for immediate download and adjustment. So, changes can be made in the color, design, graphics or any other component to create a unique layout.
-
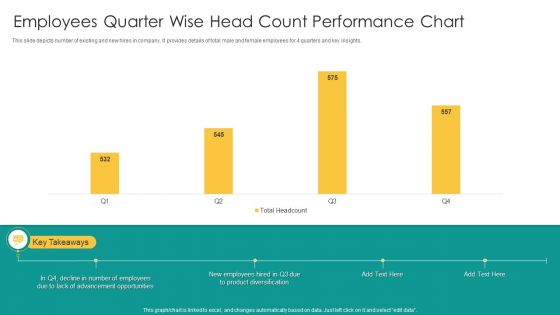
Employees Quarter Wise Head Count Performance Chart Clipart PDF
This slide depicts number of existing and new hires in company. It provides details of total male and female employees for 4 quarters and key insights. Showcasing this set of slides titled Employees Quarter Wise Head Count Performance Chart Clipart PDF. The topics addressed in these templates are New Employees, Product Diversification, Advancement Opportunities. All the content presented in this PPT design is completely editable. Download it and make adjustments in color, background, font etc. as per your unique business setting.
-
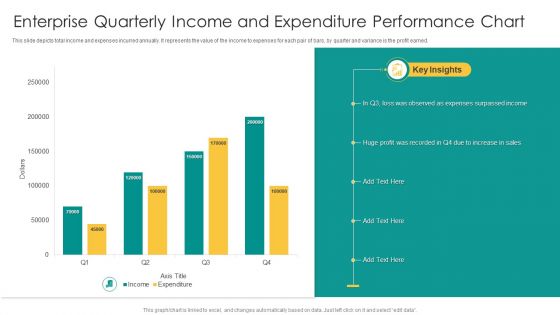
Enterprise Quarterly Income And Expenditure Performance Chart Graphics PDF
This slide depicts total income and expenses incurred annually. It represents the value of the income to expenses for each pair of bars, by quarter and variance is the profit earned. Pitch your topic with ease and precision using this Enterprise Quarterly Income And Expenditure Performance Chart Graphics PDF. This layout presents information on Expenses Surpassed Income, Sales, Huge Profit. It is also available for immediate download and adjustment. So, changes can be made in the color, design, graphics or any other component to create a unique layout.
-
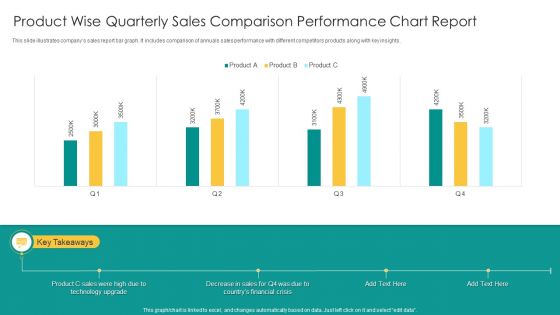
Product Wise Quarterly Sales Comparison Performance Chart Report Infographics PDF
This slide illustrates companys sales report bar graph. It includes comparison of annuals sales performance with different competitors products along with key insights. Showcasing this set of slides titled Product Wise Quarterly Sales Comparison Performance Chart Report Infographics PDF. The topics addressed in these templates are Product C Sales, Technology Upgrade, Financial Crisis. All the content presented in this PPT design is completely editable. Download it and make adjustments in color, background, font etc. as per your unique business setting.
-
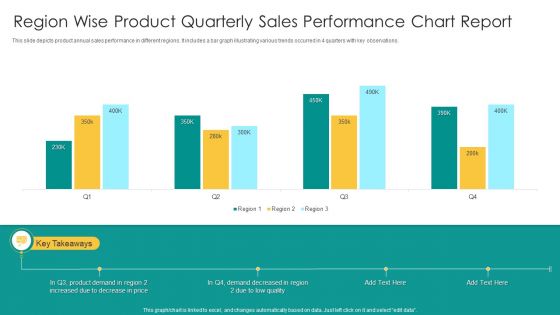
Region Wise Product Quarterly Sales Performance Chart Report Topics PDF
This slide depicts product annual sales performance in different regions. It includes a bar graph illustrating various trends occurred in 4 quarters with key observations. Showcasing this set of slides titled Region Wise Product Quarterly Sales Performance Chart Report Topics PDF. The topics addressed in these templates are Product Demand, Price, Low Quality. All the content presented in this PPT design is completely editable. Download it and make adjustments in color, background, font etc. as per your unique business setting.
-
Trend Of Quarterly Funding For Start Up Project Performance Chart Graphics PDF
This slide depicts investment made in different start up projects for 2 years. It also includes the investment amount, funding quarters in graphical form with a trend line and insights. Pitch your topic with ease and precision using this Trend Of Quarterly Funding For Start Up Project Performance Chart Graphics PDF. This layout presents information on Good Management, Efficient Team, Investment Decreased. It is also available for immediate download and adjustment. So, changes can be made in the color, design, graphics or any other component to create a unique layout.
-
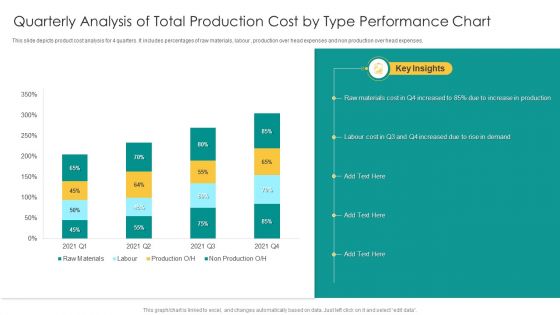
Quarterly Analysis Of Total Production Cost By Type Performance Chart Summary PDF
This slide depicts product cost analysis for 4 quarters. It includes percentages of raw materials, labour , production over head expenses and non production over head expenses. Showcasing this set of slides titled Quarterly Analysis Of Total Production Cost By Type Performance Chart Summary PDF. The topics addressed in these templates are Raw Materials Cost, Increase Production, Rise Demand. All the content presented in this PPT design is completely editable. Download it and make adjustments in color, background, font etc. as per your unique business setting.
-
Quarterly Non Profit Marketing Strategy For Fundraising Campaign Performance Chart Diagrams PDF
This slide depicts different strategies applied annually to gain investment for non profit organizations. It includes direct mail, event, e-mail, social media and content marketing tactics. Pitch your topic with ease and precision using this Quarterly Non Profit Marketing Strategy For Fundraising Campaign Performance Chart Diagrams PDF. This layout presents information on Marketing Strategies, Event Marketing, Social Media. It is also available for immediate download and adjustment. So, changes can be made in the color, design, graphics or any other component to create a unique layout.
-
Unsatisfactory Performance Chart Icon With Downward Arrow Infographics PDF
Pitch your topic with ease and precision using this Unsatisfactory Performance Chart Icon With Downward Arrow Infographics PDF. This layout presents information on Unsatisfactory Performance, Chart Icon, Downward Arrow. It is also available for immediate download and adjustment. So, changes can be made in the color, design, graphics or any other component to create a unique layout.
-
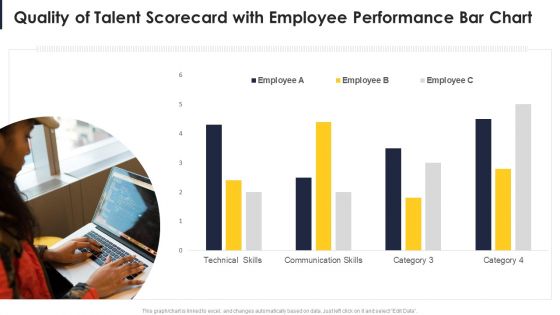
Quality Of Talent Scorecard With Employee Performance Bar Chart Formats PDF
Deliver an awe inspiring pitch with this creative Quality Of Talent Scorecard With Employee Performance Bar Chart Formats PDF bundle. Topics like Technical Skills, Communication Skills, Selling Skills can be discussed with this completely editable template. It is available for immediate download depending on the needs and requirements of the user.
-
Three Years Customer Sales Performance Comparison Chart Professional PDF
This slide shows the comparative analysis of sales to top five Customers in the last years. It includes sales from 2021 to 2023. Pitch your topic with ease and precision using this Three Years Customer Sales Performance Comparison Chart Professional PDF. This layout presents information on Highest Sales, Customer Relationships, Lowest Sales. It is also available for immediate download and adjustment. So, changes can be made in the color, design, graphics or any other component to create a unique layout.
-
Area Chart Employee Performance Management System To Enhance Workforce Productivity Ideas PDF
This Area Chart Employee Performance Management System To Enhance Workforce Productivity Ideas PDF from Slidegeeks makes it easy to present information on your topic with precision. It provides customization options, so you can make changes to the colors, design, graphics, or any other component to create a unique layout. It is also available for immediate download, so you can begin using it right away. Slidegeeks has done good research to ensure that you have everything you need to make your presentation stand out. Make a name out there for a brilliant performance.
-
Sales Risk Assessment Profit Maximization Team Performance Enhancement Line Chart Information PDF
Slidegeeks is here to make your presentations a breeze with Sales Risk Assessment Profit Maximization Team Performance Enhancement Line Chart Information PDF With our easy to use and customizable templates, you can focus on delivering your ideas rather than worrying about formatting. With a variety of designs to choose from, you are sure to find one that suits your needs. And with animations and unique photos, illustrations, and fonts, you can make your presentation pop. So whether you are giving a sales pitch or presenting to the board, make sure to check out Slidegeeks first.
-
Sales Risk Assessment Profit Maximization Team Performance Enhancement Pie Chart Clipart PDF
Do you have an important presentation coming up Are you looking for something that will make your presentation stand out from the rest Look no further than Sales Risk Assessment Profit Maximization Team Performance Enhancement Pie Chart Clipart PDF. With our professional designs, you can trust that your presentation will pop and make delivering it a smooth process. And with Slidegeeks, you can trust that your presentation will be unique and memorable. So why wait Grab Sales Risk Assessment Profit Maximization Team Performance Enhancement Pie Chart Clipart PDF today and make your presentation stand out from the rest.
-
Effective Staff Performance Optimization Techniques Area Chart Template PDF
Boost your pitch with our creative Effective Staff Performance Optimization Techniques Area Chart Template PDF. Deliver an awe inspiring pitch that will mesmerize everyone. Using these presentation templates you will surely catch everyones attention. You can browse the ppts collection on our website. We have researchers who are experts at creating the right content for the templates. So you do not have to invest time in any additional work. Just grab the template now and use them.
-
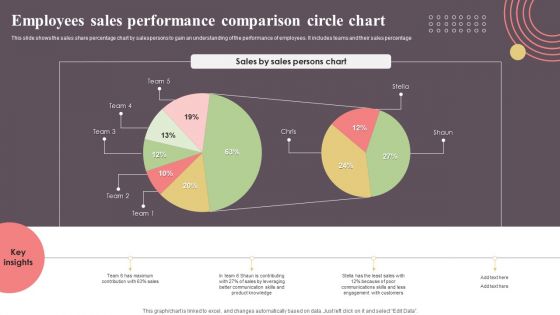
Employees Sales Performance Comparison Circle Chart Topics PDF
This slide shows the sales share percentage chart by salespersons to gain an understanding of the performance of employees. It includes teams and their sales percentage. Pitch your topic with ease and precision using this Employees Sales Performance Comparison Circle Chart Topics PDF. This layout presents information on Employees Sales Performance, Comparison Circle Chart. It is also available for immediate download and adjustment. So, changes can be made in the color, design, graphics or any other component to create a unique layout.
-
Process To Formulate Performance Marketing Campaign Ppt PowerPoint Presentation Diagram Graph Charts PDF
This slide showcases process that can help organization to formulate performance marketing campaign and run online targeted ads. Its key steps are - establish campaign objectives, determine marketing channels, run marketing campaigns and optimize campaigns Explore a selection of the finest Process To Formulate Performance Marketing Campaign Ppt PowerPoint Presentation Diagram Graph Charts PDF here. With a plethora of professionally designed and pre made slide templates, you can quickly and easily find the right one for your upcoming presentation. You can use our Process To Formulate Performance Marketing Campaign Ppt PowerPoint Presentation Diagram Graph Charts PDF to effectively convey your message to a wider audience. Slidegeeks has done a lot of research before preparing these presentation templates. The content can be personalized and the slides are highly editable. Grab templates today from Slidegeeks.
-
Food Company Financial Performance Summary Historical Food Product Sales Chart Icons PDF
The following slide shows the comparative sales growth of agricultural products and processed foods. It shows the product sales from more than three decades to assess the change in demand of company products. This Food Company Financial Performance Summary Historical Food Product Sales Chart Icons PDF from Slidegeeks makes it easy to present information on your topic with precision. It provides customization options, so you can make changes to the colors, design, graphics, or any other component to create a unique layout. It is also available for immediate download, so you can begin using it right away. Slidegeeks has done good research to ensure that you have everything you need to make your presentation stand out. Make a name out there for a brilliant performance.
-
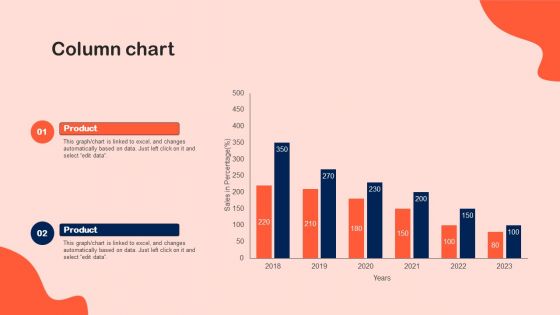
Column Chart Shopper Marketing Initiatives To Boost Retail Store Performance Brochure PDF
Here you can discover an assortment of the finest PowerPoint and Google Slides templates. With these templates, you can create presentations for a variety of purposes while simultaneously providing your audience with an eye catching visual experience. Download Column Chart Shopper Marketing Initiatives To Boost Retail Store Performance Brochure PDF to deliver an impeccable presentation. These templates will make your job of preparing presentations much quicker, yet still, maintain a high level of quality. Slidegeeks has experienced researchers who prepare these templates and write high quality content for you. Later on, you can personalize the content by editing the Column Chart Shopper Marketing Initiatives To Boost Retail Store Performance Brochure PDF.
-
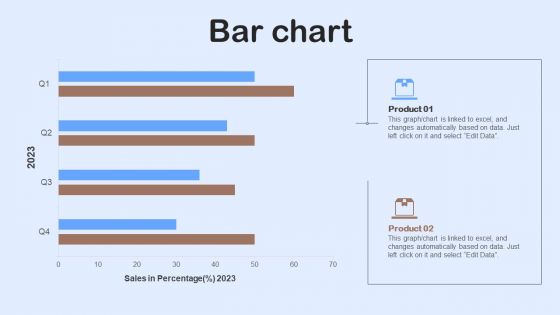
Nestle Performance Management Report Bar Chart Ppt Inspiration Shapes PDF
This graph or chart is linked to excel, and changes automatically based on data. Just left click on it and select Edit Data. Whether you have daily or monthly meetings, a brilliant presentation is necessary. Nestle Performance Management Report Bar Chart Ppt Inspiration Shapes PDF can be your best option for delivering a presentation. Represent everything in detail using Nestle Performance Management Report Bar Chart Ppt Inspiration Shapes PDF and make yourself stand out in meetings. The template is versatile and follows a structure that will cater to your requirements. All the templates prepared by Slidegeeks are easy to download and edit. Our research experts have taken care of the corporate themes as well. So, give it a try and see the results.
-
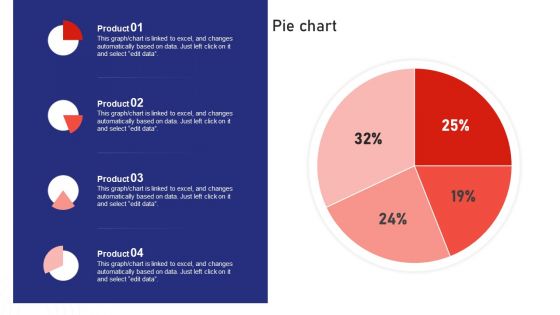
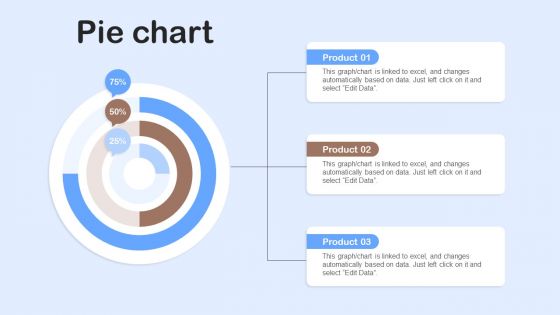
Nestle Performance Management Report Pie Chart Ppt Ideas Graphics Example PDF
This graph or chart is linked to excel, and changes automatically based on data. Just left click on it and select Edit Data. Are you in need of a template that can accommodate all of your creative concepts This one is crafted professionally and can be altered to fit any style. Use it with Google Slides or PowerPoint. Include striking photographs, symbols, depictions, and other visuals. Fill, move around, or remove text boxes as desired. Test out color palettes and font mixtures. Edit and save your work, or work with colleagues. Download Nestle Performance Management Report Pie Chart Ppt Ideas Graphics Example PDF and observe how to make your presentation outstanding. Give an impeccable presentation to your group and make your presentation unforgettable.
-
Performance Chart PowerPoint Icon Cc
Microsoft PowerPoint Template and Background with business statistics chart in blue color
-
Performance Chart PowerPoint Icon F
Microsoft PowerPoint Template and Background with business statistics chart in blue color
-
Performance Chart PowerPoint Icon R
Microsoft PowerPoint Template and Background with business statistics chart in blue color
-
Performance Chart PowerPoint Icon C
Microsoft PowerPoint Template and Background with business statistics chart in blue color
-
Performance Chart PowerPoint Icon S
Microsoft PowerPoint Template and Background with business statistics chart in blue color
-
Employee Quarter Wise Performance Analysis Bar Chart Icon Guidelines PDF
Presenting Employee Quarter Wise Performance Analysis Bar Chart Icon Guidelines PDF to dispense important information. This template comprises four stages. It also presents valuable insights into the topics including Employee Quarter Wise, Performance Analysis, Bar Chart Icon. This is a completely customizable PowerPoint theme that can be put to use immediately. So, download it and address the topic impactfully.
-
Quarterly Sales Revenue Generation Performance Chart Icon Slides PDF
This graph or chart is linked to excel, and changes automatically based on data. Just left click on it and select edit data. Persuade your audience using this Quarterly Sales Revenue Generation Performance Chart Icon Slides PDF. This PPT design covers four stages, thus making it a great tool to use. It also caters to a variety of topics including Quarterly Sales Revenue, Generation Performance, Chart Icon. Download this PPT design now to present a convincing pitch that not only emphasizes the topic but also showcases your presentation skills.
-
Reward Chart For Kids With Key Performance Metrics Ppt Model Brochure PDF
Showcasing this set of slides titled Reward Chart For Kids With Key Performance Metrics Ppt Model Brochure PDF. The topics addressed in these templates are Good At Sports, Read Book. All the content presented in this PPT design is completely editable. Download it and make adjustments in color, background, font etc. as per your unique business setting.
-
Icon Of Performance Based Incentive In Programs Chart Sample PDF
Persuade your audience using this Icon Of Performance Based Incentive In Programs Chart Sample PDF. This PPT design covers three stages, thus making it a great tool to use. It also caters to a variety of topics including Icon Of Performance, Based Incentive, Programs Chart. Download this PPT design now to present a convincing pitch that not only emphasizes the topic but also showcases your presentation skills.
-
Performance Based Incentive Programs Chart In Food Delivery Industry Rules PDF
This slide represents performance based incentive policy chart in food delivery industry such as workers A, B and C, delivery per day, working hours per day, incentives and monthly wage. Showcasing this set of slides titled Performance Based Incentive Programs Chart In Food Delivery Industry Rules PDF. The topics addressed in these templates are Delivery Industry, Incentive Programs Chart. All the content presented in this PPT design is completely editable. Download it and make adjustments in color, background, font etc. as per your unique business setting.
-
Sales Performance Based Incentive Programs Chart For Various Positions Rules PDF
This slide represents sales performance based incentive policy chart for various positions illustrating employee name, designation, base value, variables, on target earnings etc. Showcasing this set of slides titled Sales Performance Based Incentive Programs Chart For Various Positions Rules PDF. The topics addressed in these templates are Sales Development Representative, Target To Achieve, Target Earning. All the content presented in this PPT design is completely editable. Download it and make adjustments in color, background, font etc. as per your unique business setting.
-
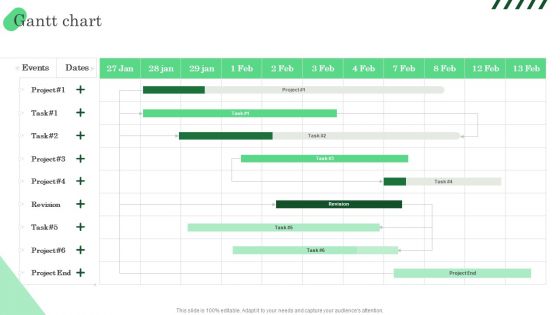
Implementing SEO Strategy To Enhance Business Performance Our SEO Activity Gantt Chart Sample PDF
Purpose of the following slide is to show the weekly gantt chart that provides an overview of the key activities that are to be performed during the process of SEO. The provided table highlights the key campaigns, their additional information and week wise activity. Design a highly optimized project management report using this well-researched Implementing SEO Strategy To Enhance Business Performance Our SEO Activity Gantt Chart Sample PDF. This layout can be used to present the professional details of a task or activity. Showcase the activities allocated to the business executives with this Gantt Chart PowerPoint theme. List down the column tasks in various timeframes and allocate time for each. In addition, also monitor the actual time and make comparisons to interpret the final progress using this innovative Gantt Chart Template. Showcase the work breakdown structure to attract your audience. Download and share it using Google Slides, if it suits your requirement.
-
Managing Unsatisfactory Performance Flow Chart Information PDF
This slide contains the process that is being used for improving the performance of the employee working in the company for the more efficient performance and better workflow.Presenting Managing Unsatisfactory Performance Flow Chart Information PDF to dispense important information. This template comprises one stage. It also presents valuable insights into the topics including Performance Recognized, Enhance Performance, Performance Upgraded. This is a completely customizable PowerPoint theme that can be put to use immediately. So, download it and address the topic impactfully.
-
5 Years Employee Performance Comparative Analysis Chart Icon Ppt Portfolio Objects PDF
Presenting 5 Years Employee Performance Comparative Analysis Chart Icon Ppt Portfolio Objects PDF to dispense important information. This template comprises three stages. It also presents valuable insights into the topics including 5 Years, Employee Performance, Comparative Analysis, Chart Icon. This is a completely customizable PowerPoint theme that can be put to use immediately. So, download it and address the topic impactfully.
-
5 Years Mutual Funds Performance Comparative Analysis Chart Icon Ppt Show Gridlines PDF
Persuade your audience using this 5 Years Mutual Funds Performance Comparative Analysis Chart Icon Ppt Show Gridlines PDF. This PPT design covers three stages, thus making it a great tool to use. It also caters to a variety of topics including 5 Years, Mutual Funds, Performance Comparative, Analysis, Chart Icon. Download this PPT design now to present a convincing pitch that not only emphasizes the topic but also showcases your presentation skills.
-
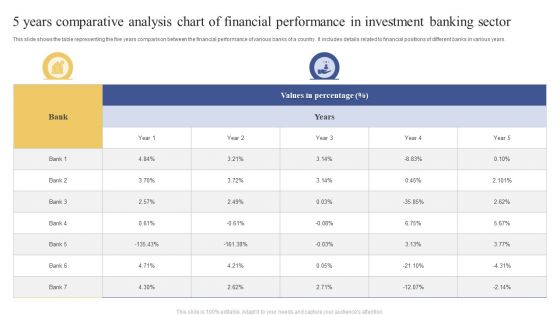
5 Years Comparative Analysis Chart Of Financial Performance In Investment Banking Sector Themes PDF
This slide shows the table representing the five years comparison between the financial performance of various banks of a country. It includes details related to financial positions of different banks in various years. Showcasing this set of slides titled 5 Years Comparative Analysis Chart Of Financial Performance In Investment Banking Sector Themes PDF. The topics addressed in these templates are Values Percentage, Bank, Year. All the content presented in this PPT design is completely editable. Download it and make adjustments in color, background, font etc. as per your unique business setting.
-
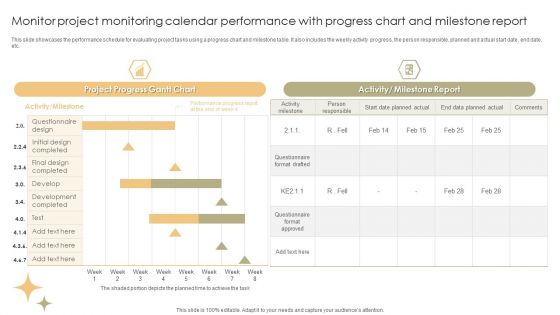
Monitor Project Monitoring Calendar Performance With Progress Chart And Milestone Report Formats PDF
This slide showcases the performance schedule for evaluating project tasks using a progress chart and milestone table. It also includes the weekly activity progress, the person responsible, planned and actual start date, end date, etc. Showcasing this set of slides titled Monitor Project Monitoring Calendar Performance With Progress Chart And Milestone Report Formats PDF. The topics addressed in these templates are Questionnaire Design, Develop, Performance Progress. All the content presented in this PPT design is completely editable. Download it and make adjustments in color, background, font etc. as per your unique business setting.
-
Project Performance Progress Monitoring Calendar Chart Pictures PDF
This slide covers the project performance measurement schedule chart. It includes the project details along with the project status, task assigned to, start date, end date, and duration of completing each task. Showcasing this set of slides titled Project Performance Progress Monitoring Calendar Chart Pictures PDF. The topics addressed in these templates are Plan Risk Management, Project Definition And Planning, Execution. All the content presented in this PPT design is completely editable. Download it and make adjustments in color, background, font etc. as per your unique business setting.
-
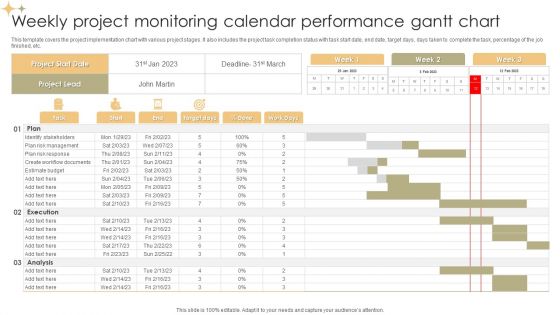
Weekly Project Monitoring Calendar Performance Gantt Chart Formats PDF
This template covers the project implementation chart with various project stages. It also includes the project task completion status with task start date, end date, target days, days taken to complete the task, percentage of the job finished, etc. Showcasing this set of slides titled Weekly Project Monitoring Calendar Performance Gantt Chart Formats PDF. The topics addressed in these templates are Plan, Execution, Analysis. All the content presented in this PPT design is completely editable. Download it and make adjustments in color, background, font etc. as per your unique business setting.
-
Smartphone App Performance Comparison Chart Rules PDF
Showcasing this set of slides titled Smartphone App Performance Comparison Chart Rules PDF. The topics addressed in these templates are Development Speed, Maintenance Cost, Graphical Performance. All the content presented in this PPT design is completely editable. Download it and make adjustments in color, background, font etc. as per your unique business setting.
-
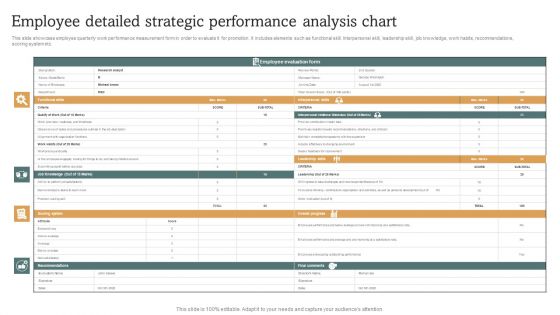
Employee Detailed Strategic Performance Analysis Chart Elements PDF
This slide showcase employee quarterly work performance measurement form in order to evaluate it for promotion. It includes elements such as functional skill. Interpersonal skill, leadership skill, job knowledge, work habits, recommendations, scoring system etc. Showcasing this set of slides titled Employee Detailed Strategic Performance Analysis Chart Elements PDF. The topics addressed in these templates are Employee Evaluation, Interpersonal Skills, Leadership Skills. All the content presented in this PPT design is completely editable. Download it and make adjustments in color, background, font etc. as per your unique business setting.
-
Functional Chart Of Mobile SEO Team Performing Mobile SEO Audit To Analyze Web Traffic Inspiration PDF
The purpose of this slide is to outline a diagrammatic representation of mobile search engine optimization SEO team. The org chart covers information about the teams of director of organic and paid search. Want to ace your presentation in front of a live audience Our Functional Chart Of Mobile SEO Team Performing Mobile SEO Audit To Analyze Web Traffic Inspiration PDF can help you do that by engaging all the users towards you.. Slidegeeks experts have put their efforts and expertise into creating these impeccable powerpoint presentations so that you can communicate your ideas clearly. Moreover, all the templates are customizable, and easy-to-edit and downloadable. Use these for both personal and commercial use.
-
Improvement Of Safety Performance At Construction Site Organizational Chart For Construction Slides PDF
The purpose of the following slide is to showcase the organizational chart for the construction site safety department of the company. It includes information regarding each employees name and associated designation. This Improvement Of Safety Performance At Construction Site Organizational Chart For Construction Slides PDF is perfect for any presentation, be it in front of clients or colleagues. It is a versatile and stylish solution for organizing your meetings. The Improvement Of Safety Performance At Construction Site Organizational Chart For Construction Slides PDF features a modern design for your presentation meetings. The adjustable and customizable slides provide unlimited possibilities for acing up your presentation. Slidegeeks has done all the homework before launching the product for you. So, dont wait, grab the presentation templates today
-
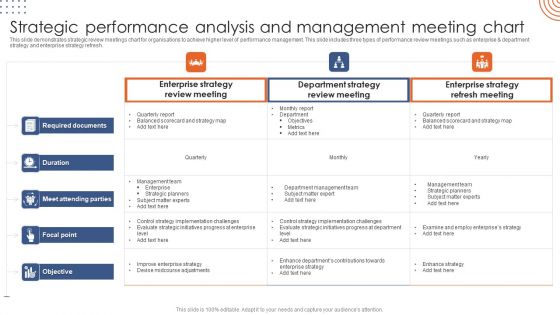
Strategic Performance Analysis And Management Meeting Chart Portrait PDF
This slide demonstrates strategic review meetings chart for organisations to achieve higher level of performance management. This slide includes three types of performance review meetings such as enterprise and department strategy and enterprise strategy refresh. Pitch your topic with ease and precision using this Strategic Performance Analysis And Management Meeting Chart Portrait PDF. This layout presents information on Enterprise Strategy, Review Meeting, Department Strategy. It is also available for immediate download and adjustment. So, changes can be made in the color, design, graphics or any other component to create a unique layout.
-
Input Process Output Technology Performance Chart Icon Information PDF
Presenting Input Process Output Technology Performance Chart Icon Information PDF to dispense important information. This template comprises Three stages. It also presents valuable insights into the topics including Input Process Output, Technology Performance Chart. This is a completely customizable PowerPoint theme that can be put to use immediately. So, download it and address the topic impactfully.
-
Metrics To Measure Results Of Performance Marketing Campaign Ppt PowerPoint Presentation Diagram Graph Charts PDF
This slide showcases metrics that can help organization to track the effectiveness of performance advertisement campaign. Its key components are cost per click, cost per sales, cost per impression and cost per lead Presenting this PowerPoint presentation, titled Metrics To Measure Results Of Performance Marketing Campaign Ppt PowerPoint Presentation Diagram Graph Charts PDF, with topics curated by our researchers after extensive research. This editable presentation is available for immediate download and provides attractive features when used. Download now and captivate your audience. Presenting this Metrics To Measure Results Of Performance Marketing Campaign Ppt PowerPoint Presentation Diagram Graph Charts PDF. Our researchers have carefully researched and created these slides with all aspects taken into consideration. This is a completely customizable Metrics To Measure Results Of Performance Marketing Campaign Ppt PowerPoint Presentation Diagram Graph Charts PDF that is available for immediate downloading. Download now and make an impact on your audience. Highlight the attractive features available with our PPTs.
-
Timeline To Run Performance Marketing Campaign Ppt PowerPoint Presentation Diagram Graph Charts PDF
This slide displays timeline that can help marketers to plan and ensure timely execution of performance marketing campaign. Key elements of this timeline are marketing activity, responsible employee and status The Timeline To Run Performance Marketing Campaign Ppt PowerPoint Presentation Diagram Graph Charts PDF is a compilation of the most recent design trends as a series of slides. It is suitable for any subject or industry presentation, containing attractive visuals and photo spots for businesses to clearly express their messages. This template contains a variety of slides for the user to input data, such as structures to contrast two elements, bullet points, and slides for written information. Slidegeeks is prepared to create an impression.
-
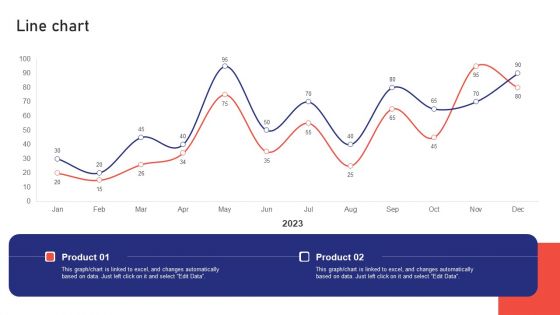
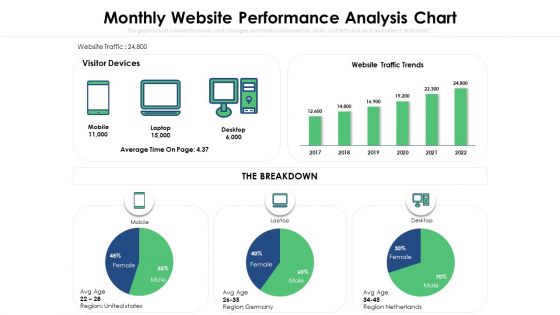
Monthly Website Performance Analysis Chart Ppt PowerPoint Presentation Model Skills PDF
Pitch your topic with ease and precision using this monthly website performance analysis chart ppt powerpoint presentation model skills pdf. This layout presents information on visitor devices, maverage time, the breakdown, laptop, desktop, mobile. It is also available for immediate download and adjustment. So, changes can be made in the color, design, graphics or any other component to create a unique layout.
-
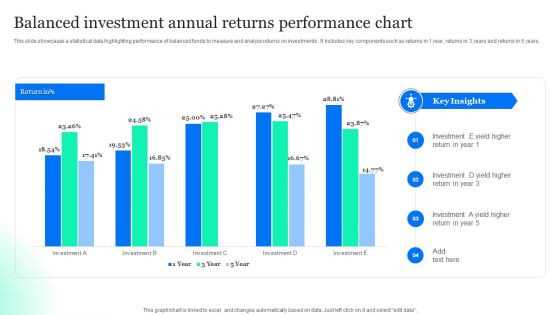
Balanced Investment Annual Returns Performance Chart Designs PDF
This slide showcases a statistical data highlighting performance of balanced funds to measure and analyze returns on investments . It includes key components such as returns in 1 year, returns in 3 years and returns in 5 years. Pitch your topic with ease and precision using this Balanced Investment Annual Returns Performance Chart Designs PDF. This layout presents information on Balanced Investment, Annual Returns, Performance Chart. It is also available for immediate download and adjustment. So, changes can be made in the color, design, graphics or any other component to create a unique layout.
-
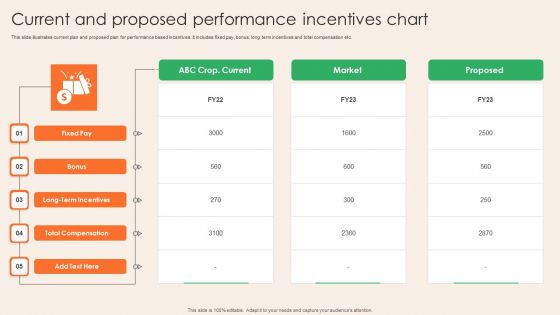
Current And Proposed Performance Incentives Chart Rules PDF
This slide illustrates current plan and proposed plan for performance based incentives. It includes fixed pay, bonus, long term incentives and total compensation etc. Pitch your topic with ease and precision using this Current And Proposed Performance Incentives Chart Rules PDF. This layout presents information on Total Compensation, Current, Market. It is also available for immediate download and adjustment. So, changes can be made in the color, design, graphics or any other component to create a unique layout.
-
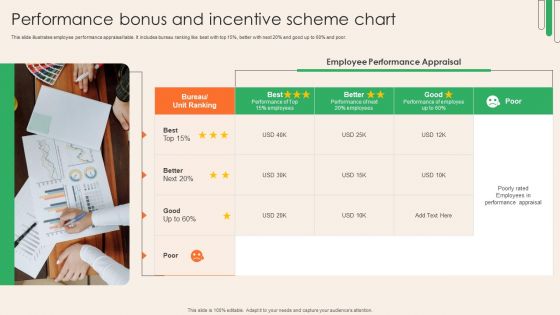
Performance Bonus And Incentive Scheme Chart Mockup PDF
This slide illustrates employee performance appraisal table. It includes bureau ranking like best with top 15 percent, better with next 20 percentand good up to 60 percent and poor. Presenting Performance Bonus And Incentive Scheme Chart Mockup PDF to dispense important information. This template comprises one stages. It also presents valuable insights into the topics including Employee Performance, Scheme Chart, Performance. This is a completely customizable PowerPoint theme that can be put to use immediately. So, download it and address the topic impactfully.
-
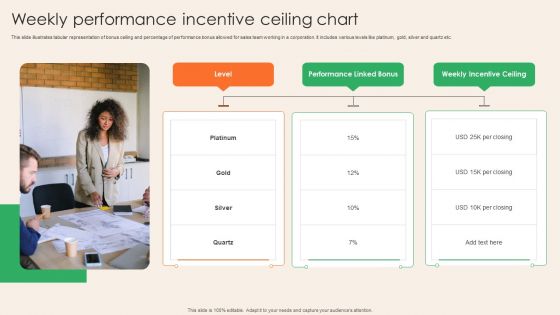
Weekly Performance Incentive Ceiling Chart Demonstration PDF
This slide illustrates tabular representation of bonus ceiling and percentage of performance bonus allowed for sales team working in a corporation. It includes various levels like platinum, gold, silver and quartz etc. Presenting Weekly Performance Incentive Ceiling Chart Demonstration PDF to dispense important information. This template comprises one stages. It also presents valuable insights into the topics including Level, Performance, Incentive Ceiling. This is a completely customizable PowerPoint theme that can be put to use immediately. So, download it and address the topic impactfully.
-
Increasing ROI And Business Performance Using Local Listing And SEO Strategy Gantt Chart Themes PDF
Get a simple yet stunning designed Increasing ROI And Business Performance Using Local Listing And SEO Strategy Gantt Chart Themes PDF. It is the best one to establish the tone in your meetings. It is an excellent way to make your presentations highly effective. So, download this PPT today from Slidegeeks and see the positive impacts. Our easy to edit Increasing ROI And Business Performance Using Local Listing And SEO Strategy Gantt Chart Themes PDF can be your go to option for all upcoming conferences and meetings. So, what are you waiting for Grab this template today.
-
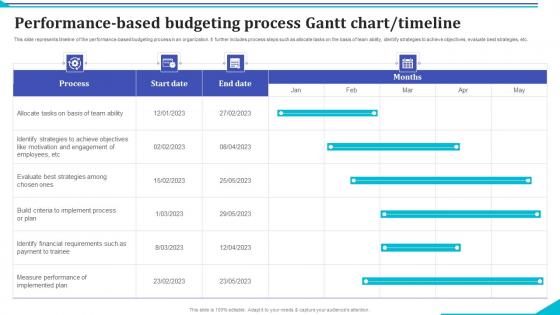
Performance Based Budgeting Process Gantt Chart Timeline Rules Pdf
This slide represents timeline of the performance based budgeting process in an organization. It further includes process steps such as allocate tasks on the basis of team ability, identify strategies to achieve objectives, evaluate best strategies, etc.Showcasing this set of slides titled Performance Based Budgeting Process Gantt Chart Timeline Rules Pdf The topics addressed in these templates are Build Criteria, Implement Process, Identify Financial Requirements, Payment Trainee All the content presented in this PPT design is completely editable. Download it and make adjustments in color, background, font etc. as per your unique business setting.
-
Operations Workflow Chart Business Performance Optimization New Operations Strategy Sample Pdf
Presenting this PowerPoint presentation, titled Operations Workflow Chart Business Performance Optimization New Operations Strategy Sample Pdf, with topics curated by our researchers after extensive research. This editable presentation is available for immediate download and provides attractive features when used. Download now and captivate your audience. Presenting this Operations Workflow Chart Business Performance Optimization New Operations Strategy Sample Pdf. Our researchers have carefully researched and created these slides with all aspects taken into consideration. This is a completely customizable Operations Workflow Chart Business Performance Optimization New Operations Strategy Sample Pdf that is available for immediate downloading. Download now and make an impact on your audience. Highlight the attractive features available with our PPTs.
-
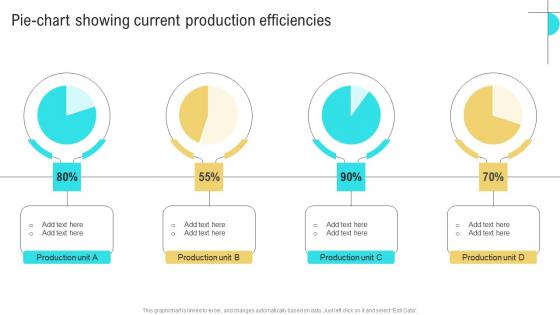
Pie Chart Showing Current Business Performance Optimization New Operations Strategy Portrait Pdf
Here you can discover an assortment of the finest PowerPoint and Google Slides templates. With these templates, you can create presentations for a variety of purposes while simultaneously providing your audience with an eye catching visual experience. Download Pie Chart Showing Current Business Performance Optimization New Operations Strategy Portrait Pdf to deliver an impeccable presentation. These templates will make your job of preparing presentations much quicker, yet still, maintain a high level of quality. Slidegeeks has experienced researchers who prepare these templates and write high quality content for you. Later on, you can personalize the content by editing the Pie Chart Showing Current Business Performance Optimization New Operations Strategy Portrait Pdf.
-
Performance Internet Chart In Powerpoint And Google Slides Cpb
Introducing our well designed Performance Internet Chart In Powerpoint And Google Slides Cpb. This PowerPoint design presents information on topics like Performance Internet Chart. As it is predesigned it helps boost your confidence level. It also makes you a better presenter because of its high quality content and graphics. This PPT layout can be downloaded and used in different formats like PDF, PNG, and JPG. Not only this, it is available in both Standard Screen and Widescreen aspect ratios for your convenience. Therefore, click on the download button now to persuade and impress your audience.


