Per transaction PowerPoint Presentation Templates and Google Slides
-
KPI Data Of Warehouse Showing Transaction Per Hour And Value Rules PDF
Showcasing this set of slides titled KPI Data Of Warehouse Showing Transaction Per Hour And Value Rules PDF The topics addressed in these templates are Total Value Of Day, Transaction By Value, Total Value Of Location All the content presented in this PPT design is completely editable. Download it and make adjustments in color, background, font etc. as per your unique business setting.
-
Average Transactional Value Per User In Fintech Market Download PDF
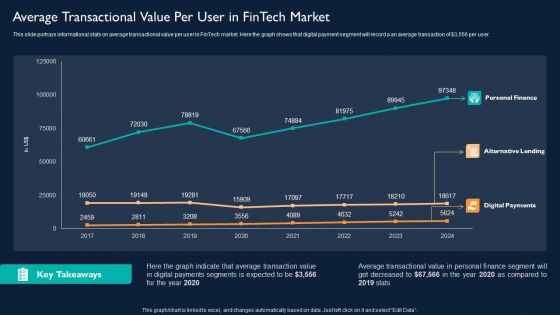
This slide portrays informational stats on average transactional value per user in FinTech market. Here the graph shows that digital payment segment will record a an average transaction of dollar 3,556 per user. Deliver and pitch your topic in the best possible manner with this Average Transactional Value Per User In Fintech Market Download PDF. Use them to share invaluable insights on Digital Payments Segments, Average Transaction Value, Finance and impress your audience. This template can be altered and modified as per your expectations. So, grab it now.
-
Average Transactional Value Per User In Fintech Market Investment In Latest Technology To Ensure Guidelines PDF
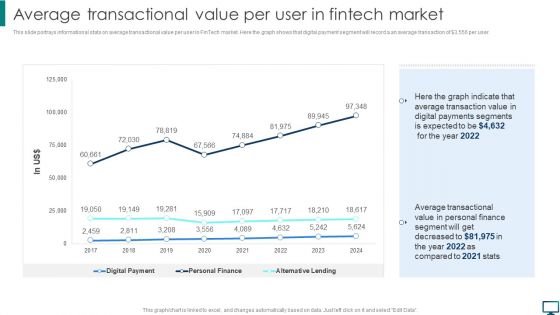
This slide portrays informational stats on average transactional value per user in FinTech market. Here the graph shows that digital payment segment will record a an average transaction of dollar3,precentprecent6 per user.Here you can discover an assortment of the finest PowerPoint and Google Slides templates. With these templates, you can create presentations for a variety of purposes while simultaneously providing your audience with an eye-catching visual experience. Download Average Transactional Value Per User In Fintech Market Investment In Latest Technology To Ensure Guidelines PDF to deliver an impeccable presentation. These templates will make your job of preparing presentations much quicker, yet still, maintain a high level of quality. Slidegeeks has experienced researchers who prepare these templates and write high-quality content for you. Later on, you can personalize the content by editing the Average Transactional Value Per User In Fintech Market Investment In Latest Technology To Ensure Guidelines PDF.
-
Average Transactional Value Per User In Fintech Market Guidelines PDF
This slide portrays informational stats on average transactional value per user in FinTech market. Here the graph shows that digital payment segment will record a an average transaction of dollar 3,556 per user. Here you can discover an assortment of the finest PowerPoint and Google Slides templates. With these templates, you can create presentations for a variety of purposes while simultaneously providing your audience with an eye-catching visual experience. Download Average Transactional Value Per User In Fintech Market Guidelines PDF to deliver an impeccable presentation. These templates will make your job of preparing presentations much quicker, yet still, maintain a high level of quality. Slidegeeks has experienced researchers who prepare these templates and write high quality content for you. Later on, you can personalize the content by editing the Average Transactional Value Per User In Fintech Market Guidelines PDF.
-
Optimizing And Managing Retail Assessing Average Transaction Size And Units Per Slides PDF
Mentioned graph illustrates informational stats about average transaction size and units per customer of the firm in 2023. Here the graphs indicates that average transaction price recorded in 2023 is dollar 61.9. Slidegeeks is one of the best resources for PowerPoint templates. You can download easily and regulate Optimizing And Managing Retail Assessing Average Transaction Size And Units Per Slides PDF for your personal presentations from our wonderful collection. A few clicks is all it takes to discover and get the most relevant and appropriate templates. Use our Templates to add a unique zing and appeal to your presentation and meetings. All the slides are easy to edit and you can use them even for advertisement purposes.
-
Investing In Tech Innovation Average Transactional Value Per User In Fintech Market Graphics PDF
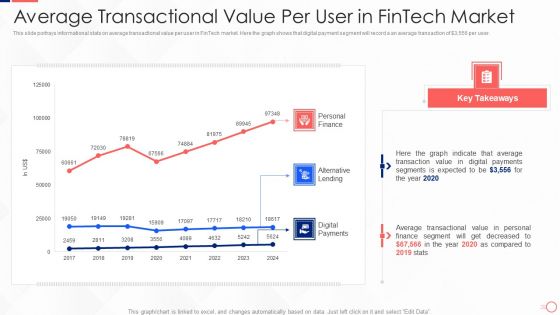
This slide portrays informational stats on average transactional value per user in FinTech market. Here the graph shows that digital payment segment will record a an average transaction of Dollar 3,556 per user. Deliver and pitch your topic in the best possible manner with this Investing In Tech Innovation Average Transactional Value Per User In Fintech Market Graphics PDF. Use them to share invaluable insights on Personal Finance, Alternative Lending, Digital Payments and impress your audience. This template can be altered and modified as per your expectations. So, grab it now.
-
Blockchain Technology Comparative Assessment Table With Cost Per Transaction Guidelines PDF
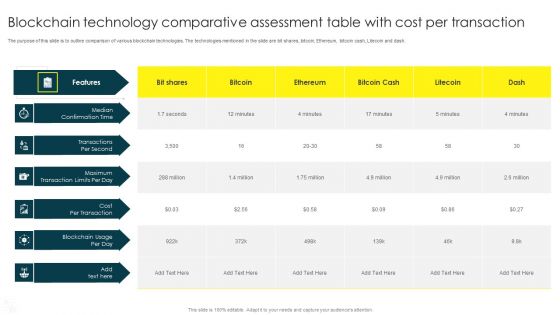
The purpose of this slide is to outline comparison of various blockchain technologies. The technologies mentioned in the slide are bit shares, bitcoin, Ethereum, bitcoin cash, Litecoin and dash. Pitch your topic with ease and precision using this Blockchain Technology Comparative Assessment Table With Cost Per Transaction Guidelines PDF. This layout presents information on Median Confirmation Time, Transactions Per Second, Cost Per Transaction. It is also available for immediate download and adjustment. So, changes can be made in the color, design, graphics or any other component to create a unique layout.


