Optimization dashboard PowerPoint Presentation Templates and Google Slides
-
Techniques To Optimize Business Performance Dashboard To Evaluate Display Advertising Inspiration Pdf
This slide provides a dashboard to assess the rate of conversion and cost of display advertising campaign by different sources. It includes source, average cost of marketing, conversion, click, revenue, impression by source. Find highly impressive Techniques To Optimize Business Performance Dashboard To Evaluate Display Advertising Inspiration Pdf on Slidegeeks to deliver a meaningful presentation. You can save an ample amount of time using these presentation templates. No need to worry to prepare everything from scratch because Slidegeeks experts have already done a huge research and work for you. You need to download Techniques To Optimize Business Performance Dashboard To Evaluate Display Advertising Inspiration Pdf for your upcoming presentation. All the presentation templates are 100 percent editable and you can change the color and personalize the content accordingly. Download now.
-
Techniques To Optimize Business Performance Dashboard To Measure Display Advertising Icons Pdf
This slide provides a dashboard to monitor the display advertising campaign performance in order to reduce overall marketing cost. It incorporates advertising cost, average number of clicks and impressions, clicks per day, revenue by campaign, etc. If your project calls for a presentation, then Slidegeeks is your go-to partner because we have professionally designed, easy-to-edit templates that are perfect for any presentation. After downloading, you can easily edit Techniques To Optimize Business Performance Dashboard To Measure Display Advertising Icons Pdf and make the changes accordingly. You can rearrange slides or fill them with different images. Check out all the handy templates
-
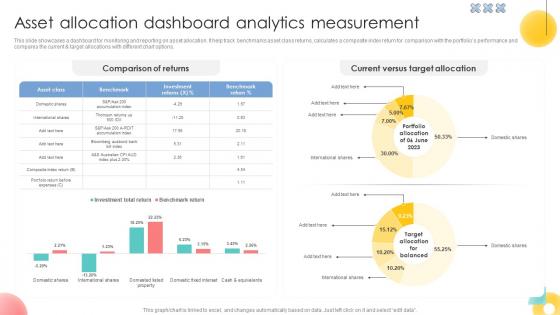
Asset Allocation Dashboard Analytics Measurement Strategic Investment Plan For Optimizing Risk SS V
This slide showcases a dashboard for monitoring and reporting on asset allocation. It help track benchmarks asset class returns, calculates a composite index return for comparison with the portfolios performance and compares the current and target allocations with different chart options.Slidegeeks is one of the best resources for PowerPoint templates. You can download easily and regulate Asset Allocation Dashboard Analytics Measurement Strategic Investment Plan For Optimizing Risk SS V for your personal presentations from our wonderful collection. A few clicks is all it takes to discover and get the most relevant and appropriate templates. Use our Templates to add a unique zing and appeal to your presentation and meetings. All the slides are easy to edit and you can use them even for advertisement purposes.
-
Equity Asset Allocation Dashboard Analytics Strategic Investment Plan For Optimizing Risk SS V
This slide represents an equity asset allocation dashboard to measure and manage the performance of equity overtime. It tracks KPIs such as, average position size, market cap distribution, average PE distribution, ratio and yield, by geography, industry, currency and holding lists.If your project calls for a presentation, then Slidegeeks is your go-to partner because we have professionally designed, easy-to-edit templates that are perfect for any presentation. After downloading, you can easily edit Equity Asset Allocation Dashboard Analytics Strategic Investment Plan For Optimizing Risk SS V and make the changes accordingly. You can rearrange slides or fill them with different images. Check out all the handy templates
-
Erp Management Dashboard To Optimize Marketing Erp And Digital Transformation For Maximizing DT SS V
This slide present an ERP management dashboard to help monitor the sales and marketing initiatives and boost business performance. It tracks sales overview, visitors, and campaign performance.This Erp Management Dashboard To Optimize Marketing Erp And Digital Transformation For Maximizing DT SS V from Slidegeeks makes it easy to present information on your topic with precision. It provides customization options, so you can make changes to the colors, design, graphics, or any other component to create a unique layout. It is also available for immediate download, so you can begin using it right away. Slidegeeks has done good research to ensure that you have everything you need to make your presentation stand out. Make a name out there for a brilliant performance.
-
Predictive Maintained Dashboard To Determine Engine Details Optimizing Inventory Management IoT SS V
This slide provides an overview of the predictive maintenance dashboard used to track engine status. The dashboard includes normal, warning and critical engines, optimal condition, etc. Explore a selection of the finest Predictive Maintained Dashboard To Determine Engine Details Optimizing Inventory Management IoT SS V here. With a plethora of professionally designed and pre-made slide templates, you can quickly and easily find the right one for your upcoming presentation. You can use our Predictive Maintained Dashboard To Determine Engine Details Optimizing Inventory Management IoT SS V to effectively convey your message to a wider audience. Slidegeeks has done a lot of research before preparing these presentation templates. The content can be personalized and the slides are highly editable. Grab templates today from Slidegeeks.
-
Warehouse Dashboard To Measure And Track Monthly Orders Optimizing Inventory Management IoT SS V
This slide provides an overview of the dashboard that helps in warehouse management. The dashboard includes orders received, processing and returns. Want to ace your presentation in front of a live audience Our Warehouse Dashboard To Measure And Track Monthly Orders Optimizing Inventory Management IoT SS V can help you do that by engaging all the users towards you. Slidegeeks experts have put their efforts and expertise into creating these impeccable powerpoint presentations so that you can communicate your ideas clearly. Moreover, all the templates are customizable, and easy-to-edit and downloadable. Use these for both personal and commercial use.
-
Salon Marketing Plan To Optimize Dashboard Monitoring Sales And Revenue Strategy SS V
This slide presents a dashboard tracking revenue and sales by products and services. It includes KPIs such as revenue by service and products, units sold, monthly revenue. Formulating a presentation can take up a lot of effort and time, so the content and message should always be the primary focus. The visuals of the PowerPoint can enhance the presenters message, so our Salon Marketing Plan To Optimize Dashboard Monitoring Sales And Revenue Strategy SS V was created to help save time. Instead of worrying about the design, the presenter can concentrate on the message while our designers work on creating the ideal templates for whatever situation is needed. Slidegeeks has experts for everything from amazing designs to valuable content, we have put everything into Salon Marketing Plan To Optimize Dashboard Monitoring Sales And Revenue Strategy SS V.
-
Salon Marketing Plan To Optimize Loyalty Program Analytics Dashboard To Track Strategy SS V
This slide showcases a dashboard highlighting the salon registration rates through loyalty programs. It includes information about new members, registration, registration rate, members active, spending, visits and spend per year. Get a simple yet stunning designed Salon Marketing Plan To Optimize Loyalty Program Analytics Dashboard To Track Strategy SS V. It is the best one to establish the tone in your meetings. It is an excellent way to make your presentations highly effective. So, download this PPT today from Slidegeeks and see the positive impacts. Our easy-to-edit Salon Marketing Plan To Optimize Loyalty Program Analytics Dashboard To Track Strategy SS V can be your go-to option for all upcoming conferences and meetings. So, what are you waiting for Grab this template today.
-
Salon Marketing Plan To Optimize Website Analytics Dashboard To Monitor Strategy SS V
This slide represent a website analytics dashboard tracking online traffic and appointments. It includes KPIs such as visitors count, purchasers count, booked appointments, forecasted booking count by month, visitor-to-customer conversion trend, customer acquisition through channels and visitors count by categories. Here you can discover an assortment of the finest PowerPoint and Google Slides templates. With these templates, you can create presentations for a variety of purposes while simultaneously providing your audience with an eye-catching visual experience. Download Salon Marketing Plan To Optimize Website Analytics Dashboard To Monitor Strategy SS V to deliver an impeccable presentation. These templates will make your job of preparing presentations much quicker, yet still, maintain a high level of quality. Slidegeeks has experienced researchers who prepare these templates and write high-quality content for you. Later on, you can personalize the content by editing the Salon Marketing Plan To Optimize Website Analytics Dashboard To Monitor Strategy SS V.
-
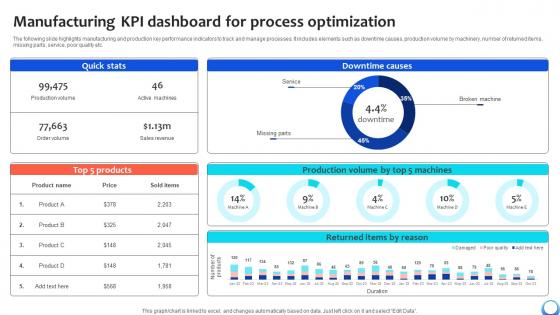
Manufacturing KPI Dashboard For Process Optimization Automating Production Process Strategy SS V
The following slide highlights manufacturing and production key performance indicators to track and manage processes. It includes elements such as downtime causes, production volume by machinery, number of returned items, missing parts, service, poor quality etc. Formulating a presentation can take up a lot of effort and time, so the content and message should always be the primary focus. The visuals of the PowerPoint can enhance the presenters message, so our Manufacturing KPI Dashboard For Process Optimization Automating Production Process Strategy SS V was created to help save time. Instead of worrying about the design, the presenter can concentrate on the message while our designers work on creating the ideal templates for whatever situation is needed. Slidegeeks has experts for everything from amazing designs to valuable content, we have put everything into Manufacturing KPI Dashboard For Process Optimization Automating Production Process Strategy SS V
-
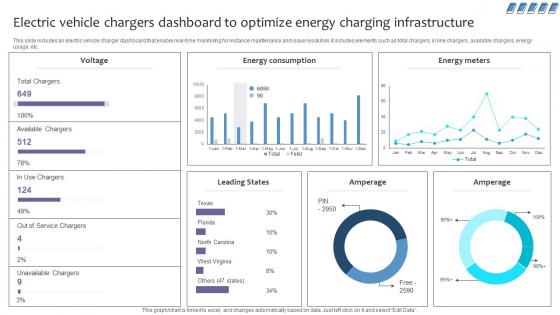
Empowering The Future Electric Vehicle Chargers Dashboard To Optimize Energy IoT SS V
This slide includes an electric vehicle charger dashboard that enable real-time monitoring for instance maintenance and issue resolution.it includes elements such as total chargers, in line chargers, available chargers, energy usage, etc. If you are looking for a format to display your unique thoughts, then the professionally designed Empowering The Future Electric Vehicle Chargers Dashboard To Optimize Energy IoT SS V is the one for you. You can use it as a Google Slides template or a PowerPoint template. Incorporate impressive visuals, symbols, images, and other charts. Modify or reorganize the text boxes as you desire. Experiment with shade schemes and font pairings. Alter, share or cooperate with other people on your work. Download Empowering The Future Electric Vehicle Chargers Dashboard To Optimize Energy IoT SS V and find out how to give a successful presentation. Present a perfect display to your team and make your presentation unforgettable.
-
Dashboard Analytics Measuring Supply Chain Efficiency Optimizing Retail Operations With Digital DT SS V
This slide represents a supply chain management dashboard measuring the efficiency of supply chain operations after effective digital transformation of retail operations. It includes inventory to sales, inventory turnover, carrying cost of inventory, inventory accuracy, and percentage out of stock items.If you are looking for a format to display your unique thoughts, then the professionally designed Dashboard Analytics Measuring Supply Chain Efficiency Optimizing Retail Operations With Digital DT SS V is the one for you. You can use it as a Google Slides template or a PowerPoint template. Incorporate impressive visuals, symbols, images, and other charts. Modify or reorganize the text boxes as you desire. Experiment with shade schemes and font pairings. Alter, share or cooperate with other people on your work. Download Dashboard Analytics Measuring Supply Chain Efficiency Optimizing Retail Operations With Digital DT SS V and find out how to give a successful presentation. Present a perfect display to your team and make your presentation unforgettable.
-
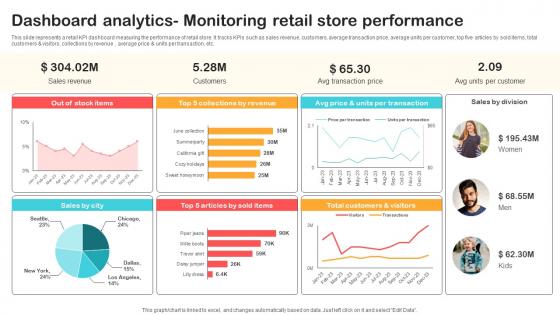
Dashboard Analytics Monitoring Retail Store Performance Optimizing Retail Operations With Digital DT SS V
This slide represents a retail KPI dashboard measuring the performance of retail store. It tracks KPIs such as sales revenue, customers, average transaction price, average units per customer, top five articles by sold items, total customers and visitors, collections by revenue , average price and units per transaction, etc.Are you in need of a template that can accommodate all of your creative concepts This one is crafted professionally and can be altered to fit any style. Use it with Google Slides or PowerPoint. Include striking photographs, symbols, depictions, and other visuals. Fill, move around, or remove text boxes as desired. Test out color palettes and font mixtures. Edit and save your work, or work with colleagues. Download Dashboard Analytics Monitoring Retail Store Performance Optimizing Retail Operations With Digital DT SS V and observe how to make your presentation outstanding. Give an impeccable presentation to your group and make your presentation unforgettable.


