Monthly Dashboard PowerPoint Presentation Templates and Google Slides
-
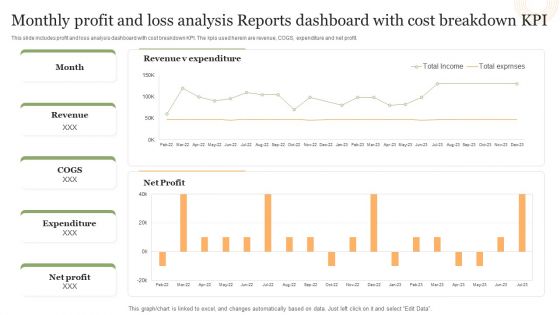
Monthly Profit And Loss Analysis Reports Dashboard With Cost Breakdown Kpi Structure PDF
This slide includes profit and loss analysis dashboard with cost breakdown KPI. The kpis used herein are revenue, COGS, expenditure and net profit.Pitch your topic with ease and precision using this Monthly Profit And Loss Analysis Reports Dashboard With Cost Breakdown Kpi Structure PDF. This layout presents information on Revenue Expenditure, Net Profit, Total Exprnses. It is also available for immediate download and adjustment. So, changes can be made in the color, design, graphics or any other component to create a unique layout.
-
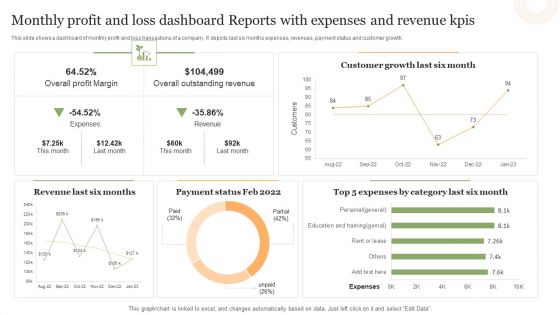
Monthly Profit And Loss Dashboard Reports With Expenses And Revenue Kpis Portrait PDF
This slide shows a dashboard of monthly profit and loss transactions of a company. It depicts last six months expenses, revenues, payment status and customer growth.Showcasing this set of slides titled Monthly Profit And Loss Dashboard Reports With Expenses And Revenue Kpis Portrait PDF. The topics addressed in these templates are Overall Profit Margin, Overall Outstanding Revenue, Customer Growth. All the content presented in this PPT design is completely editable. Download it and make adjustments in color, background, font etc. as per your unique business setting.
-
Monthly Profit And Loss Statement Reports Analysis Dashboard Brochure PDF
This slide shows a monthly profit and loss statement dashboard. The constituting elements herein are total net revenue, cost of goods sold and gross profit.Pitch your topic with ease and precision using this Monthly Profit And Loss Statement Reports Analysis Dashboard Brochure PDF. This layout presents information on Costs Good Sold, Earnings Before, Interest Expense. It is also available for immediate download and adjustment. So, changes can be made in the color, design, graphics or any other component to create a unique layout.
-
Integration Automation Dashboard For Monthly Procurement Process Automated Introduction PDF
This slide presents a dashboard for monthly procurement activities in an organization. It includes number of suppliers, contract attainted, supplier share, top supplier report, average procurement cycle time, etc. Slidegeeks is here to make your presentations a breeze with Integration Automation Dashboard For Monthly Procurement Process Automated Introduction PDF With our easy-to-use and customizable templates, you can focus on delivering your ideas rather than worrying about formatting. With a variety of designs to choose from, youre sure to find one that suits your needs. And with animations and unique photos, illustrations, and fonts, you can make your presentation pop. So whether youre giving a sales pitch or presenting to the board, make sure to check out Slidegeeks first.
-
Monthly Automobile Insurance Policies Status Dashboard Themes PDF
Showcasing this set of slides titled Monthly Automobile Insurance Policies Status Dashboard Themes PDF. The topics addressed in these templates are Monthly Automobile, Insurance Policies, Status Dashboard. All the content presented in this PPT design is completely editable. Download it and make adjustments in color, background, font etc. as per your unique business setting.
-
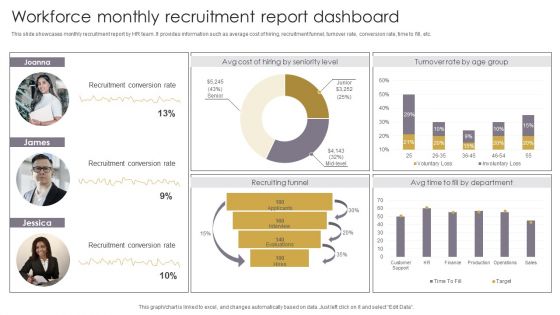
Workforce Monthly Recruitment Report Dashboard Themes PDF
This slide showcases monthly recruitment report by HR team. It provides information such as average cost of hiring, recruitment funnel, turnover rate, conversion rate, time to fill, etc. Pitch your topic with ease and precision using this Workforce Monthly Recruitment Report Dashboard Themes PDF. This layout presents information on Recruiting Funnel, Recruitment Conversion Rate, Recruitment Report Dashboard. It is also available for immediate download and adjustment. So, changes can be made in the color, design, graphics or any other component to create a unique layout.
-
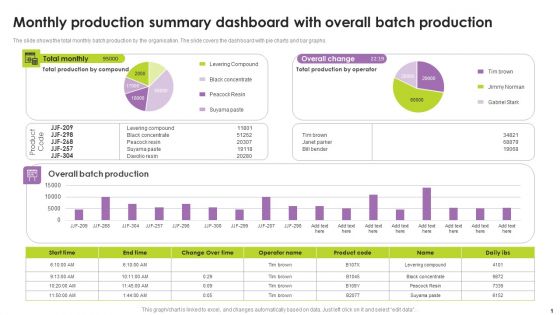
Monthly Production Summary Dashboard With Overall Batch Production Portrait PDF
The slide shows the total monthly batch production by the organisation. The slide covers the dashboard with pie charts and bar graphs. Showcasing this set of slides titled Monthly Production Summary Dashboard With Overall Batch Production Portrait PDF. The topics addressed in these templates are Monthly Production Summary Dashboard, Overall Batch Production. All the content presented in this PPT design is completely editable. Download it and make adjustments in color, background, font etc. as per your unique business setting.
-
Monthly Production Summary Monitoring And Analysis Dashboard Guidelines PDF
The slide shows the monitoring and analysis dashboard of monthly production. The slide covers run-time and down time comparison, production cost of last 12 months, and overall equipment effectiveness. Showcasing this set of slides titled Monthly Production Summary Monitoring And Analysis Dashboard Guidelines PDF. The topics addressed in these templates are Availability, Rework Quantity, Manufacturing Cost. All the content presented in this PPT design is completely editable. Download it and make adjustments in color, background, font etc. as per your unique business setting.
-
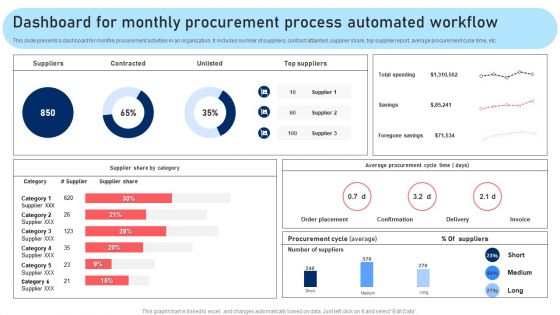
Dashboard For Monthly Procurement Process Automated Workflow Microsoft PDF
This slide presents a dashboard for monthly procurement activities in an organization. It includes number of suppliers, contract attainted, supplier share, top supplier report, average procurement cycle time, etc. Presenting this PowerPoint presentation, titled Dashboard For Monthly Procurement Process Automated Workflow Microsoft PDF, with topics curated by our researchers after extensive research. This editable presentation is available for immediate download and provides attractive features when used. Download now and captivate your audience. Presenting this Dashboard For Monthly Procurement Process Automated Workflow Microsoft PDF. Our researchers have carefully researched and created these slides with all aspects taken into consideration. This is a completely customizable Dashboard For Monthly Procurement Process Automated Workflow Microsoft PDF that is available for immediate downloading. Download now and make an impact on your audience. Highlight the attractive features available with our PPTs.
-
Monthly Earning Breakup Dashboard With Customer Growth Analysis Infographics PDF
Showcasing this set of slides titled Monthly Earning Breakup Dashboard With Customer Growth Analysis Infographics PDF. The topics addressed in these templates are Breakup Dashboard, Customer Growth Analysis. All the content presented in this PPT design is completely editable. Download it and make adjustments in color, background, font etc. as per your unique business setting.
-
Streamlining Manufacturing Processes With Workflow Automation Dashboard For Monthly Procurement Process Automated Workflow Icons PDF
This slide presents a dashboard for monthly procurement activities in an organization. It includes number of suppliers, contract attainted, supplier share, top supplier report, average procurement cycle time, etc. Slidegeeks is here to make your presentations a breeze with Streamlining Manufacturing Processes With Workflow Automation Dashboard For Monthly Procurement Process Automated Workflow Icons PDF With our easy-to-use and customizable templates, you can focus on delivering your ideas rather than worrying about formatting. With a variety of designs to choose from, you are sure to find one that suits your needs. And with animations and unique photos, illustrations, and fonts, you can make your presentation pop. So whether you are giving a sales pitch or presenting to the board, make sure to check out Slidegeeks first
-
Monthly Leads Report And Customer Relationship Management Dashboard With Revenue Information PDF
This slide illustrates graphical representation of CRM leads data. It includes revenue, open leads, won leads, cold leads, monthly leads report and leads dough nut graph etc. Pitch your topic with ease and precision using this Monthly Leads Report And Customer Relationship Management Dashboard With Revenue Information PDF. This layout presents information on Monthly Leads Report, Customer Relationship Management, Dashboard With Revenue. It is also available for immediate download and adjustment. So, changes can be made in the color, design, graphics or any other component to create a unique layout.
-
Monthly Comparison Dashboard For Lead Tracking Sample PDF
This slide showcases dashboard that can help organization to compare the leads converted in different months and make changes in sales and marketing campaigns . Its key components lead generated by country, by industry type and lead sources by month. Showcasing this set of slides titled Monthly Comparison Dashboard For Lead Tracking Sample PDF. The topics addressed in these templates are Leads Received, Industry Type, Lead Generated. All the content presented in this PPT design is completely editable. Download it and make adjustments in color, background, font etc. as per your unique business setting.
-
Sales Monitoring Dashboard With Monthly Qualified Leads Guidelines PDF
This slide showcases dashboard that can help organization to monitor the sales pipeline velocity and predict future sales more accurately plus increase the leads converted. Its key components are monthly qualified leads, win rate based on deal size, monthly sales cycle and number of leads at each stage of pipeline. Pitch your topic with ease and precision using this Sales Monitoring Dashboard With Monthly Qualified Leads Guidelines PDF. This layout presents information on Monthly Qualified, Monthly Sales Cycle, Deal Size. It is also available for immediate download and adjustment. So, changes can be made in the color, design, graphics or any other component to create a unique layout.
-
Logistics Management Dashboard With Monthly Key Performance Indicators Rules PDF
This slide showcases status dashboard for shipping that can help organization to calculate accurate shipping information and identify latest tracking updates. Its key components are order status, volume today, global financial performance, inventory and monthly KPIs. Pitch your topic with ease and precision using this Logistics Management Dashboard With Monthly Key Performance Indicators Rules PDF. This layout presents information on Orders, Inventory, Kpis Monthly. It is also available for immediate download and adjustment. So, changes can be made in the color, design, graphics or any other component to create a unique layout.
-
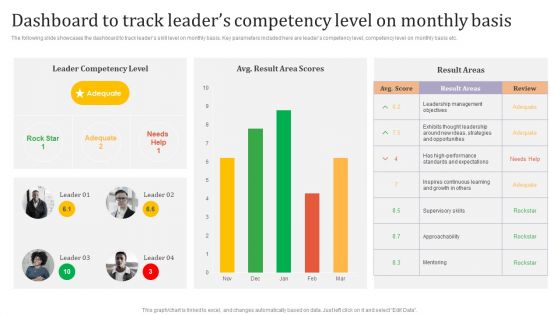
Dashboard To Track Leaders Competency Level On Monthly Basis Ppt Gallery Vector PDF
The following slide showcases the dashboard to track leaders skill level on monthly basis. Key parameters included here are leaders competency level, competency level on monthly basis etc. There are so many reasons you need a Dashboard To Track Leaders Competency Level On Monthly Basis Ppt Gallery Vector PDF. The first reason is you cannot spend time making everything from scratch, Thus, Slidegeeks has made presentation templates for you too. You can easily download these templates from our website easily.
-
Deployment Of Process Automation To Increase Organisational Performance Dashboard For Monthly Graphics PDF
This slide presents a dashboard for monthly procurement activities in an organization. It includes number of suppliers, contract attainted, supplier share, top supplier report, average procurement cycle time, etc. Here you can discover an assortment of the finest PowerPoint and Google Slides templates. With these templates, you can create presentations for a variety of purposes while simultaneously providing your audience with an eye catching visual experience. Download Deployment Of Process Automation To Increase Organisational Performance Dashboard For Monthly Graphics PDF to deliver an impeccable presentation. These templates will make your job of preparing presentations much quicker, yet still, maintain a high level of quality. Slidegeeks has experienced researchers who prepare these templates and write high quality content for you. Later on, you can personalize the content by editing the Deployment Of Process Automation To Increase Organisational Performance Dashboard For Monthly Graphics PDF.
-
Monthly Sales KPI Dashboard For Tracking Brand Recommendation Progress Background PDF
Following slide demonstrates key performance indicator dashboard for tracking monthly sales to monitor business performance. It includes components such as monthly execution cost, sales, state wise events, Brand market, and programs. Showcasing this set of slides titled Monthly Sales KPI Dashboard For Tracking Brand Recommendation Progress Background PDF. The topics addressed in these templates are Products Sold, Engagements, Events, Active Markets, Sampled, Attendance. All the content presented in this PPT design is completely editable. Download it and make adjustments in color, background, font etc. as per your unique business setting.
-
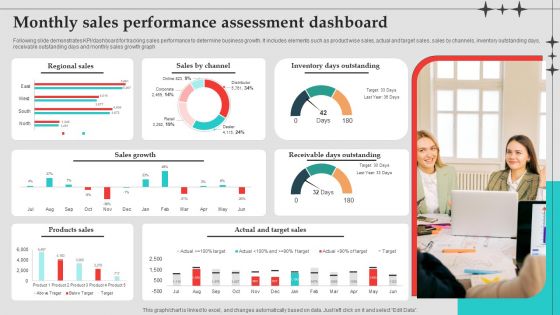
Monthly Sales Performance Assessment Dashboard Download PDF
Following slide demonstrates KPI or dashboard for tracking sales performance to determine business growth. It includes elements such as product wise sales, actual and target sales, sales by channels, inventory outstanding days, receivable outstanding days and monthly sales growth graph. Showcasing this set of slides titled Monthly Sales Performance Assessment Dashboard Download PDF. The topics addressed in these templates are Sales Growth, Inventory Days Outstanding, Target Sales. All the content presented in this PPT design is completely editable. Download it and make adjustments in color, background, font etc. as per your unique business setting.
-
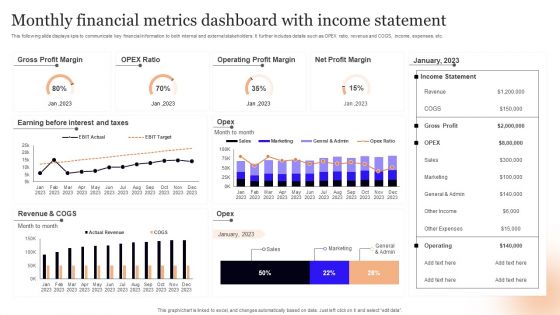
Monthly Financial Metrics Dashboard With Income Statement Infographics PDF
This following slide displays kpis to communicate key financial information to both internal and external stakeholders. It further includes details such as OPEX ratio, revenue and COGS, income, expenses, etc. Showcasing this set of slides titled Monthly Financial Metrics Dashboard With Income Statement Infographics PDF. The topics addressed in these templates are Gross Profit Margin, Taxes, Revenue. All the content presented in this PPT design is completely editable. Download it and make adjustments in color, background, font etc. as per your unique business setting.
-
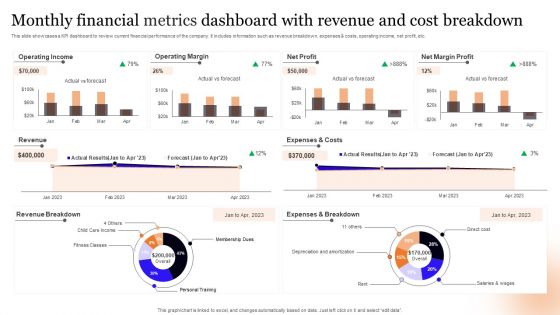
Monthly Financial Metrics Dashboard With Revenue And Cost Breakdown Information PDF
This slide showcases a KPI dashboard to review current financial performance of the company. It includes information such as revenue breakdown, expenses and costs, operating income, net profit, etc. Pitch your topic with ease and precision using this Monthly Financial Metrics Dashboard With Revenue And Cost Breakdown Information PDF. This layout presents information on Operating Income, Operating Margin, Net Profit. It is also available for immediate download and adjustment. So, changes can be made in the color, design, graphics or any other component to create a unique layout.
-
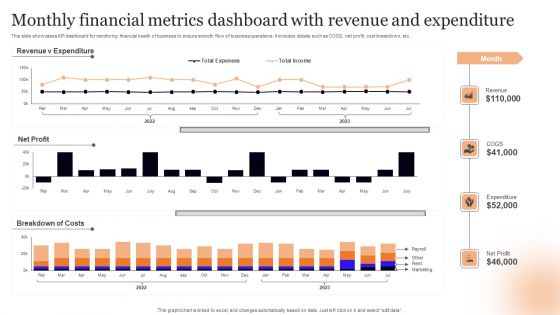
Monthly Financial Metrics Dashboard With Revenue And Expenditure Rules PDF
This slide showcases KPI dashboard for monitoring financial health of business to ensure smooth flow of business operations. It includes details such as COGS, net profit, cost breakdown, etc. Showcasing this set of slides titled Monthly Financial Metrics Dashboard With Revenue And Expenditure Rules PDF. The topics addressed in these templates are Net Profit, Costs, Expenditure. All the content presented in this PPT design is completely editable. Download it and make adjustments in color, background, font etc. as per your unique business setting.
-
Project Metrics Dashboard With Monthly Timeline Pictures PDF
This slide covers the project management dashboard which focuses on project objective, main focus,, issues and risks, key discussion points, project status, primary resources with roles, monthly timeline depicting milestones sch as charter, coding, designing, etc. Showcasing this set of slides titled Project Metrics Dashboard With Monthly Timeline Pictures PDF. The topics addressed in these templates are Primary Resources, Risk, Requirements. All the content presented in this PPT design is completely editable. Download it and make adjustments in color, background, font etc. as per your unique business setting.
-
Monthly Salary Management Dashboard Icon Microsoft PDF
Persuade your audience using this Monthly Salary Management Dashboard Icon Microsoft PDF. This PPT design covers three stages, thus making it a great tool to use. It also caters to a variety of topics including Dashboard Icon, Monthly Salary Management. Download this PPT design now to present a convincing pitch that not only emphasizes the topic but also showcases your presentation skills.
-
Monthly Project Progress Report Dashboard With Execution Timeline Ppt Icon Graphics Tutorials PDF
This slide showcases monthly project status dashboard with execution timeline. It provides information about sponsor, financials, budget, key risks and issues, work stream , etc. Presenting Monthly Project Progress Report Dashboard With Execution Timeline Ppt Icon Graphics Tutorials PDF to dispense important information. This template comprises one stages. It also presents valuable insights into the topics including Execution Timeline, Project Status, Project Manager. This is a completely customizable PowerPoint theme that can be put to use immediately. So, download it and address the topic impactfully.
-
Monthly Sales Reporting And Projections Dashboard Icon Ppt Icon Clipart Images PDF
Persuade your audience using this Monthly Sales Reporting And Projections Dashboard Icon Ppt Icon Clipart Images PDF. This PPT design covers three stages, thus making it a great tool to use. It also caters to a variety of topics including Monthly Sale,s Reporting And Projections, Dashboard Icon. Download this PPT design now to present a convincing pitch that not only emphasizes the topic but also showcases your presentation skills.
-
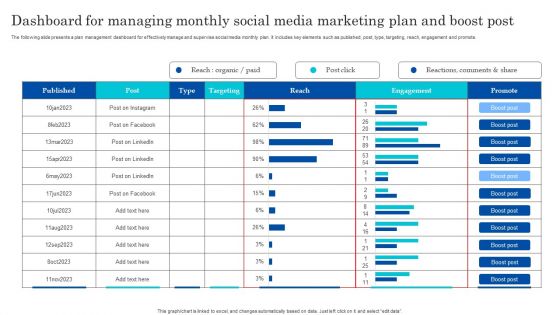
Dashboard For Managing Monthly Social Media Marketing Plan And Boost Post Themes PDF
The following slide presents a plan management dashboard for effectively manage and supervise social media monthly plan. It includes key elements such as published, post, type, targeting, reach, engagement and promote. Showcasing this set of slides titled Dashboard For Managing Monthly Social Media Marketing Plan And Boost Post Themes PDF. The topics addressed in these templates are Published, Targeting, Engagement. All the content presented in this PPT design is completely editable. Download it and make adjustments in color, background, font etc. as per your unique business setting.
-
Monthly Production Report Dashboard Icon Background PDF
Persuade your audience using this Monthly Production Report Dashboard Icon Background PDF. This PPT design covers three stages, thus making it a great tool to use. It also caters to a variety of topics including Monthly Production, Report Dashboard Icon. Download this PPT design now to present a convincing pitch that not only emphasizes the topic but also showcases your presentation skills.
-
Kpi Dashboard For Tracking Monthly Personal Finances Ppt Outline Graphics Example PDF
This slide shows dashboard which can be used by individuals to track monthly expenses in order to get better understanding of his or her finances. It includes metrics such as users spending, savings, debt, etc. Welcome to our selection of the Kpi Dashboard For Tracking Monthly Personal Finances Ppt Outline Graphics Example PDF. These are designed to help you showcase your creativity and bring your sphere to life. Planning and Innovation are essential for any business that is just starting out. This collection contains the designs that you need for your everyday presentations. All of our PowerPoints are 100 percent editable, so you can customize them to suit your needs. This multi purpose template can be used in various situations. Grab these presentation templates today.
-
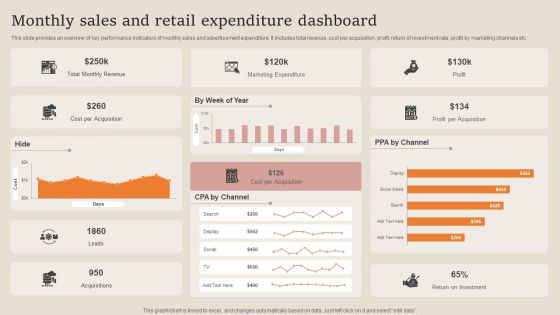
Monthly Sales And Retail Expenditure Dashboard Summary PDF
This slide provides an overview of key performance indicators of monthly sales and advertisement expenditure. It includes total revenue, cost per acquisition, profit, return of investment rate, profit by marketing channels etc. Pitch your topic with ease and precision using this Monthly Sales And Retail Expenditure Dashboard Summary PDF. This layout presents information on Marketing Expenditure, Revenue, Cost Per Acquisition. It is also available for immediate download and adjustment. So, changes can be made in the color, design, graphics or any other component to create a unique layout.
-
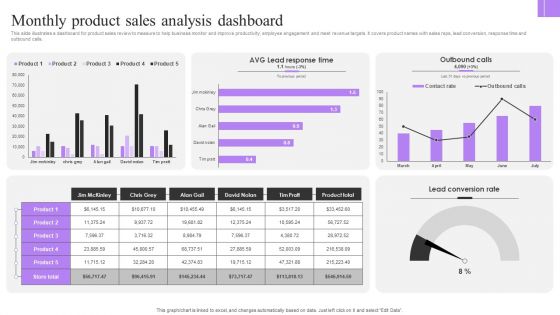
Monthly Product Sales Analysis Dashboard Infographics PDF
This slide illustrates a dashboard for product sales review to measure to help business monitor and improve productivity, employee engagement and meet revenue targets. It covers product names with sales reps, lead conversion, response time and outbound calls. Showcasing this set of slides titled Monthly Product Sales Analysis Dashboard Infographics PDF. The topics addressed in these templates are Lead Conversion Rate, Outbound Calls, Sales Analysis Dashboard. All the content presented in this PPT design is completely editable. Download it and make adjustments in color, background, font etc. as per your unique business setting.
-
Dashboard For Monthly Procurement Process Automated Workflow Rules PDF
This slide presents a dashboard for monthly procurement activities in an organization. It includes number of suppliers, contract attainted, supplier share, top supplier report, average procurement cycle time, etc. Are you searching for a Dashboard For Monthly Procurement Process Automated Workflow Rules PDF that is uncluttered, straightforward, and original Its easy to edit, and you can change the colors to suit your personal or business branding. For a presentation that expresses how much effort you have put in, this template is ideal. With all of its features, including tables, diagrams, statistics, and lists, its perfect for a business plan presentation. Make your ideas more appealing with these professional slides. Download Dashboard For Monthly Procurement Process Automated Workflow Rules PDF from Slidegeeks today.
-
Dashboard For Monthly Procurement Process Automated Workflow Brochure PDF
This slide presents a dashboard for monthly procurement activities in an organization. It includes number of suppliers, contract attainted, supplier share, top supplier report, average procurement cycle time, etc. Want to ace your presentation in front of a live audience Our Dashboard For Monthly Procurement Process Automated Workflow Brochure PDF can help you do that by engaging all the users towards you. Slidegeeks experts have put their efforts and expertise into creating these impeccable powerpoint presentations so that you can communicate your ideas clearly. Moreover, all the templates are customizable, and easy to edit and downloadable. Use these for both personal and commercial use.
-
Monthly Sales Performance Tracking And Monitoring Dashboard Diagrams PDF
This slide showcases a dashboard presenting various metrics to measure and analyze sales performance for revenue growth. It includes key components such as number of sales, revenue, profit, cost, sales revenue, sales increment, cost analysis and cross sell. Make sure to capture your audiences attention in your business displays with our gratis customizable Monthly Sales Performance Tracking And Monitoring Dashboard Diagrams PDF. These are great for business strategies, office conferences, capital raising or task suggestions. If you desire to acquire more customers for your tech business and ensure they stay satisfied, create your own sales presentation with these plain slides.
-
Monthly Sales Performance Tracking And Monitoring Dashboard Sample PDF
This slide showcases a dashboard presenting various metrics to measure and analyze sales performance for revenue growth. It includes key components such as number of sales, revenue, profit, cost, sales revenue, sales increment, cost analysis and cross sell. Do you have to make sure that everyone on your team knows about any specific topic I yes, then you should give Monthly Sales Performance Tracking And Monitoring Dashboard Sample PDF a try. Our experts have put a lot of knowledge and effort into creating this impeccable Monthly Sales Performance Tracking And Monitoring Dashboard Sample PDF. You can use this template for your upcoming presentations, as the slides are perfect to represent even the tiniest detail. You can download these templates from the Slidegeeks website and these are easy to edit. So grab these today.
-
Monthly Sales Performance Tracking And Monitoring Dashboard Designs PDF
This slide showcases a dashboard presenting various metrics to measure and analyze sales performance for revenue growth. It includes key components such as number of sales, revenue, profit, cost, sales revenue, sales increment, cost analysis and cross sell. Make sure to capture your audiences attention in your business displays with our gratis customizable Monthly Sales Performance Tracking And Monitoring Dashboard Designs PDF. These are great for business strategies, office conferences, capital raising or task suggestions. If you desire to acquire more customers for your tech business and ensure they stay satisfied, create your own sales presentation with these plain slides.
-
Monthly Sales Performance Tracking And Monitoring Dashboard Inspiration PDF
This slide showcases a dashboard presenting various metrics to measure and analyze sales performance for revenue growth. It includes key components such as number of sales, revenue, profit, cost, sales revenue, sales increment, cost analysis and cross sell. Coming up with a presentation necessitates that the majority of the effort goes into the content and the message you intend to convey. The visuals of a PowerPoint presentation can only be effective if it supplements and supports the story that is being told. Keeping this in mind our experts created Monthly Sales Performance Tracking And Monitoring Dashboard Inspiration PDF to reduce the time that goes into designing the presentation. This way, you can concentrate on the message while our designers take care of providing you with the right template for the situation.
-
KPI Dashboard For Tracking Monthly Personal Comprehensive Smartphone Banking Introduction Pdf
This slide shows dashboard which can be used by individuals to track monthly expenses in order to get better understanding of hisorher finances. It includes metrics such as users spending, savings, debt, etc.Take your projects to the next level with our ultimate collection of KPI Dashboard For Tracking Monthly Personal Comprehensive Smartphone Banking Introduction Pdf. Slidegeeks has designed a range of layouts that are perfect for representing task or activity duration, keeping track of all your deadlines at a glance. Tailor these designs to your exact needs and give them a truly corporate look with your own brand colors they all make your projects stand out from the rest.
-
Dashboard For Monthly Earnings And Loss Summary With Net Revenue Background Pdf
This slide displays a dashboard to effectively visualize major profitability indicators and communicate crucial information to upper management of the company. It includes details such as cost of goods sold, earnings before interest and taxes, interest expense, etc. Pitch your topic with ease and precision using this Dashboard For Monthly Earnings And Loss Summary With Net Revenue Background Pdf. This layout presents information on Dashboard For Monthly Earnings, Loss Summary, Net Revenue. It is also available for immediate download and adjustment. So, changes can be made in the color, design, graphics or any other component to create a unique layout.
-
KPI Dashboard For Estimating Monthly Cash Flow Infographics Pdf
Following slide demonstrates KPI dashboard to forecast monthly business money flow for cash flow management planning. It includes components such as projected profit before tax, net operating cash flow, net financial cash flow, net investing cash flow, etc. Showcasing this set of slides titled KPI Dashboard For Estimating Monthly Cash Flow Infographics Pdf. The topics addressed in these templates are KPI Dashboard, Estimating Monthly Cash Flow, Net Financial Cash Flow. All the content presented in this PPT design is completely editable. Download it and make adjustments in color, background, font etc. as per your unique business setting.
-
KPI Dashboard To Track Monthly Business Goals Microsoft Pdf
Following slide demonstrates KPI dashboard for monitoring monthly revenue targets achieved by business to determine overall organisation growth. It includes key components such as monthly business revenue, new customer base, average revenue and customer acquisition cost. Pitch your topic with ease and precision using this KPI Dashboard To Track Monthly Business Goals Microsoft Pdf. This layout presents information on Target Per Customer, Target Set. It is also available for immediate download and adjustment. So, changes can be made in the color, design, graphics or any other component to create a unique layout.
-
Dashboard For Monthly Procurement Process Techniques Executing Workflow Guidelines Pdf
This slide presents a dashboard for monthly procurement activities in an organization. It includes number of suppliers, contract attainted, supplier share, top supplier report, average procurement cycle time, etc. Present like a pro with Dashboard For Monthly Procurement Process Techniques Executing Workflow Guidelines Pdf Create beautiful presentations together with your team, using our easy-to-use presentation slides. Share your ideas in real-time and make changes on the fly by downloading our templates. So whether you are in the office, on the go, or in a remote location, you can stay in sync with your team and present your ideas with confidence. With Slidegeeks presentation got a whole lot easier. Grab these presentations today.
-
Warehouse Dashboard To Measure And Track Monthly Orders Optimizing Inventory Management IoT SS V
This slide provides an overview of the dashboard that helps in warehouse management. The dashboard includes orders received, processing and returns. Want to ace your presentation in front of a live audience Our Warehouse Dashboard To Measure And Track Monthly Orders Optimizing Inventory Management IoT SS V can help you do that by engaging all the users towards you. Slidegeeks experts have put their efforts and expertise into creating these impeccable powerpoint presentations so that you can communicate your ideas clearly. Moreover, all the templates are customizable, and easy-to-edit and downloadable. Use these for both personal and commercial use.
-
Wireless Banking To Improve KPI Dashboard For Tracking Monthly Personal Fin SS V
This slide shows dashboard which can be used by individuals to track monthly expenses in order to get better understanding of his or her finances. It includes metrics such as users spending, savings, debt, etc. Slidegeeks is one of the best resources for PowerPoint templates. You can download easily and regulate Wireless Banking To Improve KPI Dashboard For Tracking Monthly Personal Fin SS V for your personal presentations from our wonderful collection. A few clicks is all it takes to discover and get the most relevant and appropriate templates. Use our Templates to add a unique zing and appeal to your presentation and meetings. All the slides are easy to edit and you can use them even for advertisement purposes.
-
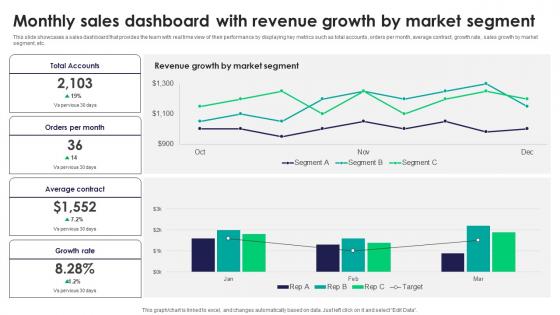
Monthly Sales Dashboard With Revenue Efficient Sales Territory Management To Build SA SS V
This slide showcases a sales dashboard that provides the team with real time view of their performance by displaying key metrics such as total accounts, orders per month, average contract, growth rate, sales growth by market segment, etc. The Monthly Sales Dashboard With Revenue Efficient Sales Territory Management To Build SA SS V is a compilation of the most recent design trends as a series of slides. It is suitable for any subject or industry presentation, containing attractive visuals and photo spots for businesses to clearly express their messages. This template contains a variety of slides for the user to input data, such as structures to contrast two elements, bullet points, and slides for written information. Slidegeeks is prepared to create an impression.
-
Monthly Sales Dashboard With Revenue Growth By Tactics For Improving Field Sales Team SA SS V
This slide showcases a sales dashboard that provides the team with real time view of their performance by displaying key metrics such as total accounts, orders per month, average contract, growth rate, sales growth by market segment, etc. The Monthly Sales Dashboard With Revenue Growth By Tactics For Improving Field Sales Team SA SS V is a compilation of the most recent design trends as a series of slides. It is suitable for any subject or industry presentation, containing attractive visuals and photo spots for businesses to clearly express their messages. This template contains a variety of slides for the user to input data, such as structures to contrast two elements, bullet points, and slides for written information. Slidegeeks is prepared to create an impression.
-
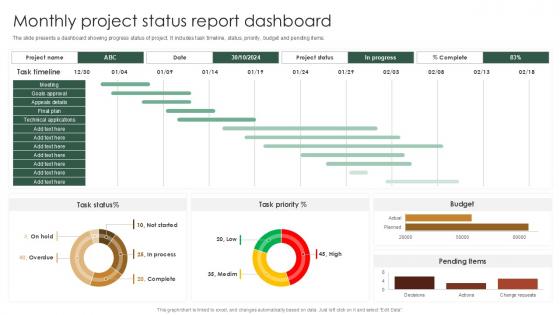
Monthly Project Status Report Dashboard PPT PowerPoint SS
The slide presents a dashboard showing progress status of project. It includes task timeline, status, priority, budget and pending items. Want to ace your presentation in front of a live audience Our Monthly Project Status Report Dashboard PPT PowerPoint SS can help you do that by engaging all the users towards you. Slidegeeks experts have put their efforts and expertise into creating these impeccable powerpoint presentations so that you can communicate your ideas clearly. Moreover, all the templates are customizable, and easy-to-edit and downloadable. Use these for both personal and commercial use.
-
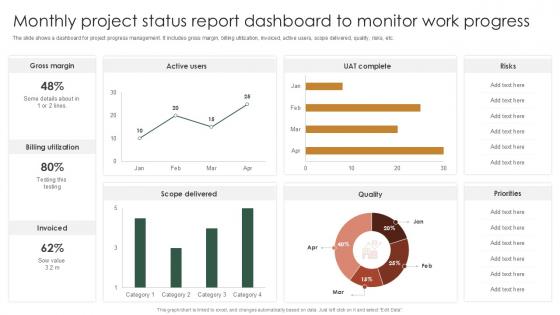
Monthly Project Status Report Dashboard To Monitor Work Progress PPT Template SS
The slide shows a dashboard for project progress management. It includes gross margin, billing utilization, invoiced, active users, scope delivered, quality, risks, etc. There are so many reasons you need a Monthly Project Status Report Dashboard To Monitor Work Progress PPT Template SS. The first reason is you can not spend time making everything from scratch, Thus, Slidegeeks has made presentation templates for you too. You can easily download these templates from our website easily.


