Kpi dashboard PowerPoint Presentation Templates and Google Slides
-
Service Level Agreement KPI Dashboard With Breached Summary Assessment Professional PDF
This graph or chart is linked to excel, and changes automatically based on data. Just left click on it and select Edit Data. Pitch your topic with ease and precision using this Service Level Agreement KPI Dashboard With Breached Summary Assessment Professional PDF. This layout presents information on Resolution Statistics, Service Desk Demo, Breached Summary. It is also available for immediate download and adjustment. So, changes can be made in the color, design, graphics or any other component to create a unique layout.
-
Service Level Agreement KPI Dashboard With Closed And Resolved Tickets Statistics Inspiration PDF
This graph or chart is linked to excel, and changes automatically based on data. Just left click on it and select Edit Data. Showcasing this set of slides titled Service Level Agreement KPI Dashboard With Closed And Resolved Tickets Statistics Inspiration PDF. The topics addressed in these templates are Tickets Priority, Tickets Source, Resolved Tickets. All the content presented in this PPT design is completely editable. Download it and make adjustments in color, background, font etc. as per your unique business setting.
-
Service Level Agreement KPI Dashboard With Current Risk Statistics Topics PDF
This graph or chart is linked to excel, and changes automatically based on data. Just left click on it and select Edit Data. Pitch your topic with ease and precision using this Service Level Agreement KPI Dashboard With Current Risk Statistics Topics PDF. This layout presents information on Current Risk SLAS, Current Breached Slas, Personal Active SLA It is also available for immediate download and adjustment. So, changes can be made in the color, design, graphics or any other component to create a unique layout.
-
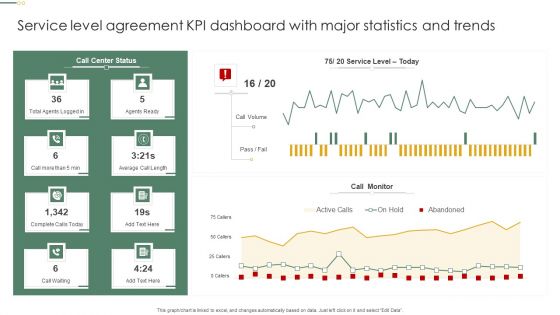
Service Level Agreement KPI Dashboard With Major Statistics And Trends Pictures PDF
This graph or chart is linked to excel, and changes automatically based on data. Just left click on it and select Edit Data. Pitch your topic with ease and precision using this Service Level Agreement KPI Dashboard With Major Statistics And Trends Pictures PDF. This layout presents information on Call Monitor, Call Volume, Agents Ready. It is also available for immediate download and adjustment. So, changes can be made in the color, design, graphics or any other component to create a unique layout.
-
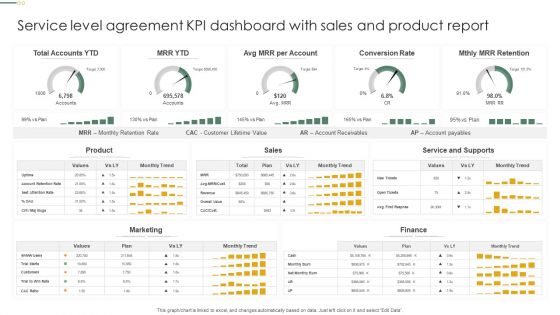
Service Level Agreement KPI Dashboard With Sales And Product Report Clipart PDF
This graph or chart is linked to excel, and changes automatically based on data. Just left click on it and select Edit Data. Showcasing this set of slides titled Service Level Agreement KPI Dashboard With Sales And Product Report Clipart PDF. The topics addressed in these templates are Total Accounts YTD, Conversion Rate, Mthly MRR Retention. All the content presented in this PPT design is completely editable. Download it and make adjustments in color, background, font etc. as per your unique business setting.
-
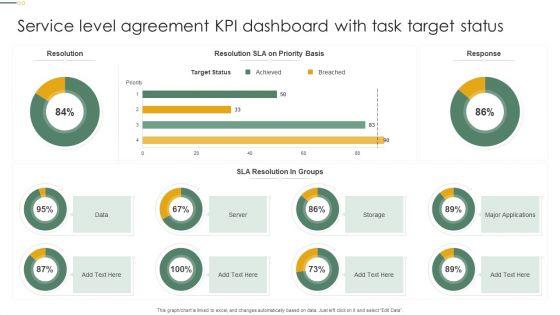
Service Level Agreement KPI Dashboard With Task Target Status Microsoft PDF
This graph or chart is linked to excel, and changes automatically based on data. Just left click on it and select Edit Data. Pitch your topic with ease and precision using this Service Level Agreement KPI Dashboard With Task Target Status Microsoft PDF. This layout presents information on Target Status, Sla Resolution, Groups, Server. It is also available for immediate download and adjustment. So, changes can be made in the color, design, graphics or any other component to create a unique layout.
-
KPI Dashboard To Measure Success Of IMC Strategy Microsoft PDF
This slide shows KPI dashboard to measure success of integrated marketing communication plan which can be referred by marketers in making decisions for future consumer campaigns. It includes information about page visit, bounce rate, user type, etc. Pitch your topic with ease and precision using this KPI Dashboard To Measure Success Of IMC Strategy Microsoft PDF. This layout presents information on Average, Bounce Rate. It is also available for immediate download and adjustment. So, changes can be made in the color, design, graphics or any other component to create a unique layout.
-
Open Organizational Management Transformation Kpi Dashboard Information PDF
This slide covers the KPI tracking dashboard for optimizing open changes. It includes metrics such as open changes by risk, status, due date, waiting for approval, etc. Pitch your topic with ease and precision using this Open Organizational Management Transformation Kpi Dashboard Information PDF. This layout presents information on Open Organizational Management, Transformation Kpi Dashboard. It is also available for immediate download and adjustment. So, changes can be made in the color, design, graphics or any other component to create a unique layout.
-
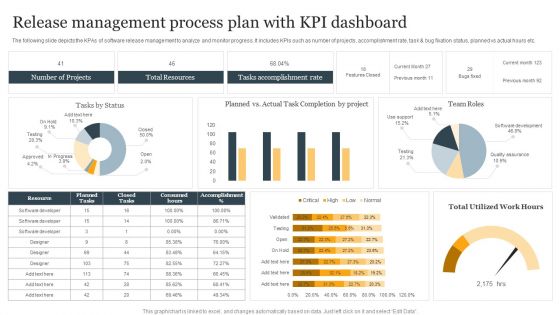
Release Management Process Plan With KPI Dashboard Ppt Infographic Template Structure PDF
The following slide depicts the KPAs of software release management to analyze and monitor progress. It includes KPIs such as number of projects, accomplishment rate, task and bug fixation status, planned vs actual hours etc. Showcasing this set of slides titled Release Management Process Plan With KPI Dashboard Ppt Infographic Template Structure PDF. The topics addressed in these templates are Number Of Projects, Total Resources, Tasks Accomplishment Rate. All the content presented in this PPT design is completely editable. Download it and make adjustments in color, background, font etc. as per your unique business setting.
-
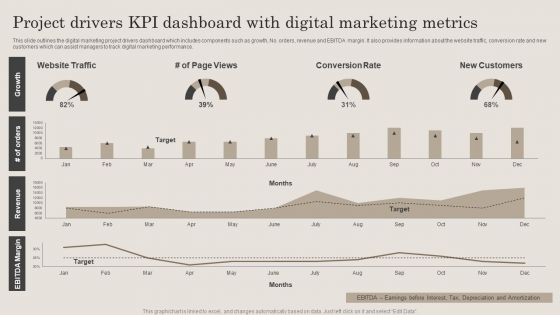
Project Drivers Kpi Dashboard With Digital Marketing Metrics Ppt PowerPoint Presentation File Clipart PDF
This slide outlines the digital marketing project drivers dashboard which includes components such as growth, No. orders, revenue and EBITDA margin. It also provides information about the website traffic, conversion rate and new customers which can assist managers to track digital marketing performance. Showcasing this set of slides titled Project Drivers Kpi Dashboard With Digital Marketing Metrics Ppt PowerPoint Presentation File Clipart PDF. The topics addressed in these templates are Website Traffic, Conversion Rate, New Customers. All the content presented in this PPT design is completely editable. Download it and make adjustments in color, background, font etc. as per your unique business setting.
-
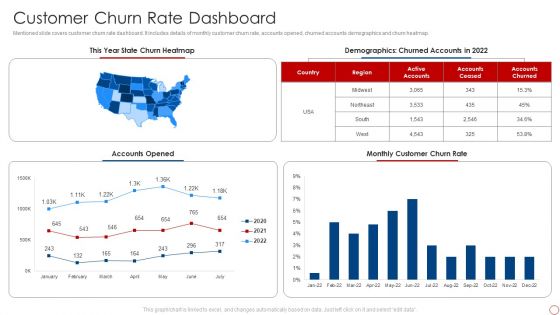
Kpis For Evaluating Business Sustainability Customer Churn Rate Dashboard Guidelines PDF
Mentioned slide covers customer churn rate dashboard. It includes details of monthly customer churn rate, accounts opened, churned accounts demographics and churn heatmap. Deliver an awe inspiring pitch with this creative Kpis For Evaluating Business Sustainability Customer Churn Rate Dashboard Guidelines PDF bundle. Topics like Accounts Opened, Monthly Customer, Churn Rate, Demographics can be discussed with this completely editable template. It is available for immediate download depending on the needs and requirements of the user.
-
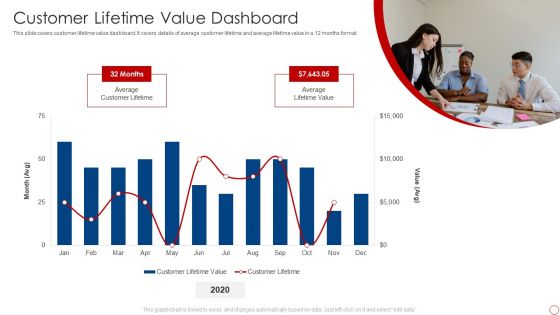
Kpis For Evaluating Business Sustainability Customer Lifetime Value Dashboard Clipart PDF
This slide covers customer lifetime value dashboard. It covers details of average customer lifetime and average lifetime value in a 12 months format. Deliver and pitch your topic in the best possible manner with this Kpis For Evaluating Business Sustainability Customer Lifetime Value Dashboard Clipart PDF. Use them to share invaluable insights on Average Customer Lifetime, Average Lifetime Value and impress your audience. This template can be altered and modified as per your expectations. So, grab it now.
-
Kpis For Evaluating Business Sustainability Employee Billable Hours Dashboard Professional PDF
Following slide shows employee billable hours dashboard covering total hours capacity, allocated hours billable, total hours worked, and total billable hours worked for the assignment. It also includes details of each team member indulged for same assignment. Deliver and pitch your topic in the best possible manner with this Kpis For Evaluating Business Sustainability Employee Billable Hours Dashboard Professional PDF. Use them to share invaluable insights on Total Billable Worked, Total Worked, Allocated Billable, Total Capacity and impress your audience. This template can be altered and modified as per your expectations. So, grab it now.
-
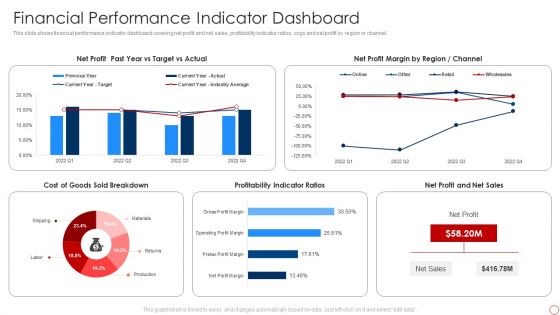
Kpis For Evaluating Business Sustainability Financial Performance Indicator Dashboard Demonstration PDF
This slide shows financial performance indicator dashboard covering net profit and net sales, profitability indicator ratios, cogs and net profit by region or channel. Deliver and pitch your topic in the best possible manner with this Kpis For Evaluating Business Sustainability Financial Performance Indicator Dashboard Demonstration PDF. Use them to share invaluable insights on Net Profit, Net Profit Margin, Profitability Indicator Ratios and impress your audience. This template can be altered and modified as per your expectations. So, grab it now.
-
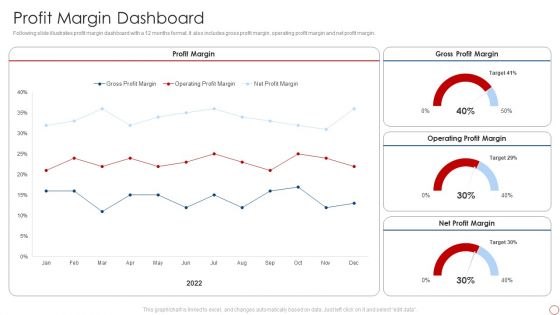
Kpis For Evaluating Business Sustainability Profit Margin Dashboard Pictures PDF
Following slide illustrates profit margin dashboard with a 12 months format. It also includes gross profit margin, operating profit margin and net profit margin. Deliver and pitch your topic in the best possible manner with this Kpis For Evaluating Business Sustainability Profit Margin Dashboard Pictures PDF. Use them to share invaluable insights on Profit Margin, Gross Profit Margin, Operating Profit Margin and impress your audience. This template can be altered and modified as per your expectations. So, grab it now.
-
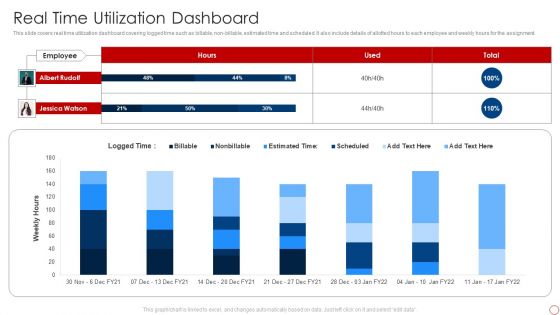
Kpis For Evaluating Business Sustainability Real Time Utilization Dashboard Portrait PDF
This slide covers real time utilization dashboard covering logged time such as billable, non-billable, estimated time and scheduled. It also include details of allotted hours to each employee and weekly hours for the assignment. Deliver an awe inspiring pitch with this creative Kpis For Evaluating Business Sustainability Real Time Utilization Dashboard Portrait PDF bundle. Topics like Logged Time, Employee, Albert Rudolf can be discussed with this completely editable template. It is available for immediate download depending on the needs and requirements of the user.
-
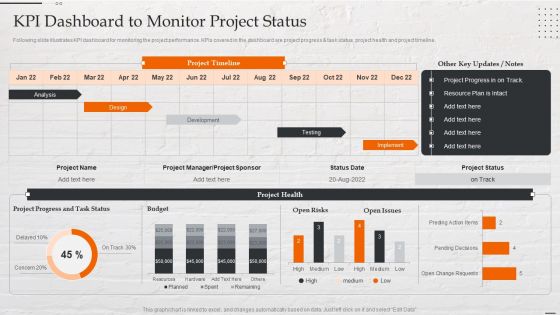
Capital Investment Options KPI Dashboard To Monitor Project Status Summary PDF
Following slide illustrates KPI dashboard for monitoring the project performance. KPIs covered in the dashboard are project progress and task status, project health and project timeline. Deliver an awe inspiring pitch with this creative Capital Investment Options KPI Dashboard To Monitor Project Status Summary PDF bundle. Topics like Analysis, Development, Testing, Implement can be discussed with this completely editable template. It is available for immediate download depending on the needs and requirements of the user.
-
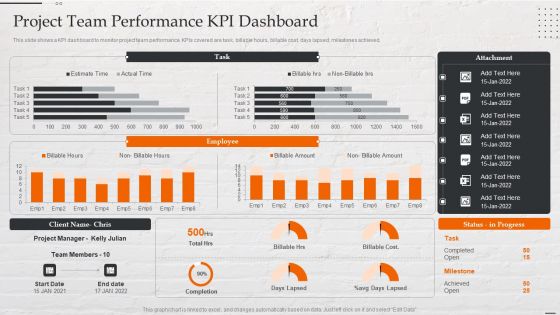
Capital Investment Options Project Team Performance Kpi Dashboard Topics PDF
This slide shows a KPI dashboard to monitor project team performance. KPIs covered are task, billable hours, billable cost, days lapsed, milestones achieved. Deliver and pitch your topic in the best possible manner with this Capital Investment Options Project Team Performance Kpi Dashboard Topics PDF. Use them to share invaluable insights on Team Members, Project Manager, Employee and impress your audience. This template can be altered and modified as per your expectations. So, grab it now.
-
Capital Investment Options Vendor Compliance Kpi Dashboard Designs PDF
Mentioned slide displays vendor compliance KPI dashboard. KPIs covered are top supplier by partner status, average procurement cycle time and average procurement cycle. Deliver an awe inspiring pitch with this creative Capital Investment Options Vendor Compliance Kpi Dashboard Designs PDF bundle. Topics like Average Procurement, Cycle Time, Confirmation, Order Placement can be discussed with this completely editable template. It is available for immediate download depending on the needs and requirements of the user.
-
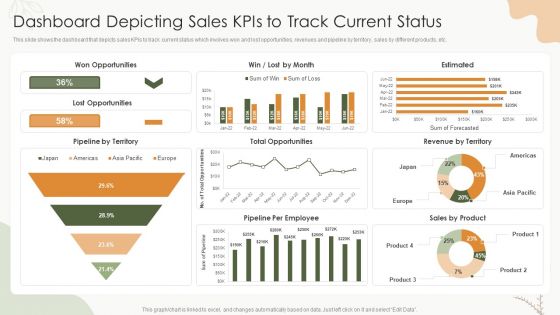
Sales Procedure Automation To Enhance Sales Dashboard Depicting Sales Kpis To Track Current Status Introduction PDF
This slide shows the dashboard that depicts sales KPIs to track current status which involves won and lost opportunities, revenues and pipeline by territory, sales by different products, etc.Deliver an awe inspiring pitch with this creative Sales Procedure Automation To Enhance Sales Dashboard Depicting Sales Kpis To Track Current Status Introduction PDF bundle. Topics like Won Opportunities, Total Opportunities, Pipeline Employee can be discussed with this completely editable template. It is available for immediate download depending on the needs and requirements of the user.
-
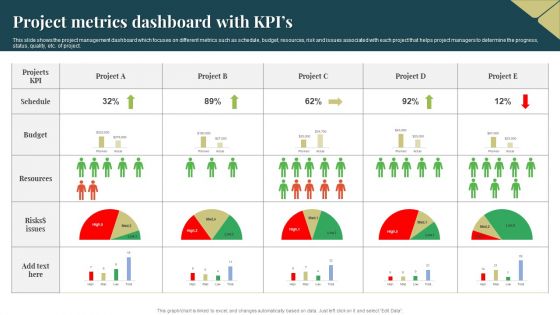
Project Metrics Dashboard With Kpis Ideas PDF
This slide shows the project management dashboard which focuses on different metrics such as schedule, budget, resources, risk and issues associated with each project that helps project managers to determine the progress, status, quality, etc. of project. Pitch your topic with ease and precision using this Project Metrics Dashboard With Kpis Ideas PDF. This layout presents information on Resources, Budget, Risks. It is also available for immediate download and adjustment. So, changes can be made in the color, design, graphics or any other component to create a unique layout.
-
Dashboard Tracking Essential Kpis For Ecommerce Performance Slides PDF
This slide provides information regarding essential KPIs for ecommerce performance dashboard tracking average bounce rate, new vs. old customers, channel revenue vs. channel acquisitions costs, channel revenue vs. sales, average conversion rate, etc. Deliver an awe inspiring pitch with this creative Dashboard Tracking Essential Kpis For Ecommerce Performance Slides PDF bundle. Topics like Average Bounce Rate, Channel Acquisition Costs, Channel Revenue can be discussed with this completely editable template. It is available for immediate download depending on the needs and requirements of the user.
-
KPI Dashboard Highlighting Automation Results In Supply Achieving Operational Efficiency Graphics PDF
The following slide outlines a comprehensive dashboard depicting the business process automation BPA results in the supply chain. Information covered in the slide is related to average order processing days, average shipping days, etc.Deliver and pitch your topic in the best possible manner with this KPI Dashboard Highlighting Automation Results In Supply Achieving Operational Efficiency Graphics PDF. Use them to share invaluable insights on Orders Progress, Late Deliveries, Deliveries Warehouse and impress your audience. This template can be altered and modified as per your expectations. So, grab it now.
-
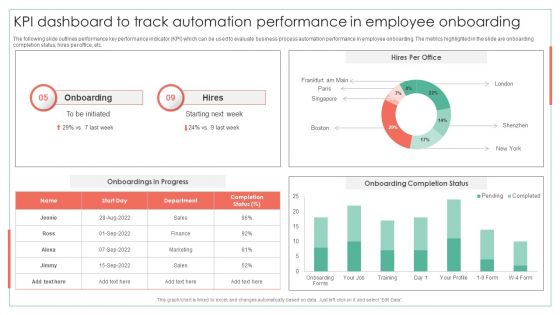
KPI Dashboard To Track Automation Performance In Employee Onboarding Achieving Operational Efficiency Download PDF
The following slide outlines performance key performance indicator KPI which can be used to evaluate business process automation performance in employee onboarding. The metrics highlighted in the slide are onboarding completion status, hires per office, etc.Deliver an awe inspiring pitch with this creative KPI Dashboard To Track Automation Performance In Employee Onboarding Achieving Operational Efficiency Download PDF bundle. Topics like Onboarding Completion, Onboarding, Onboarding Completion can be discussed with this completely editable template. It is available for immediate download depending on the needs and requirements of the user.
-
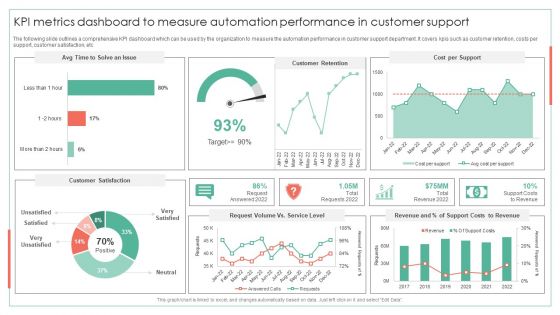
KPI Metrics Dashboard To Measure Automation Performance Achieving Operational Efficiency Guidelines PDF
The following slide outlines a comprehensive KPI dashboard which can be used by the organization to measure the automation performance in customer support department. It covers kpis such as customer retention, costs per support, customer satisfaction, etcDeliver and pitch your topic in the best possible manner with this KPI Metrics Dashboard To Measure Automation Performance Achieving Operational Efficiency Guidelines PDF. Use them to share invaluable insights on Customer Retention, Cost Per Support, Request Volume and impress your audience. This template can be altered and modified as per your expectations. So, grab it now.
-
Performance KPI Dashboard To Evaluate Social Media Marketing Performance Post Automation Ideas PDF
The following slide outlines key performance indicator KPI dashboard which can be used to track the social media marketing campaign performance, post implementing automation. It covers information about the social media followers, page impressions, instagram overview, etc.Deliver an awe inspiring pitch with this creative Performance KPI Dashboard To Evaluate Social Media Marketing Performance Post Automation Ideas PDF bundle. Topics like Page Impressions, Twitter Favorites, Instagram Overview can be discussed with this completely editable template. It is available for immediate download depending on the needs and requirements of the user.
-
KPI Dashboard To Measure Workforce Increase Ppt Slides Elements PDF
This slide shows dashboard which can be used to present the workforce increase in the organization. It includes metrics such as gender wise headcount, department wise headcount, etc. Showcasing this set of slides titled KPI Dashboard To Measure Workforce Increase Ppt Slides Elements PDF. The topics addressed in these templates are Employees Salary, Headcount, Gender Wise, Headcount Increase. All the content presented in this PPT design is completely editable. Download it and make adjustments in color, background, font etc. as per your unique business setting.
-
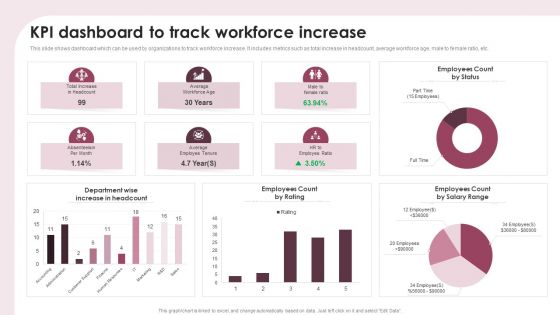
KPI Dashboard To Track Workforce Increase Ppt Show Portfolio PDF
This slide shows dashboard which can be used by organizations to track workforce increase. It includes metrics such as total increase in headcount, average workforce age, male to female ratio, etc. Pitch your topic with ease and precision using this KPI Dashboard To Track Workforce Increase Ppt Show Portfolio PDF. This layout presents information on Department Wise, Increase Headcount, Employees Count Rating. It is also available for immediate download and adjustment. So, changes can be made in the color, design, graphics or any other component to create a unique layout.
-
KPI Dashboard Of Organizational Employee Headcount Analysis Ppt PowerPoint Presentation Styles Show PDF
This slide shows KPI dashboard of human resources in company. It includes male female ratio, employees in each department, age distribution, tenure, employment status etc. Showcasing this set of slides titled KPI Dashboard Of Organizational Employee Headcount Analysis Ppt PowerPoint Presentation Styles Show PDF. The topics addressed in these templates are Support Software, Engineer Success, Sales Executive. All the content presented in this PPT design is completely editable. Download it and make adjustments in color, background, font etc. as per your unique business setting.
-
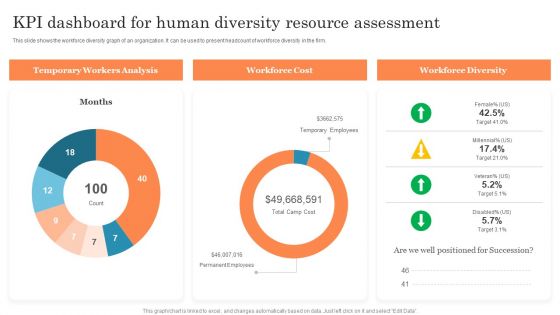
KPI Dashboard For Human Diversity Resource Assessment Ppt PowerPoint Presentation Model Vector PDF
This slide shows the workforce diversity graph of an organization. It can be used to present headcount of workforce diversity in the firm. Showcasing this set of slides titled KPI Dashboard For Human Diversity Resource Assessment Ppt PowerPoint Presentation Model Vector PDF. The topics addressed in these templates are Temporary Workers, Temporary Employees, Workforce Diversity. All the content presented in this PPT design is completely editable. Download it and make adjustments in color, background, font etc. as per your unique business setting.
-
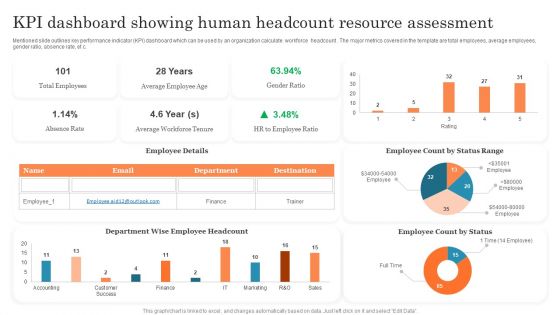
KPI Dashboard Showing Human Headcount Resource Assessment Ppt PowerPoint Presentation Outline PDF
Mentioned slide outlines key performance indicator KPI dashboard which can be used by an organization calculate workforce headcount . The major metrics covered in the template are total employees, average employees, gender ratio, absence rate, etc. Pitch your topic with ease and precision using this KPI Dashboard Showing Human Headcount Resource Assessment Ppt PowerPoint Presentation Outline PDF. This layout presents information on Total Employees, Average Employee, Employee Count. It is also available for immediate download and adjustment. So, changes can be made in the color, design, graphics or any other component to create a unique layout.
-
KPI Dashboard To Measure Tactical Business Planning Progress In Project Management Ppt PowerPoint Presentation File Example File PDF
This slide shows the strategic project plan dashboard. It includes KPIs such as project tasks status, task owner etc. Showcasing this set of slides titled KPI Dashboard To Measure Tactical Business Planning Progress In Project Management Ppt PowerPoint Presentation File Example File PDF. The topics addressed in these templates are Discontinued, Some Disruption, Completed. All the content presented in this PPT design is completely editable. Download it and make adjustments in color, background, font etc. as per your unique business setting.
-
Strategic Financial Planning KPI Dashboard Ppt PowerPoint Presentation Layouts Background Designs PDF
This slide shows financial planning strategic dashboard of organization. It includes KPIs such as working capital and its ratio, ROI, new customers, etc. Pitch your topic with ease and precision using this Strategic Financial Planning KPI Dashboard Ppt PowerPoint Presentation Layouts Background Designs PDF. This layout presents information on New Customers, Working Capital, Debt Equity. It is also available for immediate download and adjustment. So, changes can be made in the color, design, graphics or any other component to create a unique layout.
-
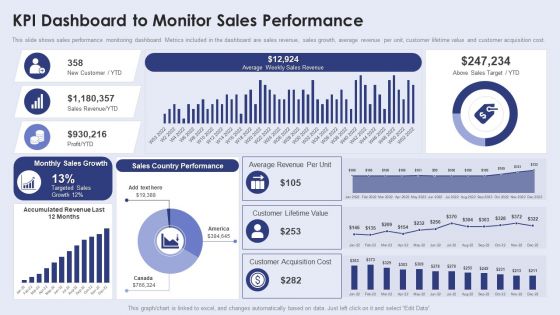
Creating New Product Launch Campaign Strategy Kpi Dashboard To Monitor Sales Performance Introduction PDF
This slide shows sales performance monitoring dashboard. Metrics included in the dashboard are sales revenue, sales growth, average revenue per unit, customer lifetime value and customer acquisition cost. This modern and well arranged Creating New Product Launch Campaign Strategy Kpi Dashboard To Monitor Sales Performance Introduction PDF provides lots of creative possibilities. It is very simple to customize and edit with the Powerpoint Software. Just drag and drop your pictures into the shapes. All facets of this template can be edited with Powerpoint no extra software is necessary. Add your own material, put your images in the places assigned for them, adjust the colors, and then you can show your slides to the world, with an animated slide included.
-
KPI Dashboard To Monitor Beauty Care Products Sales Performance Ppt Outline Example Topics PDF
This slide shows the key performance indicators dashboard which can be used to analyze current financial position of cosmetic business. It includes metrics such as sales, expenses, profit, cash in hand, etc. Showcasing this set of slides titled KPI Dashboard To Monitor Beauty Care Products Sales Performance Ppt Outline Example Topics PDF. The topics addressed in these templates are Accounts Receivable, Profit Margin, Expense. All the content presented in this PPT design is completely editable. Download it and make adjustments in color, background, font etc. as per your unique business setting.
-
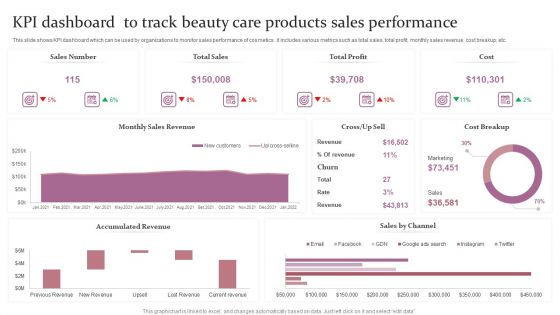
KPI Dashboard To Track Beauty Care Products Sales Performance Ppt Outline Pictures PDF
This slide shows the key performance indicators dashboard which can be used to analyze current financial position of cosmetic business. It includes metrics such as sales, expenses, profit, cash in hand, etc. Showcasing this set of slides titled KPI Dashboard To Track Beauty Care Products Sales Performance Ppt Outline Pictures PDF. The topics addressed in these templates are Sales Number, Total Sales, Total Profit, Cost. All the content presented in this PPT design is completely editable. Download it and make adjustments in color, background, font etc. as per your unique business setting.
-
Call Center Communication Kpis Performance Dashboard With First Call Resolution Rate Graphics PDF
This slide showcases dashboard that can help organization to analyze the performance of call center agents communication KPIs and take necessary actions in case of high abandonment rate. Its key components are average response time, first call resolution and top performing call agents. Showcasing this set of slides titled Call Center Communication Kpis Performance Dashboard With First Call Resolution Rate Graphics PDF. The topics addressed in these templates are Overall Average, Response Time, First Call Resolution, Daily Abandonment Rate. All the content presented in this PPT design is completely editable. Download it and make adjustments in color, background, font etc. as per your unique business setting.
-
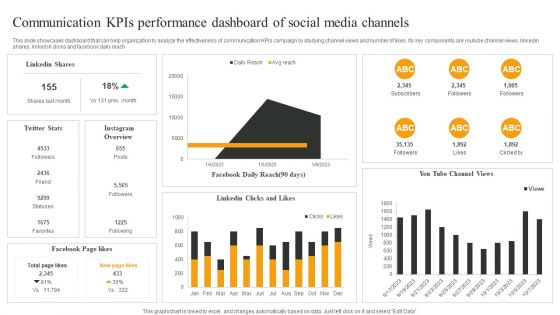
Communication Kpis Performance Dashboard Of Social Media Channels Mockup PDF
This slide showcases dashboard that can help organization to analyze the effectiveness of communication KPIs campaign by studying channel views and number of likes. Its key components are youtube channel views, linkedin shares, linked in clicks and facebook daily reach. Pitch your topic with ease and precision using this Communication Kpis Performance Dashboard Of Social Media Channels Mockup PDF. This layout presents information on Linkedin Shares, Facebook Page likes, Facebook Daily Reach. It is also available for immediate download and adjustment. So, changes can be made in the color, design, graphics or any other component to create a unique layout.
-
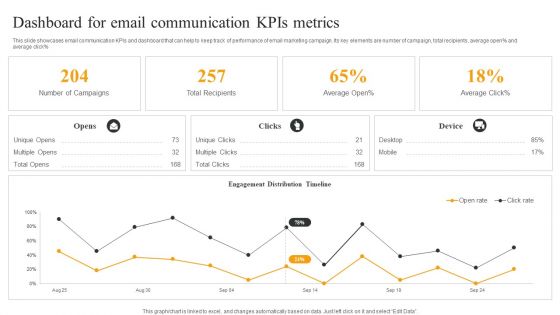
Dashboard For Email Communication Kpis Metrics Topics PDF
This slide showcases email communication KPIs and dashboard that can help to keep track of performance of email marketing campaign. Its key elements are number of campaign, total recipients, average open percent and average click percent. Showcasing this set of slides titled Dashboard For Email Communication Kpis Metrics Topics PDF. The topics addressed in these templates are Number Campaigns, Total Recipients, Engagement Distribution. All the content presented in this PPT design is completely editable. Download it and make adjustments in color, background, font etc. as per your unique business setting.
-
Email Communication Performance Kpis And Dashboard With Successful Deliveries Elements PDF
This slide showcases dashboard that can help organization to assess the performance of different email marketing communication KPIs campaigns. Its key components are email sent, successfull deliveries, abuse reports, unique unsubscribe, open and clicks. Showcasing this set of slides titled Email Communication Performance Kpis And Dashboard With Successful Deliveries Elements PDF. The topics addressed in these templates are Abuse Reports, Unique Unsubscribes, Opens. All the content presented in this PPT design is completely editable. Download it and make adjustments in color, background, font etc. as per your unique business setting.
-
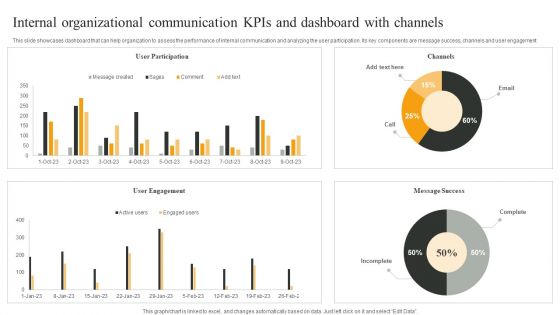
Internal Organizational Communication Kpis And Dashboard With Channels Infographics PDF
This slide showcases dashboard that can help organization to assess the performance of internal communication and analyzing the user participation. Its key components are message success, channels and user engagement. Pitch your topic with ease and precision using this Internal Organizational Communication Kpis And Dashboard With Channels Infographics PDF. This layout presents information on User Participation, User Engagement, Message Success. It is also available for immediate download and adjustment. So, changes can be made in the color, design, graphics or any other component to create a unique layout.
-
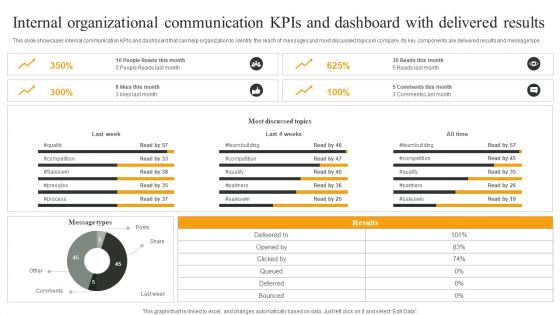
Internal Organizational Communication Kpis And Dashboard With Delivered Results Designs PDF
This slide showcases internal communication KPIs and dashboard that can help organization to identify the reach of messages and most discussed topics in company. Its key components are delivered results and message type. Showcasing this set of slides titled Internal Organizational Communication Kpis And Dashboard With Delivered Results Designs PDF. The topics addressed in these templates are Most Discussed Topics, All Time, Last Week. All the content presented in this PPT design is completely editable. Download it and make adjustments in color, background, font etc. as per your unique business setting.
-
Monthly Email Communication Kpis And Dashboard Download PDF
This slide showcases dashboard for email communication KPIs that can help organization to analyze the reach and average response time of customers. Its key elements are send messages, recipients, received messages, senders and monthly email distribution. Pitch your topic with ease and precision using this Monthly Email Communication Kpis And Dashboard Download PDF. This layout presents information on Sent Messages, Recipients, Average Response Time, Received Message. It is also available for immediate download and adjustment. So, changes can be made in the color, design, graphics or any other component to create a unique layout.
-
Performance Assessment Dashboard For Social Media Communication Kpis Graphics PDF
This slide showcases dashboard that can help organization to analyzing the reach of their communication KPIs campaigns and customer engagement rates. Its key components are monthly new follows, page likes, page impression by age group, page check ins and total content engagement. Pitch your topic with ease and precision using this Performance Assessment Dashboard For Social Media Communication Kpis Graphics PDF. This layout presents information on Monthly New Follows, Page Check ins, Total Content Engagement. It is also available for immediate download and adjustment. So, changes can be made in the color, design, graphics or any other component to create a unique layout.
-
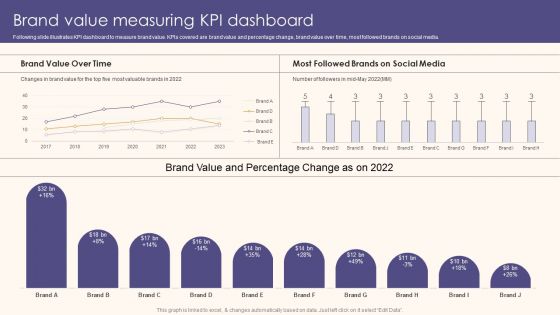
Brand Value Measuring KPI Dashboard Guide To Understand Evaluate And Enhance Brand Value Slides PDF
Following slide illustrates KPI dashboard to measure brand value. KPIs covered are brand value and percentage change, brand value over time, most followed brands on social media.Take your projects to the next level with our ultimate collection of Brand Value Measuring KPI Dashboard Guide To Understand Evaluate And Enhance Brand Value Slides PDF. Slidegeeks has designed a range of layouts that are perfect for representing task or activity duration, keeping track of all your deadlines at a glance. Tailor these designs to your exact needs and give them a truly corporate look with your own brand colors they all make your projects stand out from the rest
-
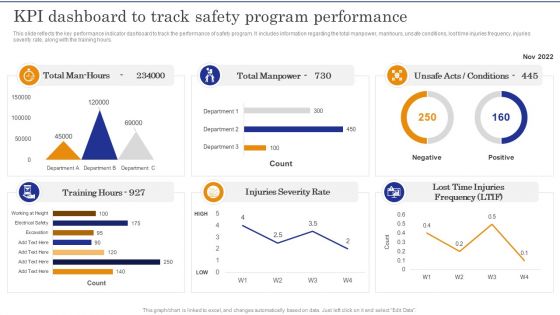
Construction Site Safety Measure KPI Dashboard To Track Safety Program Performance Slides PDF
This slide reflects the key performance indicator dashboard to track the performance of safety program. It includes information regarding the total manpower, manhours, unsafe conditions, lost time injuries frequency, injuries severity rate, along with the training hours.Slidegeeks has constructed Construction Site Safety Measure KPI Dashboard To Track Safety Program Performance Slides PDF after conducting extensive research and examination. These presentation templates are constantly being generated and modified based on user preferences and critiques from editors. Here, you will find the most attractive templates for a range of purposes while taking into account ratings and remarks from users regarding the content. This is an excellent jumping-off point to explore our content and will give new users an insight into our top-notch PowerPoint Templates.
-
Employee Talent Management Procedure Tracking Dashboard With Kpis Download PDF
This slide represents dashboard of the human resource department for tracking the performance and management of organizations workforce. It includes details related to monthly new hires, total active employees, suite people metrics along with key performance indicators. Showcasing this set of slides titled Employee Talent Management Procedure Tracking Dashboard With Kpis Download PDF. The topics addressed in these templates are Total Active Employees, Employees, Suite People Metrics. All the content presented in this PPT design is completely editable. Download it and make adjustments in color, background, font etc. as per your unique business setting.
-
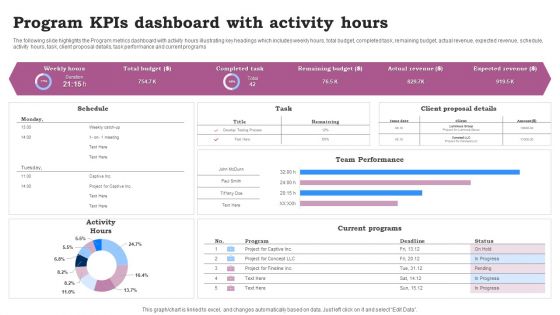
Program Kpis Dashboard With Activity Hours Ppt Infographics Clipart Images PDF
The following slide highlights the Program metrics dashboard with activity hours illustrating key headings which includes weekly hours, total budget, completed task, remaining budget, actual revenue, expected revenue, schedule, activity hours, task, client proposal details, task performance and current programs. Pitch your topic with ease and precision using this Program Kpis Dashboard With Activity Hours Ppt Infographics Clipart Images PDF. This layout presents information on Team Performance, Current Programs, Activity Hours. It is also available for immediate download and adjustment. So, changes can be made in the color, design, graphics or any other component to create a unique layout.
-
SLA KPL Dashboard Indicating Compliance Priority With KPI Ppt File Format PDF
This graph or chart is linked to excel, and changes automatically based on data. Just left click on it and select Edit Data. Showcasing this set of slides titled SLA KPL Dashboard Indicating Compliance Priority With KPI Ppt File Format PDF. The topics addressed in these templates are KPI Graph, Insights Here, SLA Compliance Priority. All the content presented in this PPT design is completely editable. Download it and make adjustments in color, background, font etc. as per your unique business setting.
-
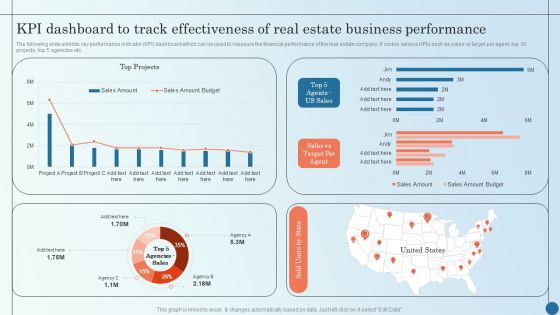
KPI Dashboard To Track Effectiveness Of Real Estate Business Managing Commercial Property Risks Demonstration PDF
The following slide exhibits key performance indicator KPI dashboard which can be used to measure the financial performance of the real estate company. It covers various KPIs such as sales vs target per agent, top 10 projects, top 5 agencies etc.Deliver an awe inspiring pitch with this creative KPI Dashboard To Track Effectiveness Of Real Estate Business Managing Commercial Property Risks Demonstration PDF bundle. Topics like Kpi Dashboard, Track Effectiveness, Estate Business can be discussed with this completely editable template. It is available for immediate download depending on the needs and requirements of the user.
-
Risk Management KPI Dashboard Of Real Estate Company Managing Commercial Property Risks Elements PDF
The following slide exhibits a key performance indicator KPI dashboard which can be used to evaluate the risks involved in real estate business. The KPIs covered in the slide are corporate risk, control performance, open issues etc.Deliver an awe inspiring pitch with this creative Risk Management KPI Dashboard Of Real Estate Company Managing Commercial Property Risks Elements PDF bundle. Topics like Control Performance, Corporate Risk, Effect Medium can be discussed with this completely editable template. It is available for immediate download depending on the needs and requirements of the user.
-
KPI Dashboard For Measuring Ecommerce Marketing Ecommerce Marketing Plan To Enhance Brochure PDF
This slide represents ecommerce dashboard showcasing marketing performance. It includes sales breakdown, net revenue through channels, sales forecast, sales funnel etc.Find highly impressive KPI Dashboard For Measuring Ecommerce Marketing Ecommerce Marketing Plan To Enhance Brochure PDF on Slidegeeks to deliver a meaningful presentation. You can save an ample amount of time using these presentation templates. No need to worry to prepare everything from scratch because Slidegeeks experts have already done a huge research and work for you. You need to download KPI Dashboard For Measuring Ecommerce Marketing Ecommerce Marketing Plan To Enhance Brochure PDF for your upcoming presentation. All the presentation templates are 100precent editable and you can change the color and personalize the content accordingly. Download now.
-
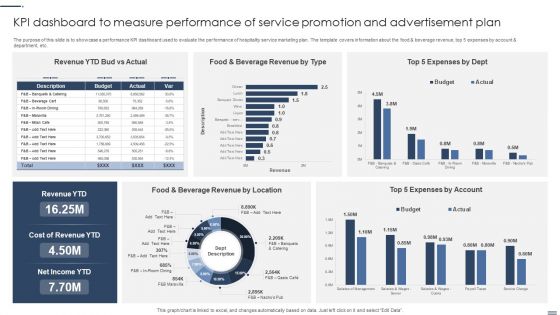
Kpi Dashboard To Measure Performance Of Service Promotion And Advertisement Plan Background PDF
The purpose of this slide is to showcase a performance KPI dashboard used to evaluate the performance of hospitality service marketing plan. The template covers information about the food and beverage revenue, top 5 expenses by account and department, etc. Showcasing this set of slides titled Kpi Dashboard To Measure Performance Of Service Promotion And Advertisement Plan Background PDF. The topics addressed in these templates areLocation, Account, Cost Revenue. All the content presented in this PPT design is completely editable. Download it and make adjustments in color, background, font etc. as per your unique business setting.
-
Workforce Productivity Tracking Report Kpi Dashboard Icons PDF
The following slide presents the KPAs of project work stream for transparency and better decision making. It includes KPIs such as work stream status, priority check, planned vs actual budget etc. Showcasing this set of slides titled Workforce Productivity Tracking Report Kpi Dashboard Icons PDF. The topics addressed in these templates are Initiation Meeting, Resource Assessment, Technological Analysis. All the content presented in this PPT design is completely editable. Download it and make adjustments in color, background, font etc. as per your unique business setting.
-
KPI Dashboard For Tracking Supply Chain Costs Industry Analysis Of Food Formats PDF
This slide represents the KPI dashboard to track the multiple cost associated with supply chain in food manufacturing industry. It includes information regarding cash to cash cycle in days, carry cost of inventory along with details of net sales.Find a pre-designed and impeccable KPI Dashboard For Tracking Supply Chain Costs Industry Analysis Of Food Formats PDF. The templates can ace your presentation without additional effort. You can download these easy-to-edit presentation templates to make your presentation stand out from others. So, what are you waiting for Download the template from Slidegeeks today and give a unique touch to your presentation.
-
Managing Cyber Security Incident Response KPI Dashboard Ppt Layouts Shapes PDF
This slide covers cyber security incident response KPI dashboard. It involves details such as intent alarm, event trend sources, event trend, sensor activity, major operating systems and asset information. Pitch your topic with ease and precision using this Managing Cyber Security Incident Response KPI Dashboard Ppt Layouts Shapes PDF. This layout presents information on Top Alarms Method, Alarms Intent, Timely Event Trend. It is also available for immediate download and adjustment. So, changes can be made in the color, design, graphics or any other component to create a unique layout.
-
Managing Cyber Security Incident Management KPI Dashboard To Measure Performance Download PDF
This slide covers cyber security incident management KPI dashboard to measure performance. It involves details such as average resolution time, new incidents, incident status, resolved vs unresolved incidents and created vs closed incidents. Showcasing this set of slides titled Managing Cyber Security Incident Management KPI Dashboard To Measure Performance Download PDF. The topics addressed in these templates are Average Resolution Time, Incident Status, New Incidents. All the content presented in this PPT design is completely editable. Download it and make adjustments in color, background, font etc. as per your unique business setting.
-
Marketing Team Training And Development Program KPI Dashboard Designs PDF
This slide represents the checklist of the training program conducted for the development of the marketing team of the organization. It includes activities related to conduct of marketing teams training program. Pitch your topic with ease and precision using this Marketing Team Training And Development Program KPI Dashboard Designs PDF. This layout presents information on Training Cost Actual, Cost Per Participant, Cost Per Hour. It is also available for immediate download and adjustment. So, changes can be made in the color, design, graphics or any other component to create a unique layout.
-
Brand Awareness Measuring Kpi Dashboard Brand Value Estimation Guide Formats PDF
Following slide illustrates KPI dashboard that can be used to track the awareness level of a specific brand. KPIs covered in the slide are traffic, attention, authority, inbound channel performance etc.There are so many reasons you need a Brand Awareness Measuring Kpi Dashboard Brand Value Estimation Guide Formats PDF. The first reason is you can not spend time making everything from scratch, Thus, Slidegeeks has made presentation templates for you too. You can easily download these templates from our website easily.
-
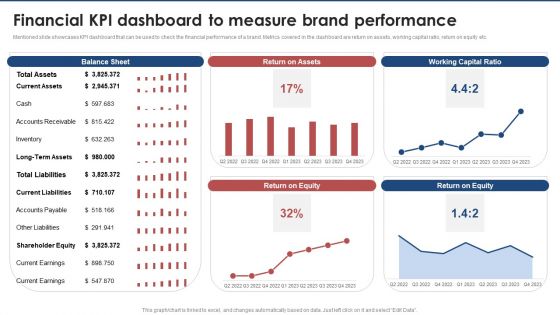
Financial Kpi Dashboard To Measure Brand Performance Brand Value Estimation Guide Inspiration PDF
Mentioned slide showcases KPI dashboard that can be used to check the financial performance of a brand. Metrics covered in the dashboard are return on assets, working capital ratio, return on equity etc.Are you in need of a template that can accommodate all of your creative concepts This one is crafted professionally and can be altered to fit any style. Use it with Google Slides or PowerPoint. Include striking photographs, symbols, depictions, and other visuals. Fill, move around, or remove text boxes as desired. Test out color palettes and font mixtures. Edit and save your work, or work with colleagues. Download Financial Kpi Dashboard To Measure Brand Performance Brand Value Estimation Guide Inspiration PDF and observe how to make your presentation outstanding. Give an impeccable presentation to your group and make your presentation unforgettable.


