It representative PowerPoint Presentation Templates and Google Slides
-
Graphical Representation Of Research IT Ppt PowerPoint Presentation Complete With Slides
Pitch yourself both in house and outside by utilizing this complete deck. This graphical representation of research it ppt powerpoint presentation complete with slides focuses on key fundamentals of the topic, displayed using different slides. With a total of forty eight slides, this template is the best tool you can use to persuade your audience. It will not only help you create great presentations but also induce strategic thinking because of its well researched content and graphics. You can easily personalize any of the elements to suit your unique business setting. Additionally, it can be saved in PNG, JPG, and PDF formats to save your time and resources.
-
Represent 16 Variable In It Ppt Business Plan Templates PowerPoint
We present our represent 16 variable in it ppt business plan templates PowerPoint.Present our Triangles PowerPoint Templates because You can Create a matrix with our PowerPoint Templates and Slides. Feel the strength of your ideas click into place. Download our Process and Flows PowerPoint Templates because Our PowerPoint Templates and Slides provide you with a vast range of viable options. Select the appropriate ones and just fill in your text. Download our Flow Charts PowerPoint Templates because Our PowerPoint Templates and Slides will let you Illuminate the road ahead to Pinpoint the important landmarks along the way. Use our Marketing PowerPoint Templates because You can Create a matrix with our PowerPoint Templates and Slides. Feel the strength of your ideas click into place. Use our Business PowerPoint Templates because They will Put your wonderful verbal artistry on display. Our PowerPoint Templates and Slides will provide you the necessary glam and glitter.Use these PowerPoint slides for presentations relating to Concept, arrow, icon, paper, website, manual, speech, step, layout, advertise, triangle, tutorial, interface, business, tag, vector, sign, presentation, portfolio,symbol, internet, template, service, element, homepage, card, simple, idea, emblem, creative, illustration, options, instruction, web, design, direction, choice,infographic, banner, art, style, background, menu, advertising, promotion. The prominent colors used in the PowerPoint template are White, Blue, Blue light.
-
Represent 16 Variable In It Developing Business Plan Template PowerPoint Templates
We present our represent 16 variable in it developing business plan template PowerPoint templates.Download our Business PowerPoint Templates because It will Strengthen your hand with your thoughts. They have all the aces you need to win the day. Download our Success PowerPoint Templates because It is Aesthetically crafted by artistic young minds. Our PowerPoint Templates and Slides are designed to display your dexterity. Download our Triangles PowerPoint Templates because Your audience will believe you are the cats whiskers. Download and present our Shapes PowerPoint Templates because You are working at that stage with an air of royalty. Let our PowerPoint Templates and Slides be the jewels in your crown. Present our Marketing PowerPoint Templates because You are an avid believer in ethical practices. Highlight the benefits that accrue with our PowerPoint Templates and Slides.Use these PowerPoint slides for presentations relating to Background, modern, color, abstract, design, vector, bright , website, decoration, green, white, triangle, business, geometry, concept, line, graphic, element, digital, black, shape, corner, creative, illustration, geometric, decorative, web, cover, blue, composition, banner, art, stripe, style, triangular. The prominent colors used in the PowerPoint template are Blue navy, Gray, Black.
-
Represent 16 Variable In It Ppt How Write Business Plan Template PowerPoint Templates
We present our represent 16 variable in it ppt how write business plan template PowerPoint templates.Present our Business PowerPoint Templates because Our PowerPoint Templates and Slides are created with admirable insight. Use them and give your group a sense of your logical mind. Present our Success PowerPoint Templates because Our PowerPoint Templates and Slides are truly out of this world. Even the MIB duo has been keeping tabs on our team. Present our Triangles PowerPoint Templates because Our PowerPoint Templates and Slides are like the strings of a tennis racquet. Well strung to help you serve aces. Present our Shapes PowerPoint Templates because Our PowerPoint Templates and Slides will Activate the energies of your audience. Get their creative juices flowing with your words. Download and present our Marketing PowerPoint Templates because Our PowerPoint Templates and Slides will provide weight to your words. They will bring out the depth of your thought process.Use these PowerPoint slides for presentations relating to Background, modern, color, abstract, design, vector, bright , website, decoration, green, white, triangle, business, geometry, concept, line, graphic, element, digital, black, shape, corner, creative, illustration, geometric, decorative, web, cover, blue, composition, banner, art, stripe, style, triangular. The prominent colors used in the PowerPoint template are Blue, Gray, Black.
-
Shape To Represent 16 Variable In It Business Continuity Plan Sample PowerPoint Templates
We present our shape to represent 16 variable in it business continuity plan sample PowerPoint templates.Download our Marketing PowerPoint Templates because Our PowerPoint Templates and Slides will let you Illuminate the road ahead to Pinpoint the important landmarks along the way. Download our Finance PowerPoint Templates because Our PowerPoint Templates and Slides will let you meet your Deadlines. Present our Layers PowerPoint Templates because Our PowerPoint Templates and Slides will let your team Walk through your plans. See their energy levels rise as you show them the way. Use our Triangles PowerPoint Templates because Our PowerPoint Templates and Slides help you meet the demand of the Market. Just browse and pick the slides that appeal to your intuitive senses. Download our Pyramids PowerPoint Templates because Our PowerPoint Templates and Slides are conceived by a dedicated team. Use them and give form to your wondrous ideas.Use these PowerPoint slides for presentations relating to Pyramid, chart, paper, origami, compare, advertisement, sequence, step, layout, triangle, tutorial, business, concept, sign, hierarchy, presentation, glossy, bright, gradation, template, cone, data, clean, process, element, workflow, shape, modern, creative, economic, rhythm, options, shiny, futuristic, web, design, trendy, blue, text, composition, choice, info, five, version, progress, menu, information, promotion, infographics. The prominent colors used in the PowerPoint template are Blue, Gray, Black.
-
Shape To Represent 16 Variable In It Ppt Business Plan Downloads PowerPoint Slides
We present our shape to represent 16 variable in it ppt business plan downloads PowerPoint Slides.Download our Marketing PowerPoint Templates because Our PowerPoint Templates and Slides will weave a web of your great ideas. They are gauranteed to attract even the most critical of your colleagues. Download and present our Finance PowerPoint Templates because Your audience will believe you are the cats whiskers. Download our Layers PowerPoint Templates because You should Bet on your luck with our PowerPoint Templates and Slides. Be assured that you will hit the jackpot. Download our Triangles PowerPoint Templates because You should Kick up a storm with our PowerPoint Templates and Slides. The heads of your listeners will swirl with your ideas. Download our Pyramids PowerPoint Templates because You can Connect the dots. Fan expectations as the whole picture emerges.Use these PowerPoint slides for presentations relating to Pyramid, chart, paper, origami, compare, advertisement, sequence, step, layout, triangle, tutorial, business, concept, sign, hierarchy, presentation, glossy, bright, gradation, template, cone, data, clean, process, element, workflow, shape, modern, creative, economic, rhythm, options, shiny, futuristic, web, design, trendy, blue, text, composition, choice, info, five, version, progress, menu, information, promotion, infographics. The prominent colors used in the PowerPoint template are Blue, Gray, Black.
-
Shape To Represent 16 Variable In It Ppt Example Business Plan PowerPoint Templates
We present our shape to represent 16 variable in it ppt example business plan PowerPoint templates.Use our Marketing PowerPoint Templates because Our PowerPoint Templates and Slides are designed to help you succeed. They have all the ingredients you need. Download and present our Finance PowerPoint Templates because It can Bubble and burst with your ideas. Download our Layers PowerPoint Templates because It will Strengthen your hand with your thoughts. They have all the aces you need to win the day. Download our Triangles PowerPoint Templates because Our PowerPoint Templates and Slides are focused like a searchlight beam. They highlight your ideas for your target audience. Use our Pyramids PowerPoint Templates because It will get your audience in sync.Use these PowerPoint slides for presentations relating to Pyramid, chart, paper, origami, compare, advertisement, sequence, step, layout, triangle, tutorial, business, concept, sign, hierarchy, presentation, glossy, bright, gradation, template, cone, data, clean, process, element, workflow, shape, modern, creative, economic, rhythm, options, shiny, futuristic, web, design, trendy, blue, text, composition, choice, info, five, version, progress, menu, information, promotion, infographics. The prominent colors used in the PowerPoint template are Blue, Gray, Black.
-
Shape To Represent 16 Variable In It Ppt Format Business Plan PowerPoint Templates
We present our shape to represent 16 variable in it ppt format business plan PowerPoint templates.Download our Marketing PowerPoint Templates because They will bring a lot to the table. Their alluring flavours will make your audience salivate. Download our Finance PowerPoint Templates because Your audience will believe you are the cats whiskers. Present our Layers PowerPoint Templates because Our PowerPoint Templates and Slides are focused like a searchlight beam. They highlight your ideas for your target audience. Use our Triangles PowerPoint Templates because Our PowerPoint Templates and Slides will help you be quick off the draw. Just enter your specific text and see your points hit home. Download our Pyramids PowerPoint Templates because Our PowerPoint Templates and Slides will let your words and thoughts hit bullseye everytime.Use these PowerPoint slides for presentations relating to Pyramid, chart, paper, origami, compare, advertisement, sequence, step, layout, triangle, tutorial, business, concept, sign, hierarchy, presentation, glossy, bright, gradation, template, cone, data, clean, process, element, workflow, shape, modern, creative, economic, rhythm, options, shiny, futuristic, web, design, trendy, blue, text, composition, choice, info, five, version, progress, menu, information, promotion, infographics. The prominent colors used in the PowerPoint template are Blue, Gray, Black.
-
Shape To Represent 16 Variable In It Ppt Frozen Yogurt Business Plan PowerPoint Slides
We present our shape to represent 16 variable in it ppt frozen yogurt business plan PowerPoint Slides.Download and present our Marketing PowerPoint Templates because Our PowerPoint Templates and Slides will effectively help you save your valuable time. They are readymade to fit into any presentation structure. Present our Finance PowerPoint Templates because Our PowerPoint Templates and Slides will effectively help you save your valuable time. They are readymade to fit into any presentation structure. Download our Layers PowerPoint Templates because Our PowerPoint Templates and Slides are topically designed to provide an attractive backdrop to any subject. Present our Triangles PowerPoint Templates because You can Raise a toast with our PowerPoint Templates and Slides. Spread good cheer amongst your audience. Download and present our Pyramids PowerPoint Templates because Your audience will believe you are the cats whiskers.Use these PowerPoint slides for presentations relating to Pyramid, chart, paper, origami, compare, advertisement, sequence, step, layout, triangle, tutorial, business, concept, sign, hierarchy, presentation, glossy, bright, gradation, template, cone, data, clean, process, element, workflow, shape, modern, creative, economic, rhythm, options, shiny, futuristic, web, design, trendy, blue, text, composition, choice, info, five, version, progress, menu, information, promotion, infographics. The prominent colors used in the PowerPoint template are Blue, Gray, Black.
-
Shape To Represent 16 Variable In It Ppt Writing Up Business Plan PowerPoint Slides
We present our shape to represent 16 variable in it ppt writing up business plan PowerPoint Slides.Download our Marketing PowerPoint Templates because Our PowerPoint Templates and Slides will bullet point your ideas. See them fall into place one by one. Use our Finance PowerPoint Templates because It will mark the footprints of your journey. Illustrate how they will lead you to your desired destination. Present our Layers PowerPoint Templates because You can Stir your ideas in the cauldron of our PowerPoint Templates and Slides. Cast a magic spell on your audience. Download and present our Triangles PowerPoint Templates because Our PowerPoint Templates and Slides will let you Hit the right notes. Watch your audience start singing to your tune. Download and present our Pyramids PowerPoint Templates because Our PowerPoint Templates and Slides will let you Illuminate the road ahead to Pinpoint the important landmarks along the way.Use these PowerPoint slides for presentations relating to Pyramid, chart, paper, origami, compare, advertisement, sequence, step, layout, triangle, tutorial, business, concept, sign, hierarchy, presentation, glossy, bright, gradation, template, cone, data, clean, process, element, workflow, shape, modern, creative, economic, rhythm, options, shiny, futuristic, web, design, trendy, blue, text, composition, choice, info, five, version, progress, menu, information, promotion, infographics. The prominent colors used in the PowerPoint template are Blue, Gray, Black.
-
Shape To Represent 16 Variable In It Ppt Business Financial Planning PowerPoint Templates
We present our shape to represent 16 variable in it ppt business financial planning PowerPoint templates.Present our Marketing PowerPoint Templates because Our PowerPoint Templates and Slides offer you the widest possible range of options. Download and present our Finance PowerPoint Templates because Our PowerPoint Templates and Slides will let Your superior ideas hit the target always and everytime. Present our Layers PowerPoint Templates because Our PowerPoint Templates and Slides will give you great value for your money. Be assured of finding the best projection to highlight your words. Present our Triangles PowerPoint Templates because These PowerPoint Templates and Slides will give the updraft to your ideas. See them soar to great heights with ease. Present our Pyramids PowerPoint Templates because our PowerPoint Templates and Slides will give your ideas the shape.Use these PowerPoint slides for presentations relating to Pyramid, chart, paper, origami, compare, advertisement, sequence, step, layout, triangle, tutorial, business, concept, sign, hierarchy, presentation, glossy, bright, gradation, template, cone, data, clean, process, element, workflow, shape, modern, creative, economic, rhythm, options, shiny, futuristic, web, design, trendy, blue, text, composition, choice, info, five, version, progress, menu, information, promotion, infographics. The prominent colors used in the PowerPoint template are Blue, Gray, Black.
-
Shape To Represent 16 Variable In It Ppt Business Plan Outline Sample PowerPoint Slides
We present our shape to represent 16 variable in it ppt business plan outline sample PowerPoint Slides.Present our Marketing PowerPoint Templates because Our PowerPoint Templates and Slides will definately Enhance the stature of your presentation. Adorn the beauty of your thoughts with their colourful backgrounds. Present our Finance PowerPoint Templates because you should Whip up a frenzy with our PowerPoint Templates and Slides. They will fuel the excitement of your team. Download and present our Layers PowerPoint Templates because Our PowerPoint Templates and Slides will provide you the cutting edge. Slice through the doubts in the minds of your listeners. Use our Triangles PowerPoint Templates because Your success is our commitment. Our PowerPoint Templates and Slides will ensure you reach your goal. Present our Pyramids PowerPoint Templates because Our PowerPoint Templates and Slides will generate and maintain the level of interest you desire. They will create the impression you want to imprint on your audience.Use these PowerPoint slides for presentations relating to Pyramid, chart, paper, origami, compare, advertisement, sequence, step, layout, triangle, tutorial, business, concept, sign, hierarchy, presentation, glossy, bright, gradation, template, cone, data, clean, process, element, workflow, shape, modern, creative, economic, rhythm, options, shiny, futuristic, web, design, trendy, blue, text, composition, choice, info, five, version, progress, menu, information, promotion, infographics. The prominent colors used in the PowerPoint template are Blue, Gray, Black.
-
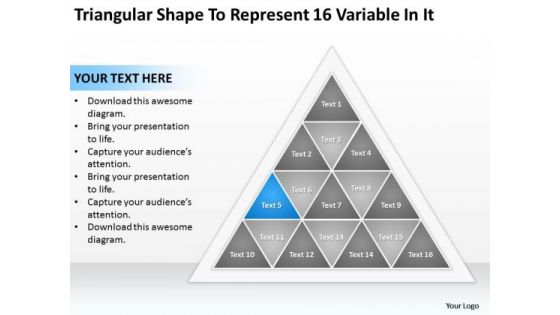
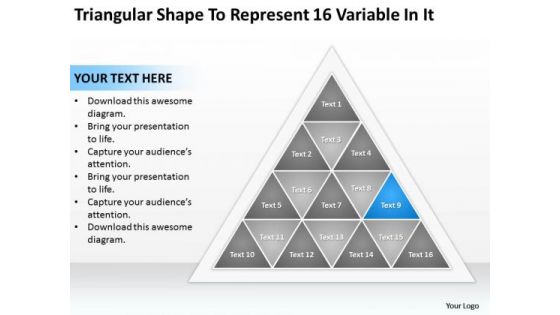
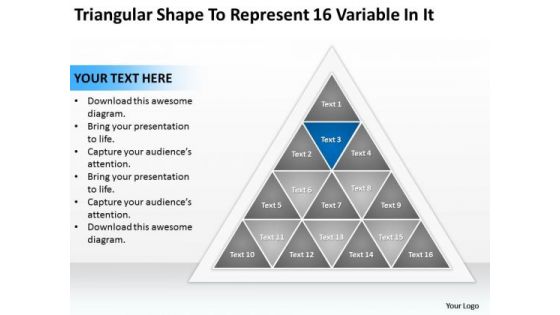
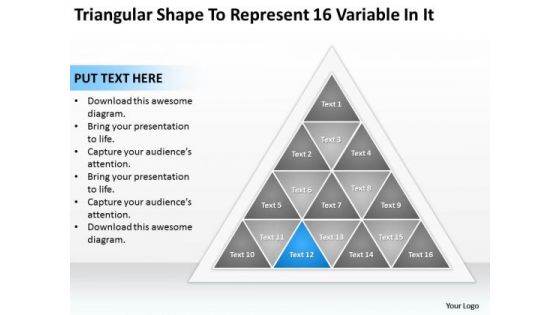
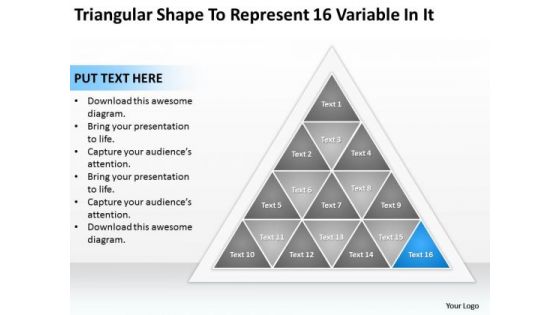
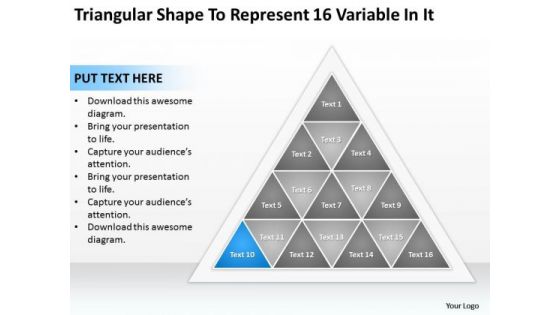
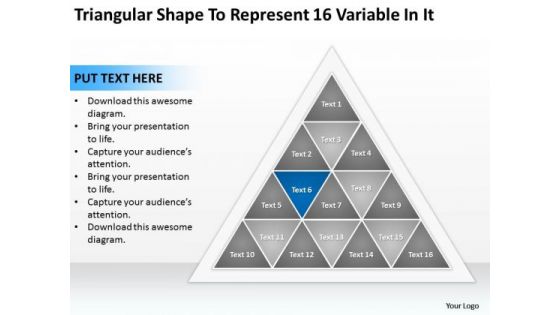
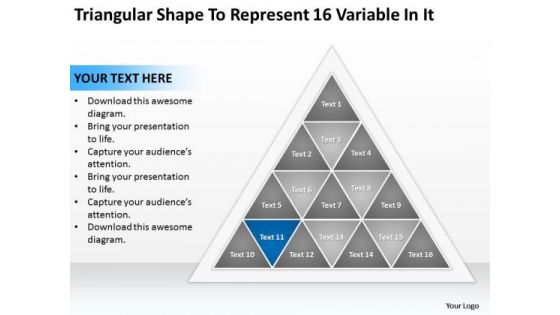
Triangular Shape To Represent 16 Variable In It Business Plan Company PowerPoint Slides
We present our triangular shape to represent 16 variable in it business plan company PowerPoint Slides.Download our Process and Flows PowerPoint Templates because Our PowerPoint Templates and Slides are focused like a searchlight beam. They highlight your ideas for your target audience. Download our Triangles PowerPoint Templates because You are working at that stage with an air of royalty. Let our PowerPoint Templates and Slides be the jewels in your crown. Download and present our Flow Charts PowerPoint Templates because Our PowerPoint Templates and Slides are specially created by a professional team with vast experience. They diligently strive to come up with the right vehicle for your brilliant Ideas. Use our Marketing PowerPoint Templates because You can Create a matrix with our PowerPoint Templates and Slides. Feel the strength of your ideas click into place. Present our Business PowerPoint Templates because You can Channelise the thoughts of your team with our PowerPoint Templates and Slides. Urge them to focus on the goals you have set.Use these PowerPoint slides for presentations relating to Pyramid, arrow, icon, paper, website, page, manual, speech, step, layout, advertise, triangle, tutorial, interface, business, tag, vector, sign, presentation, portfolio,symbol, element,card, simple, idea, emblem, creative, illustration, options, instruction, web, direction, design, choice,infographic, banner, art, style, menu, background, advertising, promotion, product, button. The prominent colors used in the PowerPoint template are Blue , White, Gray.
-
Triangular Shape To Represent 16 Variable In It Ppt Business Plans PowerPoint Templates
We present our triangular shape to represent 16 variable in it ppt business plans PowerPoint templates.Use our Triangles PowerPoint Templates because Our PowerPoint Templates and Slides offer you the needful to organise your thoughts. Use them to list out your views in a logical sequence. Download our Flow Charts PowerPoint Templates because Your ideas provide food for thought. Our PowerPoint Templates and Slides will help you create a dish to tickle the most discerning palate. Present our Marketing PowerPoint Templates because Our PowerPoint Templates and Slides will let Your superior ideas hit the target always and everytime. Use our Process and Flows PowerPoint Templates because Our PowerPoint Templates and Slides will let you Clearly mark the path for others to follow. Present our Business PowerPoint Templates because It will Raise the bar of your Thoughts. They are programmed to take you to the next level.Use these PowerPoint slides for presentations relating to Pyramid, arrow, icon, paper, website, page, manual, speech, step, layout, advertise, triangle, tutorial, interface, business, tag, vector, sign, presentation, portfolio,symbol, element,simple, idea, emblem, creative, illustration, options, instruction, web, direction, design, choice,infographic, banner, art, style, menu, background, advertising, promotion, product, button. The prominent colors used in the PowerPoint template are Blue light, Gray, Black.
-
Triangular Shape To Represent 16 Variable In It Ppt Free Sample Business Plans PowerPoint Slides
We present our triangular shape to represent 16 variable in it ppt free sample business plans PowerPoint Slides.Download and present our Process and Flows PowerPoint Templates because You can Create a matrix with our PowerPoint Templates and Slides. Feel the strength of your ideas click into place. Use our Business PowerPoint Templates because You should Press the right buttons with our PowerPoint Templates and Slides. They will take your ideas down the perfect channel. Use our Triangles PowerPoint Templates because Our PowerPoint Templates and Slides has conjured up a web of all you need with the help of our great team. Use them to string together your glistening ideas. Use our Flow Charts PowerPoint Templates because You have a driving passion to excel in your field. Our PowerPoint Templates and Slides will prove ideal vehicles for your ideas. Use our Marketing PowerPoint Templates because Our PowerPoint Templates and Slides will let you Clearly mark the path for others to follow.Use these PowerPoint slides for presentations relating to Pyramid, arrow, icon, paper, website, page, manual, speech, step, layout, advertise, triangle, tutorial, interface, business, tag, vector, sign, presentation, portfolio,symbol, element,simple, idea, emblem, creative, illustration, options, instruction, web, direction, design, choice,infographic, banner, art, style, menu, background, advertising, promotion, product, button. The prominent colors used in the PowerPoint template are Gray, Blue, White.
-
Triangular Shape To Represent 16 Variable In It Ppt New Business Ideas PowerPoint Templates
We present our triangular shape to represent 16 variable in it ppt new business ideas PowerPoint templates.Present our Process and Flows PowerPoint Templates because You are well armed with penetrative ideas. Our PowerPoint Templates and Slides will provide the gunpowder you need. Use our Business PowerPoint Templates because You have a driving passion to excel in your field. Our PowerPoint Templates and Slides will prove ideal vehicles for your ideas. Use our Triangles PowerPoint Templates because It can Bubble and burst with your ideas. Use our Flow Charts PowerPoint Templates because You are working at that stage with an air of royalty. Let our PowerPoint Templates and Slides be the jewels in your crown. Present our Marketing PowerPoint Templates because You can Inspire your team with our PowerPoint Templates and Slides. Let the force of your ideas flow into their minds.Use these PowerPoint slides for presentations relating to Pyramid, arrow, icon, paper, website, page, manual, speech, step, layout, advertise, triangle, tutorial, interface, business, tag, vector, sign, presentation, portfolio,symbol, element,simple, idea, emblem, creative, illustration, options, instruction, web, direction, design, choice,infographic, banner, art, style, menu, background, advertising, promotion, product, button. The prominent colors used in the PowerPoint template are Blue, Gray, White.
-
Triangular Shape To Represent 16 Variable In It Sample Business Plans Free PowerPoint Slides
We present our triangular shape to represent 16 variable in it sample business plans free PowerPoint Slides.Download our Triangles PowerPoint Templates because Our PowerPoint Templates and Slides are created by a hardworking bunch of busybees. Always flitting around with solutions gauranteed to please. Present our Flow Charts PowerPoint Templates because Our PowerPoint Templates and Slides provide you with a vast range of viable options. Select the appropriate ones and just fill in your text. Download our Marketing PowerPoint Templates because Our PowerPoint Templates and Slides provide you with a vast range of viable options. Select the appropriate ones and just fill in your text. Download and present our Process and Flows PowerPoint Templates because You canTake a leap off the starting blocks with our PowerPoint Templates and Slides. They will put you ahead of the competition in quick time. Use our Business PowerPoint Templates because Our PowerPoint Templates and Slides will fulfill your every need. Use them and effectively satisfy the desires of your audience.Use these PowerPoint slides for presentations relating to Pyramid, arrow, icon, website, page, manual, speech, step, layout, advertise, triangle, tutorial, interface, business, tag, vector, sign, presentation, portfolio,symbol, element,simple, idea, emblem, creative, illustration, options, instruction, web, direction, design, choice,infographic, banner, art, style, menu, background, advertising, promotion, product, button. The prominent colors used in the PowerPoint template are Blue light, White, Gray.
-
Agenda For Graphical Representation Of Research IT Download PDF
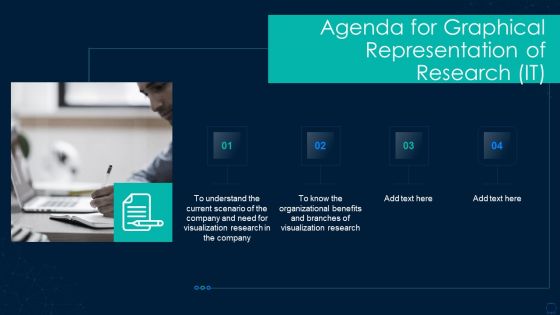
This is a agenda for graphical representation of research it download pdf template with various stages. Focus and dispense information on four stages using this creative set, that comes with editable features. It contains large content boxes to add your information on topics like agenda for graphical representation of research it. You can also showcase facts, figures, and other relevant content using this PPT layout. Grab it now.
-
Graphical Representation Of Research IT D3 Data Driven Documents Infographics PDF
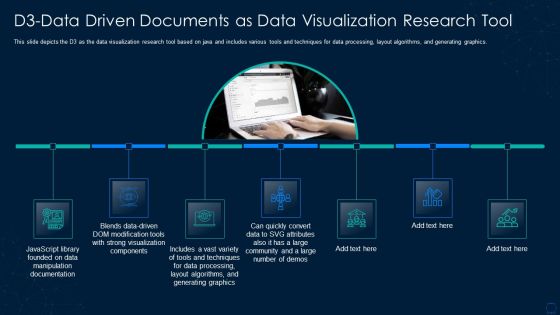
This slide depicts the D3 as the data visualization research tool based on java and includes various tools and techniques for data processing, layout algorithms, and generating graphics. Presenting graphical representation of research it d3 data driven documents infographics pdf to provide visual cues and insights. Share and navigate important information on seven stages that need your due attention. This template can be used to pitch topics like documentation, graphics, techniques, community. In addtion, this PPT design contains high resolution images, graphics, etc, that are easily editable and available for immediate download.
-
Graphical Representation Of Research IT Different Types Of Analysis For Data Visualization Structure PDF
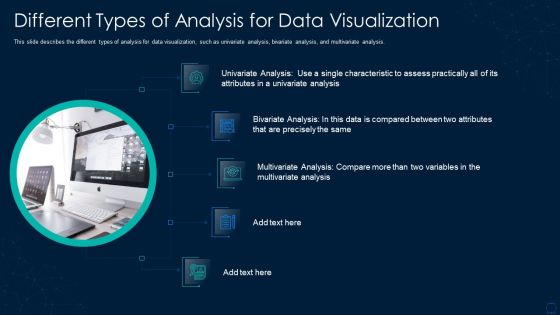
This slide describes the different types of analysis for data visualization, such as univariate analysis, bivariate analysis, and multivariate analysis. This is a graphical representation of research it different types of analysis for data visualization structure pdf template with various stages. Focus and dispense information on five stages using this creative set, that comes with editable features. It contains large content boxes to add your information on topics like different types of analysis for data visualization. You can also showcase facts, figures, and other relevant content using this PPT layout. Grab it now.
-
Graphical Representation Of Research IT Finereport As Visualization Research Tool Structure PDF
This slide describes the fine report as the visualization research tool that can connect to various databases directly, making it easier to design. Presenting graphical representation of research it finereport as visualization research tool structure pdf to provide visual cues and insights. Share and navigate important information on eight stages that need your due attention. This template can be used to pitch topics like application, dashboards, databases. In addtion, this PPT design contains high resolution images, graphics, etc, that are easily editable and available for immediate download.
-
Graphical Representation Of Research IT Highcharts As Data Visualization Research Demonstration PDF
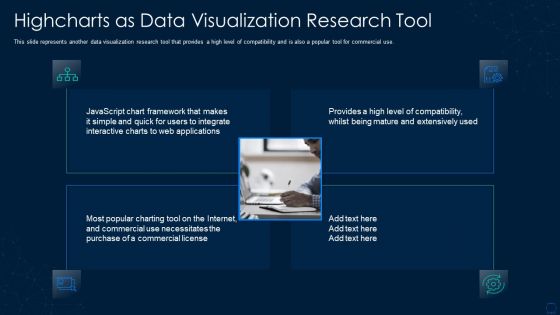
This slide represents another data visualization research tool that provides a high level of compatibility and is also a popular tool for commercial use. This is a graphical representation of research it highcharts as data visualization research demonstration pdf template with various stages. Focus and dispense information on four stages using this creative set, that comes with editable features. It contains large content boxes to add your information on topics like highcharts as data visualization research tool. You can also showcase facts, figures, and other relevant content using this PPT layout. Grab it now.
-
Graphical Representation Of Research IT Overview And Objective Slides PDF
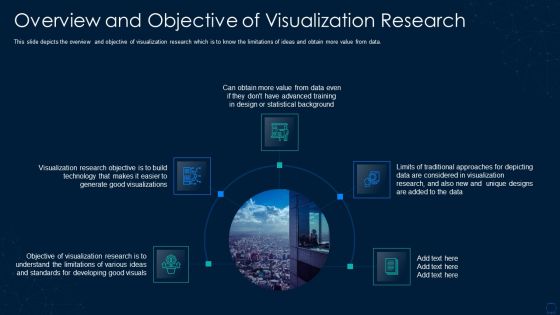
Presenting graphical representation of research it overview and objective slides pdf to provide visual cues and insights. Share and navigate important information on five stages that need your due attention. This template can be used to pitch topics like technology, developing, design. In addtion, this PPT design contains high resolution images, graphics, etc, that are easily editable and available for immediate download.
-
Graphical Representation Of Research IT Why Do We Need Visualization Research Graphics PDF
This is a graphical representation of research it why do we need visualization research graphics pdf template with various stages. Focus and dispense information on five stages using this creative set, that comes with editable features. It contains large content boxes to add your information on topics like why do we need visualization research. You can also showcase facts, figures, and other relevant content using this PPT layout. Grab it now.
-
Table Of Contents For Graphical Representation Of Research IT Data Elements PDF
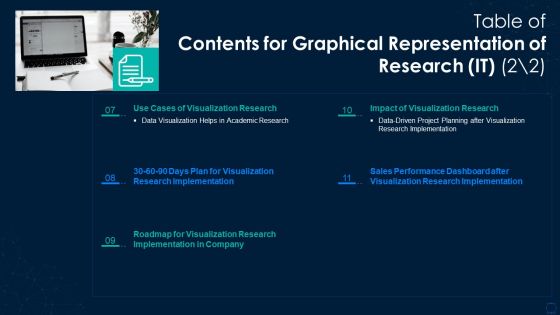
Presenting table of contents for graphical representation of research it data elements pdf to provide visual cues and insights. Share and navigate important information on five stages that need your due attention. This template can be used to pitch topics like implementation, plan, sales performance. In addtion, this PPT design contains high resolution images, graphics, etc, that are easily editable and available for immediate download.
-
Table Of Contents For Graphical Representation Of Research IT Template PDF
This is a table of contents for graphical representation of research it template pdf template with various stages. Focus and dispense information on six stages using this creative set, that comes with editable features. It contains large content boxes to add your information on topics like analysis, documents, data. You can also showcase facts, figures, and other relevant content using this PPT layout. Grab it now.
-
Graphical Representation Of Research IT Lack Of Data Understanding Slides PDF
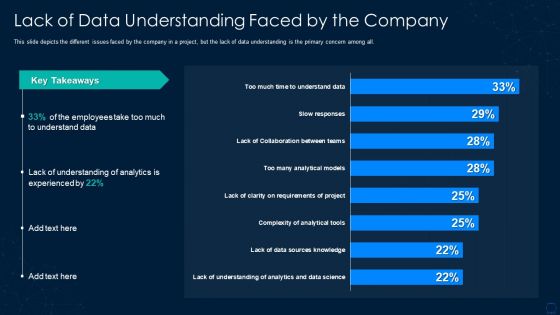
This slide depicts the different issues faced by the company in a project, but the lack of data understanding is the primary concern among all. Deliver an awe inspiring pitch with this creative graphical representation of research it lack of data understanding slides pdf bundle. Topics like lack of data understanding faced by the company can be discussed with this completely editable template. It is available for immediate download depending on the needs and requirements of the user.
-
Graphical Representation Of Research IT Sales Performance Dashboard Sample PDF
This slide depicts the dashboard for sales performance after the implementation of visualization research based on revenue, quantity, regional sales. Deliver and pitch your topic in the best possible manner with this graphical representation of research it sales performance dashboard sample pdf. Use them to share invaluable insights on sales performance dashboard after visualization research implementation and impress your audience. This template can be altered and modified as per your expectations. So, grab it now.
-
Graphical Representation Of Research IT 30 60 90 Days Plan For Visualization Diagrams PDF
This slide shows the 30 60 90 days plan for visualization research, such as knowing and sorting the data, analyzing the information, and different tools required. This is a graphical representation of research it 30 60 90 days plan for visualization diagrams pdf template with various stages. Focus and dispense information on three stages using this creative set, that comes with editable features. It contains large content boxes to add your information on topics like information, required, analyzing. You can also showcase facts, figures, and other relevant content using this PPT layout. Grab it now.
-
Graphical Representation Of Research IT Bivariate Analysis Techniques Formats PDF
This slide describes the second analysis technique, bivariate analysis for data visualization, which includes three plots line, bar, and scatter. Deliver and pitch your topic in the best possible manner with this graphical representation of research it bivariate analysis techniques formats pdf. Use them to share invaluable insights on bivariate analysis techniques for data visualization and impress your audience. This template can be altered and modified as per your expectations. So, grab it now.
-
Graphical Representation Of Research IT Importance Of Visualization Research In Business Summary PDF
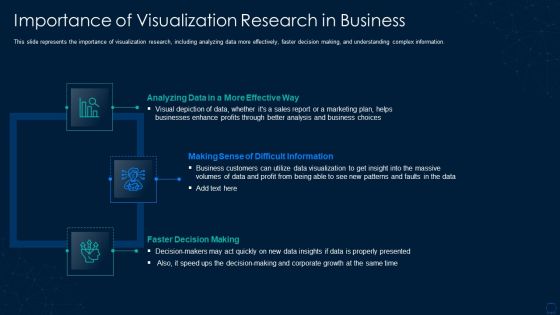
This slide represents the importance of visualization research, including analyzing data more effectively, faster decision making, and understanding complex information. This is a graphical representation of research it importance of visualization research in business summary pdf template with various stages. Focus and dispense information on three stages using this creative set, that comes with editable features. It contains large content boxes to add your information on topics like business customers, marketing plan, growth, data. You can also showcase facts, figures, and other relevant content using this PPT layout. Grab it now.
-
Graphical Representation Of Research IT Tableau As Visualization Research Tool Graphics PDF
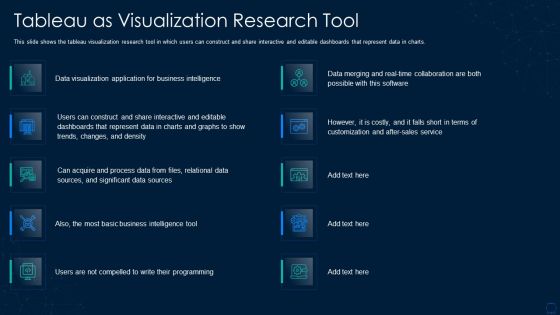
This slide shows the tableau visualization research tool in which users can construct and share interactive and editable dashboards that represent data in charts. Deliver and pitch your topic in the best possible manner with this graphical representation of research it tableau as visualization research tool graphics pdf. Use them to share invaluable insights on process data, sources, sales, application and impress your audience. This template can be altered and modified as per your expectations. So, grab it now.
-
Icons Slide For Graphical Representation Of Research IT Information PDF
Presenting our innovatively structured icons slide for graphical representation of research it information pdf set of slides. The slides contain a hundred percent editable icons. You can replace these icons without any inconvenience. Therefore, pick this set of slides and create a striking presentation.
-
Graphical Representation Of Research IT Data Driven Project Planning Structure PDF
This slide depicts the impact of visualization research implementation, which results in data driven project planning, due to which there is a 23 times increase in happy customers. This is a graphical representation of research it data driven project planning structure pdf template with various stages. Focus and dispense information on three stages using this creative set, that comes with editable features. It contains large content boxes to add your information on topics like profit, customers, strategy. You can also showcase facts, figures, and other relevant content using this PPT layout. Grab it now.
-
Graphical Representation Of Research IT Data Visualization Helps In Academic Research Microsoft PDF
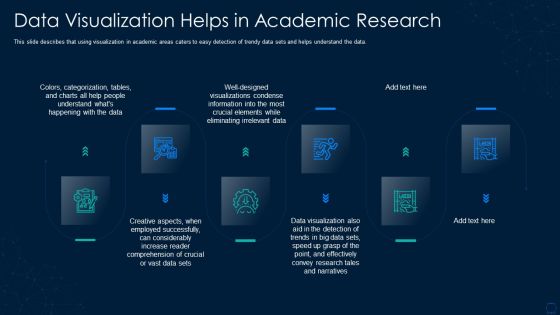
This slide describes that using visualization in academic areas caters to easy detection of trendy data sets and helps understand the data. Presenting graphical representation of research it data visualization helps in academic research microsoft pdf to provide visual cues and insights. Share and navigate important information on six stages that need your due attention. This template can be used to pitch topics like data visualization helps in academic research. In addtion, this PPT design contains high resolution images, graphics, etc, that are easily editable and available for immediate download.
-
Graphical Representation Of Research IT Google Charts Tool For Data Visualization Introduction PDF
This slide depicts google charts as the tool for data visualization, which can extract data from various sources, including SQL, databases, google sheets. This is a graphical representation of research it google charts tool for data visualization introduction pdf template with various stages. Focus and dispense information on five stages using this creative set, that comes with editable features. It contains large content boxes to add your information on topics like dynamic, databases, sources, technology. You can also showcase facts, figures, and other relevant content using this PPT layout. Grab it now.
-
Graphical Representation Of Research IT Information Visualization Research Branch Icons PDF
This slide explains information visualization as a branch of visualization research that includes visuals like histograms, trend graphs, flow charts. Presenting graphical representation of research it information visualization research branch icons pdf to provide visual cues and insights. Share and navigate important information on four stages that need your due attention. This template can be used to pitch topics like geographic, information, design. In addtion, this PPT design contains high resolution images, graphics, etc, that are easily editable and available for immediate download.
-
Graphical Representation Of Research IT Issue Of Absence Of Goal Designs PDF
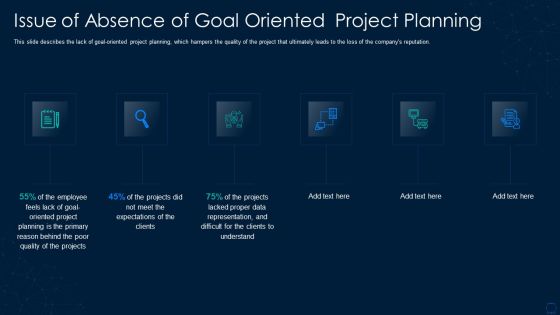
This is a graphical representation of research it issue of absence of goal designs pdf template with various stages. Focus and dispense information on six stages using this creative set, that comes with editable features. It contains large content boxes to add your information on topics like planning, projects, quality. You can also showcase facts, figures, and other relevant content using this PPT layout. Grab it now.
-
Graphical Representation Of Research IT Roadmap For Visualization Research Summary PDF
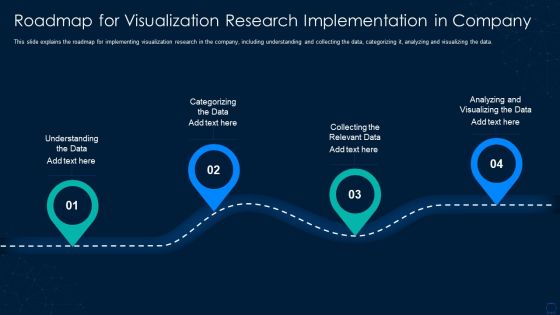
This slide explains the roadmap for implementing visualization research in the company, including understanding and collecting the data, categorizing it, analyzing and visualizing the data. Presenting graphical representation of research it roadmap for visualization research summary pdf to provide visual cues and insights. Share and navigate important information on four stages that need your due attention. This template can be used to pitch topics like roadmap for visualization research implementation in company. In addtion, this PPT design contains high resolution images, graphics, etc, that are easily editable and available for immediate download.
-
Graphical Representation Of Research IT Scientific Visualization Branch Information PDF
This slide explains scientific visualization, the first branch of visualization research which focuses on 3D phenomena and visually represents scientific data. This is a graphical representation of research it scientific visualization branch information pdf template with various stages. Focus and dispense information on four stages using this creative set, that comes with editable features. It contains large content boxes to add your information on topics like scientific visualization branch of visualization research. You can also showcase facts, figures, and other relevant content using this PPT layout. Grab it now.
-
Graphical Representation Of Research IT Univariate Analysis Techniques Icons PDF
This slide depicts the univariate analysis technique for data visualization, including distribution, box and whisker, and the violin plot. Presenting graphical representation of research it univariate analysis techniques icons pdf to provide visual cues and insights. Share and navigate important information on three stages that need your due attention. This template can be used to pitch topics like information, supplies, information, target. In addtion, this PPT design contains high resolution images, graphics, etc, that are easily editable and available for immediate download.
-
Graphical Representation Of Research IT Visual Analytics Branch Background PDF
This slide shows visual analytics, the last branch of visualization research, which emerged from the advancements in the other two branches and mainly focused on analytical reasoning. This is a graphical representation of research it visual analytics branch background pdf template with various stages. Focus and dispense information on five stages using this creative set, that comes with editable features. It contains large content boxes to add your information on topics like visual analytics branch of visualization research. You can also showcase facts, figures, and other relevant content using this PPT layout. Grab it now.
-
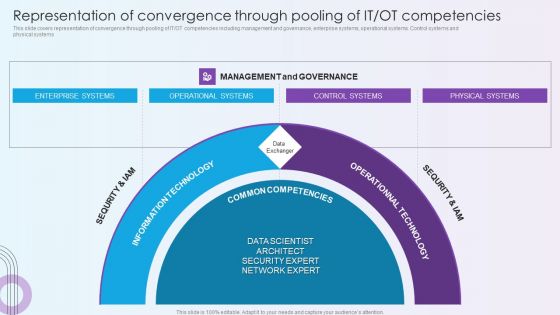
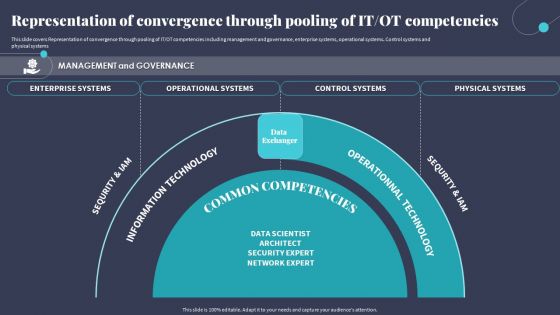
Convergence Strategy Information Representation Of Convergence Through Pooling Of IT Ideas PDF
This slide covers Representation of convergence through pooling of IT or OT competencies including management and governance, enterprise systems, operational systems. Control systems and physical systems. This is a Convergence Strategy Information Representation Of Convergence Through Pooling Of IT Ideas PDF template with various stages. Focus and dispense information on one stages using this creative set, that comes with editable features. It contains large content boxes to add your information on topics like Information Technology, Sequrity And IAM, Operationnal Technology, Common Competencies. You can also showcase facts, figures, and other relevant content using this PPT layout. Grab it now.
-
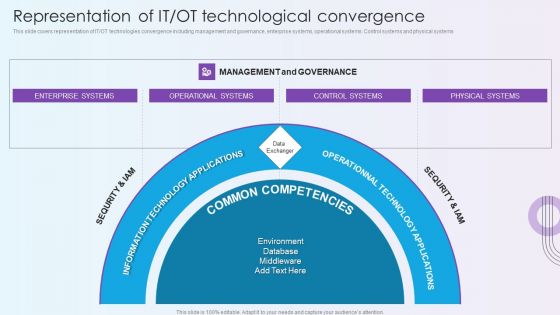
Convergence Strategy Information Representation Of IT OT Technological Convergence Introduction PDF
This slide covers representation of IT or OT technologies convergence including management and governance, enterprise systems, operational systems. Control systems and physical systems. Presenting Convergence Strategy Information Representation Of IT OT Technological Convergence Introduction PDF to provide visual cues and insights. Share and navigate important information on one stages that need your due attention. This template can be used to pitch topics like Information Technology, Sequrity And IAM, Operationnal Technology, Common Competencies. In addtion, this PPT design contains high resolution images, graphics, etc, that are easily editable and available for immediate download.
-
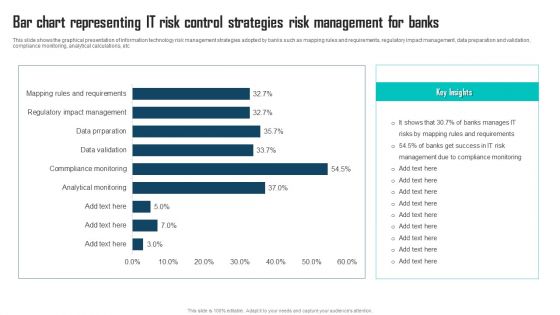
Bar Chart Representing IT Risk Control Strategies Risk Management For Banks Themes PDF
This slide shows the graphical presentation of information technology risk management strategies adopted by banks such as mapping rules and requirements, regulatory impact management, data preparation and validation, compliance monitoring, analytical calculations, etc. Pitch your topic with ease and precision using this Bar Chart Representing IT Risk Control Strategies Risk Management For Banks Themes PDF. This layout presents information on IT Risk Management, Compliance Monitoring, Manages IT Risks. It is also available for immediate download and adjustment. So, changes can be made in the color, design, graphics or any other component to create a unique layout.
-
Representation Of IT OT Technological Convergence Managing Organizational Transformation Topics PDF
This slide covers representation of IT OT technologies convergence including management and governance, enterprise systems, operational systems. Control systems and physical systems. Deliver an awe inspiring pitch with this creative Representation Of IT OT Technological Convergence Managing Organizational Transformation Topics PDF bundle. Topics like Information Technology, Operationnal Technology, Physical Systems can be discussed with this completely editable template. It is available for immediate download depending on the needs and requirements of the user.
-
Digitalization Of Operative Enterprises Representation Of Convergence Through Pooling Of IT OT Competencies Mockup PDF
This slide covers representation of convergence through pooling of IT or OT competencies including management and governance, enterprise systems, operational systems. Control systems and physical systems. Presenting Digitalization Of Operative Enterprises Representation Of Convergence Through Pooling Of IT OT Competencies Mockup PDF to provide visual cues and insights. Share and navigate important information on two stages that need your due attention. This template can be used to pitch topics like Enterprise Systems, Operational Systems, Control Systems. In addtion, this PPT design contains high resolution images, graphics, etc, that are easily editable and available for immediate download.
-
Digitalization Of Operative Enterprises Representation Of IT OT Technological Convergence Rules PDF
This slide covers representation of IT or OT technologies convergence including management and governance, enterprise systems, operational systems. Control systems and physical systems This is a Digitalization Of Operative Enterprises Representation Of IT OT Technological Convergence Rules PDF template with various stages. Focus and dispense information on two stages using this creative set, that comes with editable features. It contains large content boxes to add your information on topics like Control Systems, Operational Systems, Physical Systems. You can also showcase facts, figures, and other relevant content using this PPT layout. Grab it now.
-
Smart Venture Digitial Transformation Representation Of IT OT Technological Convergence Download PDF
This slide covers representation of IT or OT technologies convergence including management and governance, enterprise systems, operational systems. Control systems and physical systems. Presenting Smart Venture Digitial Transformation Representation Of IT OT Technological Convergence Download PDF to provide visual cues and insights. Share and navigate important information on one stages that need your due attention. This template can be used to pitch topics like Enterprise Systems, Operational Systems, Control Systems. In addtion, this PPT design contains high resolution images, graphics, etc, that are easily editable and available for immediate download.
-
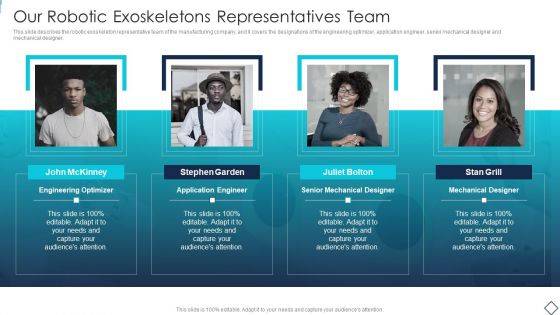
Robotic Armor IT Our Robotic Exoskeletons Representatives Team Background PDF
This slide describes the robotic exoskeleton representative team of the manufacturing company, and it covers the designations of the engineering optimizer, application engineer, senior mechanical designer and mechanical designer. This is a Robotic Armor IT Our Robotic Exoskeletons Representatives Team Background PDF template with various stages. Focus and dispense information on four stages using this creative set, that comes with editable features. It contains large content boxes to add your information on topics like Engineering Optimizer, Application Engineer, Senior Mechanical Designer, Mechanical Designer. You can also showcase facts, figures, and other relevant content using this PPT layout. Grab it now.
-
Collaborative Robots IT Our Cobots Representatives Team Ppt Layouts Show PDF
This slide depicts our cobots representatives team, including the engineer optimizer, application engineer, senior mechanical designer, and mechanical designer. Formulating a presentation can take up a lot of effort and time, so the content and message should always be the primary focus. The visuals of the PowerPoint can enhance the presenter is message, so our Collaborative Robots IT Our Cobots Representatives Team Ppt Layouts Show PDF was created to help save time. Instead of worrying about the design, the presenter can concentrate on the message while our designers work on creating the ideal templates for whatever situation is needed. Slidegeeks has experts for everything from amazing designs to valuable content, we have put everything into Collaborative Robots IT Our Cobots Representatives Team Ppt Layouts Show PDF.
-
Representation Of Convergence Through Pooling Of IT OT Competencies Slides PDF
This slide covers Representation of convergence through pooling of IT OT competencies including management and governance, enterprise systems, operational systems. Control systems and physical systems. Coming up with a presentation necessitates that the majority of the effort goes into the content and the message you intend to convey. The visuals of a PowerPoint presentation can only be effective if it supplements and supports the story that is being told. Keeping this in mind our experts created Representation Of Convergence Through Pooling Of IT OT Competencies Slides PDF to reduce the time that goes into designing the presentation. This way, you can concentrate on the message while our designers take care of providing you with the right template for the situation.
-
Tactics For Incorporating OT And IT With The Latest PI System Representation Of IT OT Technological Convergence Icons PDF
This slide covers representation of IT OT technologies convergence including management and governance, enterprise systems, operational systems. Control systems and physical systems. The Tactics For Incorporating OT And IT With The Latest PI System Representation Of IT OT Technological Convergence Icons PDF is a compilation of the most recent design trends as a series of slides. It is suitable for any subject or industry presentation, containing attractive visuals and photo spots for businesses to clearly express their messages. This template contains a variety of slides for the user to input data, such as structures to contrast two elements, bullet points, and slides for written information. Slidegeeks is prepared to create an impression.
-
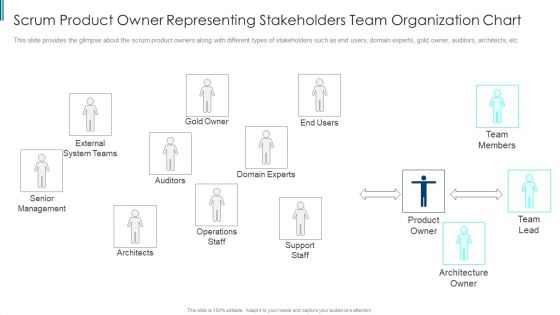
Scrum Staff Organization Map IT Scrum Product Owner Representing Infographics PDF
This is a scrum staff organization map it scrum product owner representing infographics pdf template with various stages. Focus and dispense information on one stages using this creative set, that comes with editable features. It contains large content boxes to add your information on topics like team members, product owner, architecture owner, operations staff. You can also showcase facts, figures, and other relevant content using this PPT layout. Grab it now.


