Interpreting data PowerPoint Presentation Templates and Google Slides
-
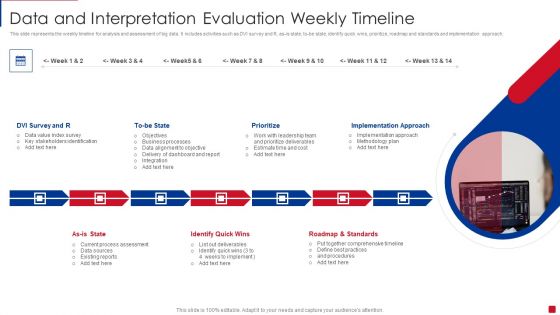
Data And Interpretation Evaluation Weekly Timeline Elements PDF
This slide represents the weekly timeline for analysis and assessment of big data. It includes activities such as DVI survey and R, as-is state, to-be state, identify quick wins, prioritize, roadmap and standards and implementation approach. Presenting Data And Interpretation Evaluation Weekly Timeline Elements PDF to dispense important information. This template comprises seven stages. It also presents valuable insights into the topics including Prioritize, Implementation Approach, Identify Quick Wins. This is a completely customizable PowerPoint theme that can be put to use immediately. So, download it and address the topic impactfully.
-
Data And Interpretation Skills Evaluation Icon Demonstration PDF
Persuade your audience using this Data And Interpretation Skills Evaluation Icon Demonstration PDF. This PPT design covers four stages, thus making it a great tool to use. It also caters to a variety of topics including Interpretation, Skills Evaluation. Download this PPT design now to present a convincing pitch that not only emphasizes the topic but also showcases your presentation skills.
-
Data Interpretation And Evaluation Opportunities In Supply Chain Management Structure PDF
This slide represents the supply chain data analytics and assessment opportunities. It includes sales, inventory, and operations planning, sourcing, production, warehousing, transportation, point of sale and consumer. Presenting Data Interpretation And Evaluation Opportunities In Supply Chain Management Structure PDF to dispense important information. This template comprises six stages. It also presents valuable insights into the topics including Supplier Risk Management, Projection Of Incoming Goods, Projection Of Inventory. This is a completely customizable PowerPoint theme that can be put to use immediately. So, download it and address the topic impactfully.
-
Data Interpretation And Evaluation Readiness Form Of Company Summary PDF
This slide represents the survey results of assessment of data and analytics skills conducted by an organization. It includes five questions along with their confidence levels. Showcasing this set of slides titled Data Interpretation And Evaluation Readiness Form Of Company Summary PDF. The topics addressed in these templates are Individual Analyze, Capabilities, Analytics Tools. All the content presented in this PPT design is completely editable. Download it and make adjustments in color, background, font etc. as per your unique business setting.
-
Data Science Capability And Interpretation Maturity Evaluation Model Download PDF
Presenting Data Science Capability And Interpretation Maturity Evaluation Model Download PDF to dispense important information. This template comprises five stages. It also presents valuable insights into the topics including Organization And Culture, Data And Technology, Ability To Ask Question. This is a completely customizable PowerPoint theme that can be put to use immediately. So, download it and address the topic impactfully. Presenting Data Science Capability And Interpretation Maturity Evaluation Model Download PDF to dispense important information. This template comprises five stages. It also presents valuable insights into the topics including Organization And Culture, Data And Technology, Ability To Ask Question. This is a completely customizable PowerPoint theme that can be put to use immediately. So, download it and address the topic impactfully.
-
Digital Marketing Data Interpretation And Evaluation Icon Clipart PDF
Presenting Digital Marketing Data Interpretation And Evaluation Icon Clipart PDF to dispense important information. This template comprises four stages. It also presents valuable insights into the topics including Digital Marketing, Data Interpretation, Evaluation Icon. This is a completely customizable PowerPoint theme that can be put to use immediately. So, download it and address the topic impactfully.
-
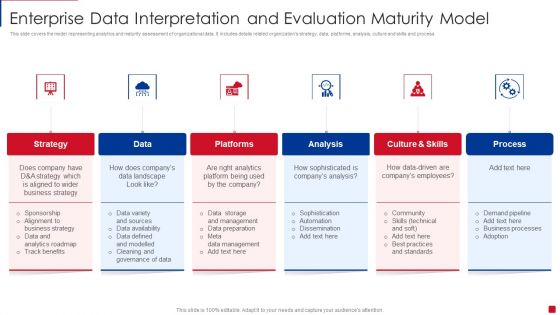
Enterprise Data Interpretation And Evaluation Maturity Model Slides PDF
This slide covers the model representing analytics and maturity assessment of organizational data. It includes details related organizations strategy, data, platforms, analysis, culture and skills and process Persuade your audience using this Enterprise Data Interpretation And Evaluation Maturity Model Slides PDF. This PPT design covers six stages, thus making it a great tool to use. It also caters to a variety of topics including Platforms, Analysis, Culture And Skills. Download this PPT design now to present a convincing pitch that not only emphasizes the topic but also showcases your presentation skills.
-
Six Steps Of Risk Evaluation In Data Interpretation Sources Brochure PDF
This slide represents the six steps to be followed for using data analytics in risk assessment. It includes six steps such as build library of potential risks, spot test data and validate KPIs, conduct all data sources and automate testing, dig deeper into results, report and showcase work and expand and repeat. Presenting Six Steps Of Risk Evaluation In Data Interpretation Sources Brochure PDF to dispense important information. This template comprises ten stages. It also presents valuable insights into the topics including Target Personas, Define The Questions, Define The Business Model. This is a completely customizable PowerPoint theme that can be put to use immediately. So, download it and address the topic impactfully.
-
Development Of Risk Management Strategies With Data Interpretation And Evaluation Summary PDF
This slide demonstrates that how data analytics helps pharmaceutical industry to devise robust risk management strategies. It shows the business challenge faced by the client, benefits of solution offered and big data analytics predictive insights. Persuade your audience using this Development Of Risk Management Strategies With Data Interpretation And Evaluation Summary PDF. This PPT design covers three stages, thus making it a great tool to use. It also caters to a variety of topics including Business Challenge, Benefits Solution Offered, Big Data Analytics. Download this PPT design now to present a convincing pitch that not only emphasizes the topic but also showcases your presentation skills.
-
Six Steps Of Risk Evaluation In Data Interpretation Introduction PDF
This slide represents the six steps to be followed for using data analytics in risk assessment. It includes six steps such as build library of potential risks, spot test data and validate KPIs, conduct all data sources and automate testing, dig deeper into results, report and showcase work and expand and repeat. Persuade your audience using this Six Steps Of Risk Evaluation In Data Interpretation Introduction PDF. This PPT design covers six stages, thus making it a great tool to use. It also caters to a variety of topics including Expand And Repeat, Report Showcase Work, Potential Risks. Download this PPT design now to present a convincing pitch that not only emphasizes the topic but also showcases your presentation skills.
-
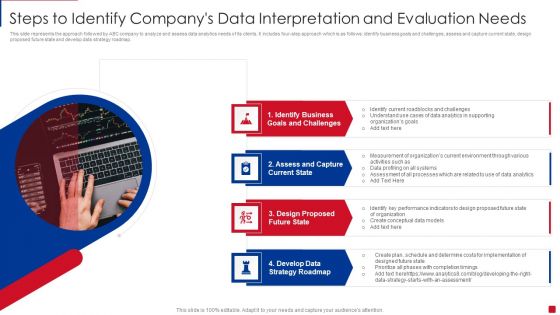
Steps To Identify Companys Data Interpretation And Evaluation Needs Portrait PDF
This slide represents the approach followed by ABC company to analyze and assess data analytics needs of its clients. It includes four step approach which is as follows identify business goals and challenges, assess and capture current state, design proposed future state and develop data strategy roadmap Presenting Steps To Identify Companys Data Interpretation And Evaluation Needs Portrait PDF to dispense important information. This template comprises four stages. It also presents valuable insights into the topics including Assess Current State, Business Goals Challenges, Design Future State. This is a completely customizable PowerPoint theme that can be put to use immediately. So, download it and address the topic impactfully.
-
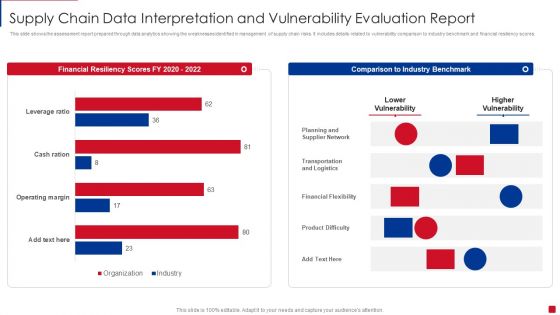
Supply Chain Data Interpretation And Vulnerability Evaluation Report Pictures PDF
This slide shows the assessment report prepared through data analytics showing the weaknesses identified in management of supply chain risks. It includes details related to vulnerability comparison to industry benchmark and financial resiliency scores Showcasing this set of slides titled Supply Chain Data Interpretation And Vulnerability Evaluation Report Pictures PDF. The topics addressed in these templates are Planning And Supplier Network, Transportation And Logistics, Financial Flexibility. All the content presented in this PPT design is completely editable. Download it and make adjustments in color, background, font etc. as per your unique business setting.
-
Technology And Skills Matrix For Data Interpretation And Evaluation Lifecycle Phases Slides PDF
This slide covers the matrix representing technology and skills required for each phase of data analytics and assessment infrastructure lifecycle. It includes four phases of analytics infrastructure lifecycle such as ingestion, data quality and governance, data lake administration and analytics. Presenting Technology And Skills Matrix For Data Interpretation And Evaluation Lifecycle Phases Slides PDF to dispense important information. This template comprises four stages. It also presents valuable insights into the topics including Ingestion, Data Lake Administration, Data Quality And Governance. This is a completely customizable PowerPoint theme that can be put to use immediately. So, download it and address the topic impactfully.
-
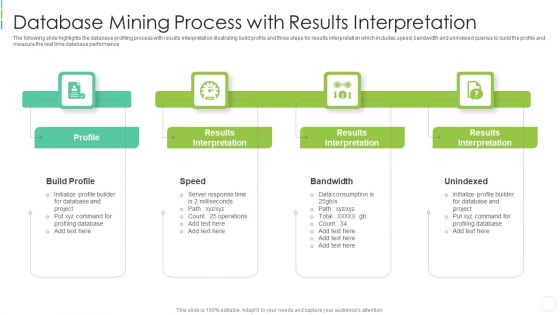
Database Mining Process With Results Interpretation Slides PDF
The following slide highlights the database profiling process with results interpretation illustrating build profile and three steps for results interpretation which includes speed, bandwidth and unindexed queries to build the profile and measure the real time database performance Presenting database mining process with results interpretation slides pdf to dispense important information. This template comprises four stages. It also presents valuable insights into the topics including build profile, bandwidth, response, database . This is a completely customizable PowerPoint theme that can be put to use immediately. So, download it and address the topic impactfully.
-
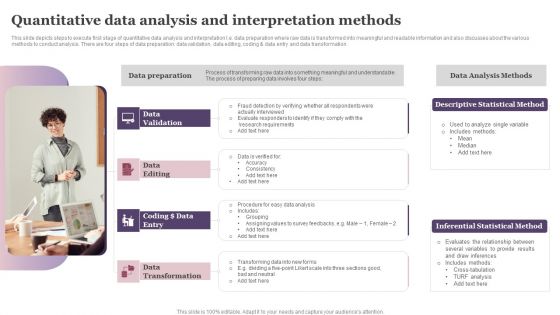
Quantitative Data Analysis And Interpretation Methods Ppt Ideas Graphics Tutorials PDF
This slide depicts steps to execute first stage of quantitative data analysis and interpretation I.e. data preparation where raw data is transformed into meaningful and readable information and also discusses about the various methods to conduct analysis. There are four steps of data preparation data validation, data editing, coding and data entry and data transformation. Presenting Quantitative Data Analysis And Interpretation Methods Ppt Ideas Graphics Tutorials PDF to dispense important information. This template comprises four stages. It also presents valuable insights into the topics including Data Validation, Data Editing, Data Preparation. This is a completely customizable PowerPoint theme that can be put to use immediately. So, download it and address the topic impactfully.
-
Data Interpretation Ppt Powerpoint Presentation Complete Deck With Slides
Improve your presentation delivery using this Data Interpretation Ppt Powerpoint Presentation Complete Deck With Slides. Support your business vision and objectives using this well-structured PPT deck. This template offers a great starting point for delivering beautifully designed presentations on the topic of your choice. Comprising fourteen this professionally designed template is all you need to host discussion and meetings with collaborators. Each slide is self-explanatory and equipped with high-quality graphics that can be adjusted to your needs. Therefore, you will face no difficulty in portraying your desired content using this PPT slideshow. This PowerPoint slideshow contains every important element that you need for a great pitch. It is not only editable but also available for immediate download and utilization. The color, font size, background, shapes everything can be modified to create your unique presentation layout. Therefore, download it now.
-
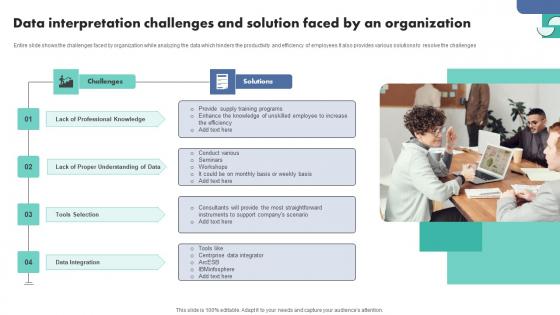
Data Interpretation Challenges And Solution Faced By An Organization Infographics Pdf
Entire slide shows the challenges faced by organization while analyzing the data which hinders the productivity and efficiency of employees It also provides various solutions to resolve the challenges.Pitch your topic with ease and precision using this Data Interpretation Challenges And Solution Faced By An Organization Infographics Pdf This layout presents information on Professional Knowledge, Proper Understanding Data, Tools Selection It is also available for immediate download and adjustment. So, changes can be made in the color, design, graphics or any other component to create a unique layout.
-
Data Interpretation Dashboard For Startups To Analysis Websites Visit Themes Pdf
This slides outlines the data analytic for startups to keep a continuous check on proactively and anticipating needs of clients by tracking the record of website visits.Showcasing this set of slides titled Data Interpretation Dashboard For Startups To Analysis Websites Visit Themes Pdf The topics addressed in these templates are Data Interpretation, Dashboard Startups, Analysis Websites Visit All the content presented in this PPT design is completely editable. Download it and make adjustments in color, background, font etc. as per your unique business setting.
-
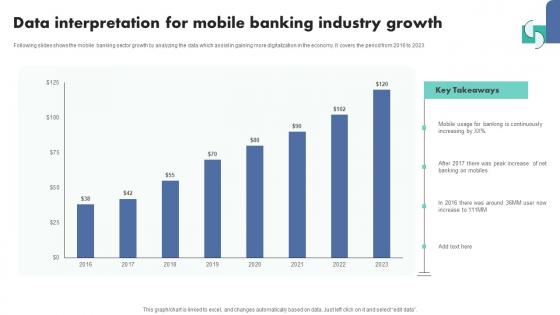
Data Interpretation For Mobile Banking Industry Growth Template Pdf
Following slides shows the mobile banking sector growth by analyzing the data which assist in gaining more digitalization in the economy. It covers the period from 2016 to 2023.Pitch your topic with ease and precision using this Data Interpretation For Mobile Banking Industry Growth Template Pdf This layout presents information on Banking Continuously, Banking Mobiles, Key Takeaways It is also available for immediate download and adjustment. So, changes can be made in the color, design, graphics or any other component to create a unique layout.
-
Data Interpretation Icon For Financial Sector Mockup Pdf
Showcasing this set of slides titled Data Interpretation Icon For Financial Sector Mockup Pdf The topics addressed in these templates are Data Interpretation Icon, Measure Business Growth All the content presented in this PPT design is completely editable. Download it and make adjustments in color, background, font etc. as per your unique business setting.
-
Data Interpretation Icon To Measure Business Growth Background Pdf
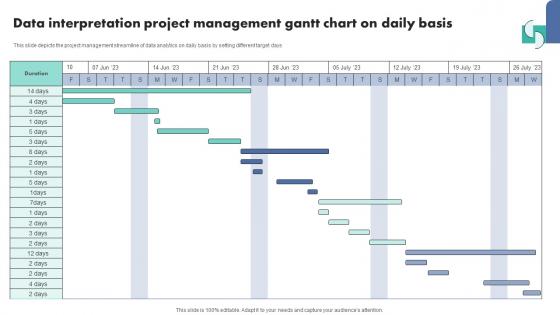
This slide depicts the project management streamline of data analytics on daily basis by setting different target days.Pitch your topic with ease and precision using this Data Interpretation Icon To Measure Business Growth Background Pdf This layout presents information on Data Interpretation, Project Management, Gantt Chart It is also available for immediate download and adjustment. So, changes can be made in the color, design, graphics or any other component to create a unique layout.
-
Data Interpretation Project Management Gantt Chart On Daily Basis Template Pdf
Showcasing this set of slides titled Data Interpretation Project Management Gantt Chart On Daily Basis Template Pdf The topics addressed in these templates are Data Interpretation Icon, Measure Business Growth All the content presented in this PPT design is completely editable. Download it and make adjustments in color, background, font etc. as per your unique business setting.
-
Financial Business Growth Data Interpretation Themes Pdf
Following slides shows the data analysis of business financial growth by setting up a target and actual growth attain which assist in forecasting the desired outcomes of the company . It covers the period from 2015 to 2023.Pitch your topic with ease and precision using this Financial Business Growth Data Interpretation Themes Pdf This layout presents information on Financial Business, Growth Data Interpretation It is also available for immediate download and adjustment. So, changes can be made in the color, design, graphics or any other component to create a unique layout.
-
Five Qualitative Data Interpretation Methods Diagrams Pdf
This slides shows various five qualitative methods for data analytics which assist in delivering relevant products in the market. The methods are content, thematic, etc.Showcasing this set of slides titled Five Qualitative Data Interpretation Methods Diagrams Pdf The topics addressed in these templates are Concepts Text, Examined, Theories Hypotheses All the content presented in this PPT design is completely editable. Download it and make adjustments in color, background, font etc. as per your unique business setting.
-
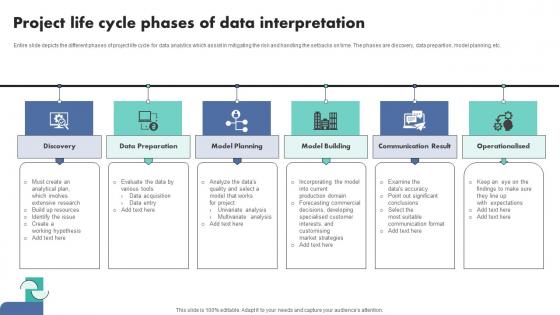
Project Life Cycle Phases Of Data Interpretation Demonstration Pdf
Entire slide depicts the different phases of project life cycle for data analytics which assist in mitigating the risk and handling the setbacks on time. The phases are discovery, data prepartion, model planning, etc.Pitch your topic with ease and precision using this Project Life Cycle Phases Of Data Interpretation Demonstration Pdf This layout presents information on Data Preparation, Model Planning, Model Building It is also available for immediate download and adjustment. So, changes can be made in the color, design, graphics or any other component to create a unique layout.
-
Various Data Interpretation Tools Comparison Matrix Ideas Pdf
Following slide outlines the various tools of data analysis by comparing on certain parameters which assist in enchaining the security of tools. It also gave a brief description which tools is better than other in which parameters.Showcasing this set of slides titled Various Data Interpretation Tools Comparison Matrix Ideas Pdf The topics addressed in these templates are Customer Data, Business Intelligence, Customer Analytics All the content presented in this PPT design is completely editable. Download it and make adjustments in color, background, font etc. as per your unique business setting.
-
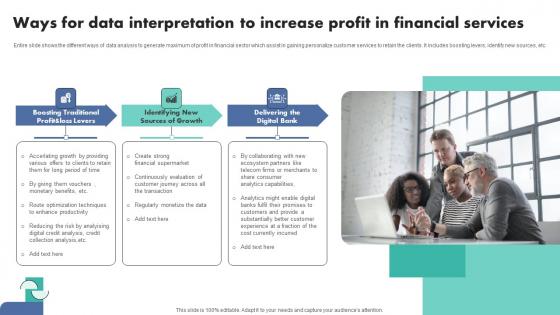
Ways For Data Interpretation To Increase Profit In Financial Services Sample Pdf
Entire slide shows the different ways of data analysis to generate maximum of profit in financial sector which assist in gaining personalize customer services to retain the cilents. It includes boosting levers, identify new sources, etc.Pitch your topic with ease and precision using this Ways For Data Interpretation To Increase Profit In Financial Services Sample Pdf This layout presents information on Boosting Traditional, Sources Growth, Analytics Capabilities It is also available for immediate download and adjustment. So, changes can be made in the color, design, graphics or any other component to create a unique layout.
-
Data Interpretation Expertise Ppt PowerPoint Presentation Complete Deck With Slides
This Data Interpretation Expertise Ppt PowerPoint Presentation Complete Deck With Slides acts as backup support for your ideas, vision, thoughts, etc. Use it to present a thorough understanding of the topic. This PPT slideshow can be utilized for both in-house and outside presentations depending upon your needs and business demands. Entailing fourteen slides with a consistent design and theme, this template will make a solid use case. As it is intuitively designed, it suits every business vertical and industry. All you have to do is make a few tweaks in the content or any other component to design unique presentations. The biggest advantage of this complete deck is that it can be personalized multiple times once downloaded. The color, design, shapes, and other elements are free to modify to add personal touches. You can also insert your logo design in this PPT layout. Therefore a well-thought and crafted presentation can be delivered with ease and precision by downloading this Data Interpretation Expertise Ppt PowerPoint Presentation Complete Deck With Slides PPT slideshow.
-
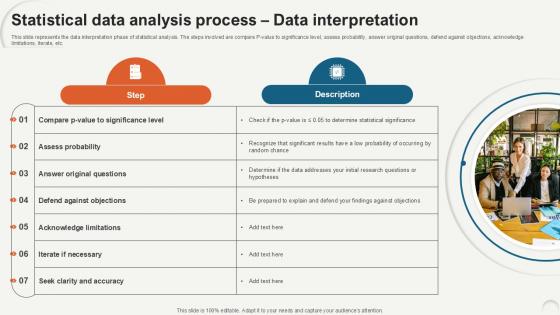
A133 Statistical Tools For Evidence Statistical Data Analysis Process Data Interpretation
This slide represents the data interpretation phase of statistical analysis. The steps involved are compare P-value to significance level, assess probability, answer original questions, defend against objections, acknowledge limitations, iterate, etc. Boost your pitch with our creative A133 Statistical Tools For Evidence Statistical Data Analysis Process Data Interpretation. Deliver an awe-inspiring pitch that will mesmerize everyone. Using these presentation templates you will surely catch everyones attention. You can browse the ppts collection on our website. We have researchers who are experts at creating the right content for the templates. So you do not have to invest time in any additional work. Just grab the template now and use them.
-
Statistical Data Analysis Process Data Interpretation Ppt Slide
This slide represents the data interpretation phase of statistical analysis. The steps involved are compare P-value to significance level, assess probability, answer original questions, defend against objections, acknowledge limitations, iterate, etc. Want to ace your presentation in front of a live audience Our Statistical Data Analysis Process Data Interpretation Ppt Slide can help you do that by engaging all the users towards you. Slidegeeks experts have put their efforts and expertise into creating these impeccable powerpoint presentations so that you can communicate your ideas clearly. Moreover, all the templates are customizable, and easy-to-edit and downloadable. Use these for both personal and commercial use.


