Histogram PowerPoint Presentation Templates and Google Slides
-
Evolution Histogram Ppt PowerPoint Presentation Complete Deck With Slides
This is a evolution histogram ppt powerpoint presentation complete deck with slides. This is a one stage process. The stages in this process are evolution histogram, business, management, strategy, marketing.
-
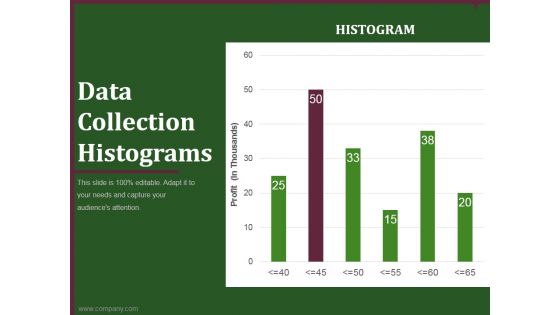
Data Collection Histograms Ppt PowerPoint Presentation Icon Slides
This is a data collection histograms ppt powerpoint presentation icon slides. This is a two stage process. The stages in this process are bar chart, finance, marketing, business, analysis.
-
Histogram 7 QC Tools Ppt PowerPoint Presentation Gallery Layout
This is a histogram 7 qc tools ppt powerpoint presentation gallery layout. This is a two stage process. The stages in this process are business, finance, marketing, strategy, analysis.
-
Histogram Ppt PowerPoint Presentation Icon Images
This is a histogram ppt powerpoint presentation icon images. This is a one stage process. The stages in this process are product, percentage, marketing, business.
-
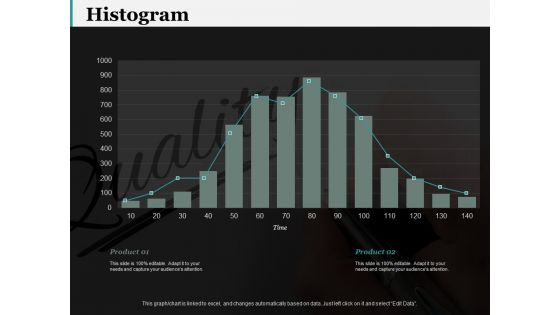
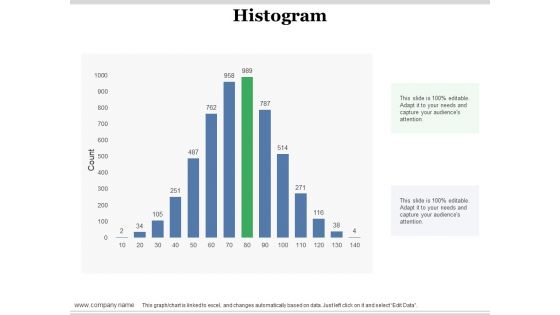
Histogram Ppt PowerPoint Presentation Gallery Objects
This is a histogram ppt powerpoint presentation gallery objects. This is a one stage process. The stages in this process are histogram, finance, business, marketing, management.
-
Thank You Evolution Histogram Ppt PowerPoint Presentation Gallery Pictures
This is a thank you evolution histogram ppt powerpoint presentation gallery pictures. This is a one stage process. The stages in this process are thank you.
-
Data Collection Histograms Ppt PowerPoint Presentation Outline Show
This is a data collection histograms ppt powerpoint presentation outline show. This is a seven stage process. The stages in this process are business, marketing, strategy, finance, analysis.
-
Data Collection Histograms Ppt PowerPoint Presentation Show Topics
This is a data collection histograms ppt powerpoint presentation show topics. This is a seven stage process. The stages in this process are business, marketing, histogram, finance, graph.
-
Data Collection Histograms Ppt PowerPoint Presentation Diagrams
This is a data collection histograms ppt powerpoint presentation diagrams. This is a seven stage process. The stages in this process are business, strategy, growth strategy, marketing, histogram, finance.
-
Data Collection Histograms Ppt PowerPoint Presentation Design Templates
This is a data collection histograms ppt powerpoint presentation design templates. This is a five stage process. The stages in this process are histogram, business, marketing, analysis, chart.
-
data collection histograms ppt powerpoint presentation example
This is a data collection histograms ppt powerpoint presentation example. This is a six stage process. The stages in this process are business, planning, marketing, histograms, graph.
-
Histogram Column Chart With Red Arrow Vector Icon Ppt PowerPoint Presentation Outline Ideas Cpb
This is a histogram column chart with red arrow vector icon ppt powerpoint presentation outline ideas cpb. This is a three stage process. The stages in this process are bar chart icon, bar graph icon, data chart icon.
-
Histogram Financial Analysis Vector Icon Ppt PowerPoint Presentation Layouts File Formats Cpb
This is a histogram financial analysis vector icon ppt powerpoint presentation layouts file formats cpb. This is a three stage process. The stages in this process are bar chart icon, bar graph icon, data chart icon.
-
Histogram Icon Showing Economic Fluctuations Ppt PowerPoint Presentation Slides Samples Cpb
This is a histogram icon showing economic fluctuations ppt powerpoint presentation slides samples cpb. This is a three stage process. The stages in this process are bar chart icon, bar graph icon, data chart icon.
-
Histogram Showing Business Trends Vector Icon Ppt PowerPoint Presentation Styles Portrait Cpb
This is a histogram showing business trends vector icon ppt powerpoint presentation styles portrait cpb. This is a three stage process. The stages in this process are bar chart icon, bar graph icon, data chart icon.
-
Histogram With Dollar For Financial Success Vector Icon Ppt PowerPoint Presentation Portfolio Example File Cpb
This is a histogram with dollar for financial success vector icon ppt powerpoint presentation portfolio example file cpb. This is a three stage process. The stages in this process are bar chart icon, bar graph icon, data chart icon.
-
Histogram With Gear Vector Icon Ppt PowerPoint Presentation Professional Slides Cpb
This is a histogram with gear vector icon ppt powerpoint presentation professional slides cpb. This is a three stage process. The stages in this process are bar chart icon, bar graph icon, data chart icon.
-
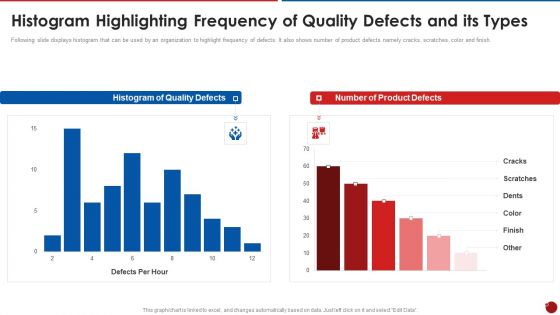
Collection Of Quality Assurance PPT Histogram Highlighting Frequency Of Quality Defects Slides PDF
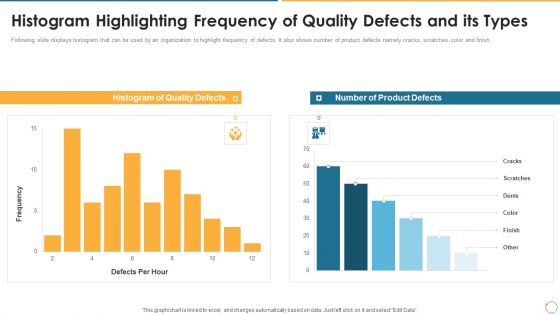
Following slide displays histogram that can be used by an organization to highlight frequency of defects. It also shows number of product defects namely cracks, scratches, color and finish. Deliver an awe inspiring pitch with this creative collection of quality assurance ppt histogram highlighting frequency of quality defects slides pdf bundle. Topics like histogram highlighting frequency of quality defects and its types can be discussed with this completely editable template. It is available for immediate download depending on the needs and requirements of the user.
-
Quality Assurance Templates Set 2 Histogram Highlighting Frequency Of Quality Defects And Its Types Professional PDF
Following slide displays histogram that can be used by an organization to highlight frequency of defects. It also shows number of product defects namely cracks, scratches, color and finish. Deliver an awe inspiring pitch with this creative quality assurance templates set 2 histogram highlighting frequency of quality defects and its types professional pdf bundle. Topics like histogram of quality defects, number of product defects can be discussed with this completely editable template. It is available for immediate download depending on the needs and requirements of the user.
-
QA Plan Set 2 Histogram Highlighting Frequency Of Quality Defects And Its Types Template PDF
Following slide displays histogram that can be used by an organization to highlight frequency of defects. It also shows number of product defects namely cracks, scratches, color and finish. Deliver an awe inspiring pitch with this creative QA Plan Set 2 Histogram Highlighting Frequency Of Quality Defects And Its Types Template PDF bundle. Topics like Histogram Quality Defects, Number Product Defects can be discussed with this completely editable template. It is available for immediate download depending on the needs and requirements of the user.
-
Quality Management Plan Templates Set 2 Histogram Highlighting Frequency Of Quality Defects And Its Types Guidelines PDF
Following slide displays histogram that can be used by an organization to highlight frequency of defects. It also shows number of product defects namely cracks, scratches, color and finish.Deliver and pitch your topic in the best possible manner with this Quality Management Plan Templates Set 2 Histogram Highlighting Frequency Of Quality Defects And Its Types Guidelines PDF Use them to share invaluable insights on Product Defects, Quality Defects, Histogram and impress your audience. This template can be altered and modified as per your expectations. So, grab it now.
-
Histogram Ideas In Powerpoint And Google Slides Cpb
Presenting our innovatively designed set of slides titled Histogram Ideas In Powerpoint And Google Slides Cpb. This completely editable PowerPoint graphic exhibits Histogram Ideas that will help you convey the message impactfully. It can be accessed with Google Slides and is available in both standard screen and widescreen aspect ratios. Apart from this, you can download this well structured PowerPoint template design in different formats like PDF, JPG, and PNG. So, click the download button now to gain full access to this PPT design.
-
Administering Quality Assurance Introduction Of Histogram With Project Use Cases PM SS V
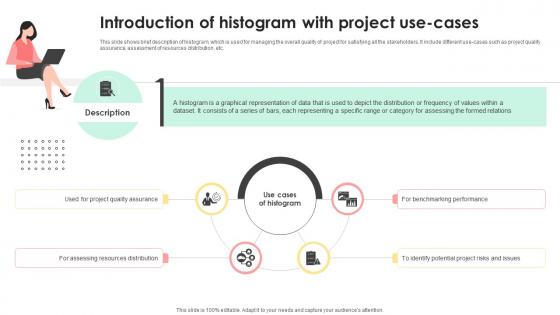
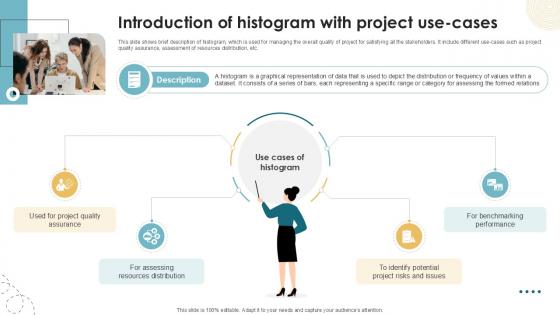
This slide shows brief description of histogram, which is used for managing the overall quality of project for satisfying all the stakeholders. It include different use-cases such as project quality assurance, assessment of resources distribution, etc. This modern and well-arranged Administering Quality Assurance Introduction Of Histogram With Project Use Cases PM SS V provides lots of creative possibilities. It is very simple to customize and edit with the Powerpoint Software. Just drag and drop your pictures into the shapes. All facets of this template can be edited with Powerpoint, no extra software is necessary. Add your own material, put your images in the places assigned for them, adjust the colors, and then you can show your slides to the world, with an animated slide included.
-
Administering Quality Assurance Sample Histogram Assessment For Project Quality Management PM SS V
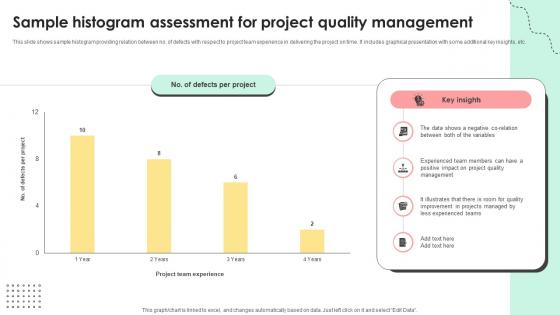
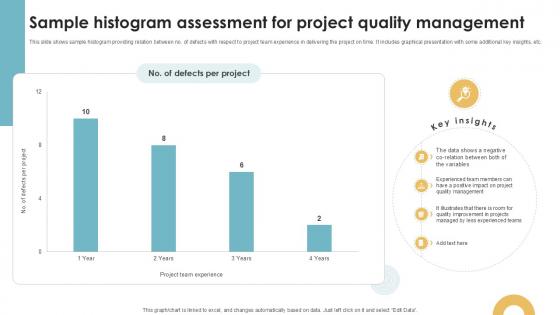
This slide shows sample histogram providing relation between no. of defects with respect to project team experience in delivering the project on time. It includes graphical presentation with some additional key insights, etc. Present like a pro with Administering Quality Assurance Sample Histogram Assessment For Project Quality Management PM SS V. Create beautiful presentations together with your team, using our easy-to-use presentation slides. Share your ideas in real-time and make changes on the fly by downloading our templates. So whether you are in the office, on the go, or in a remote location, you can stay in sync with your team and present your ideas with confidence. With Slidegeeks presentation got a whole lot easier. Grab these presentations today.
-
Introduction Of Histogram With Project Use Executing Quality Ppt Template PM SS V
This slide shows brief description of histogram, which is used for managing the overall quality of project for satisfying all the stakeholders. It include different use cases such as project quality assurance, assessment of resources distribution, etc. Explore a selection of the finest Introduction Of Histogram With Project Use Executing Quality Ppt Template PM SS V here. With a plethora of professionally designed and pre-made slide templates, you can quickly and easily find the right one for your upcoming presentation. You can use our Introduction Of Histogram With Project Use Executing Quality Ppt Template PM SS V to effectively convey your message to a wider audience. Slidegeeks has done a lot of research before preparing these presentation templates. The content can be personalized and the slides are highly editable. Grab templates today from Slidegeeks.
-
Sample Histogram Assessment For Project Executing Quality Ppt Example PM SS V
This slide shows sample histogram providing relation between no. of defects with respect to project team experience in delivering the project on time. It includes graphical presentation with some additional key insights, etc. Whether you have daily or monthly meetings, a brilliant presentation is necessary. Sample Histogram Assessment For Project Executing Quality Ppt Example PM SS V can be your best option for delivering a presentation. Represent everything in detail using Sample Histogram Assessment For Project Executing Quality Ppt Example PM SS V and make yourself stand out in meetings. The template is versatile and follows a structure that will cater to your requirements. All the templates prepared by Slidegeeks are easy to download and edit. Our research experts have taken care of the corporate themes as well. So, give it a try and see the results.


