Graphical representation PowerPoint Presentation Templates and Google Slides
-
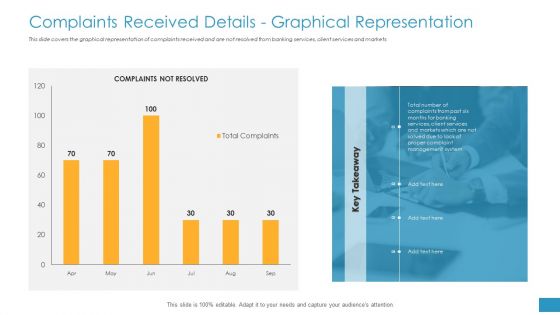
Introducing Management System Effectively Handling Customer Queries Complaints Received Details Graphical Representation Rules PDF
Deliver and pitch your topic in the best possible manner with this introducing management system effectively handling customer queries complaints received details graphical representation rules pdf. Use them to share invaluable insights on management, markets, services and impress your audience. This template can be altered and modified as per your expectations. So, grab it now.
-
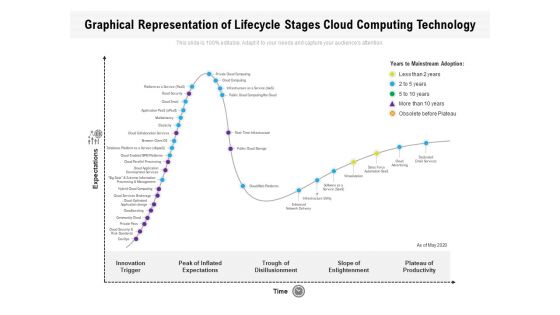
Graphical Representation Of Lifecycle Stages Cloud Computing Technology Ppt PowerPoint Presentation Gallery Skills PDF
Presenting this set of slides with name graphical representation of lifecycle stages cloud computing technology ppt powerpoint presentation gallery skills pdf. This is a five stage process. The stages in this process are infrastructure, virtualization, service. This is a completely editable PowerPoint presentation and is available for immediate download. Download now and impress your audience.
-
Graphical Representation Of Lifecycle Stages Deep And AI Ppt PowerPoint Presentation Icon Files PDF
Presenting this set of slides with name graphical representation of lifecycle stages deep and ai ppt powerpoint presentation icon files pdf. This is a four stage process. The stages in this process are management, disillusionment, enlightenment. This is a completely editable PowerPoint presentation and is available for immediate download. Download now and impress your audience.
-
Graphical Representation Of Lifecycle Stages Marketing Automation Ppt PowerPoint Presentation Gallery Shapes PDF
Presenting this set of slides with name graphical representation of lifecycle stages marketing automation ppt powerpoint presentation gallery shapes pdf. This is a two stage process. The stages in this process are marketing, innovation, analytics. This is a completely editable PowerPoint presentation and is available for immediate download. Download now and impress your audience.
-
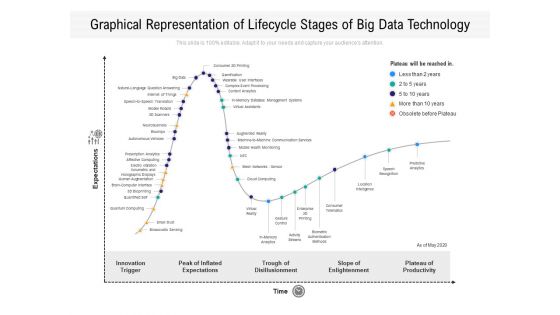
Graphical Representation Of Lifecycle Stages Of Big Data Technology Ppt PowerPoint Presentation Gallery Diagrams PDF
Presenting this set of slides with name graphical representation of lifecycle stages of big data technology ppt powerpoint presentation gallery diagrams pdf. This is a five stage process. The stages in this process are innovation, services, management. This is a completely editable PowerPoint presentation and is available for immediate download. Download now and impress your audience.
-
Graphical Representation Of Lifecycle Stages Of Digital Government Innovation Ppt PowerPoint Presentation File Professional PDF
Presenting this set of slides with name graphical representation of lifecycle stages of digital government innovation ppt powerpoint presentation file professional pdf. This is a four stage process. The stages in this process are analytics, architecture, processing. This is a completely editable PowerPoint presentation and is available for immediate download. Download now and impress your audience.
-
Graphical Representation Of Lifecycle Stages Of Emerging Technology Ppt PowerPoint Presentation File Slides PDF
Presenting this set of slides with name graphical representation of lifecycle stages of emerging technology ppt powerpoint presentation file slides pdf. This is a four stage process. The stages in this process are management, security, innovation. This is a completely editable PowerPoint presentation and is available for immediate download. Download now and impress your audience.
-
Graphical Representation Of Lifecycle Stages Of Technology Ppt PowerPoint Presentation File Guide PDF
Presenting this set of slides with name graphical representation of lifecycle stages of technology ppt powerpoint presentation file guide pdf. This is a two stage process. The stages in this process are innovation, productivity, expectations. This is a completely editable PowerPoint presentation and is available for immediate download. Download now and impress your audience.
-
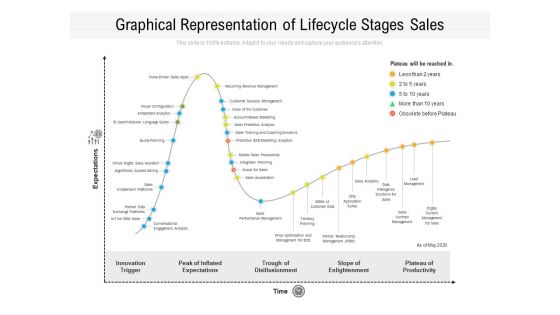
Graphical Representation Of Lifecycle Stages Sales Ppt PowerPoint Presentation Gallery Example Topics PDF
Presenting this set of slides with name graphical representation of lifecycle stages sales ppt powerpoint presentation gallery example topics pdf. This is a five stage process. The stages in this process are sales, performance, management. This is a completely editable PowerPoint presentation and is available for immediate download. Download now and impress your audience.
-
Market Sizing Market Survey Graphical Representation Ppt Infographic Template Examples PDF
Presenting this set of slides with name market sizing market survey graphical representation ppt infographic template examples pdf. The topics discussed in these slides are market survey graphical representation. This is a completely editable PowerPoint presentation and is available for immediate download. Download now and impress your audience.
-
TAM SAM And SOM Market Survey Graphical Representation Ppt Ideas Icon PDF
Deliver an awe-inspiring pitch with this creative tam sam and som market survey graphical representation ppt ideas icon pdf bundle. Topics like market survey graphical representation can be discussed with this completely editable template. It is available for immediate download depending on the needs and requirements of the user.
-
Graphical Representation Of Iteration Timeline Ppt PowerPoint Presentation File Styles PDF
Showcasing this set of slides titled graphical representation of iteration timeline ppt powerpoint presentation file styles pdf. The topics addressed in these templates are graphical representation of iteration timeline. All the content presented in this PPT design is completely editable. Download it and make adjustments in color, background, font etc. as per your unique business setting.
-
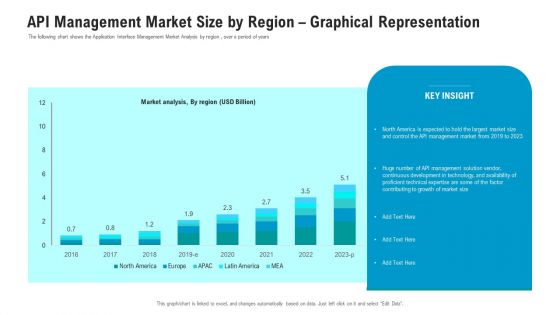
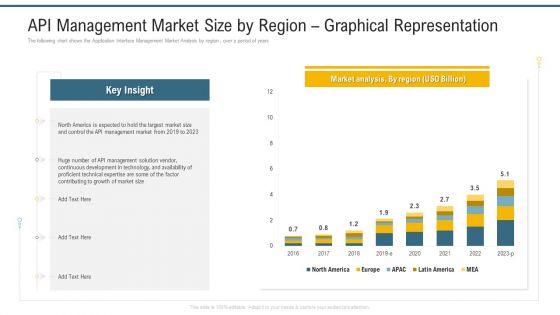
Market Viewpoint Application Programming Interface Governance API Management Market Size By Region Graphical Representation Sample PDF
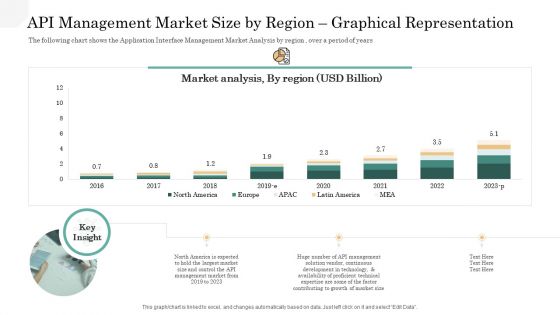
The following chart shows the Application Interface Management Market Analysis by region , over a period of years. Deliver an awe inspiring pitch with this creative market viewpoint application programming interface governance api management market size by region graphical representation sample pdf bundle. Topics like proficient, technical, continuous, development, technology can be discussed with this completely editable template. It is available for immediate download depending on the needs and requirements of the user.
-
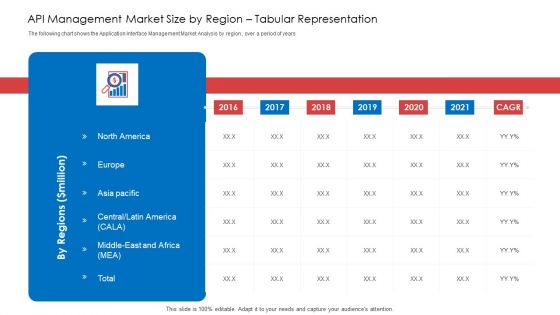
API Administration Solution API Management Market Size By Region Tabular Representation Ppt Styles Graphics PDF
The following chart shows the Application Interface Management Market Analysis by region , over a period of years. Deliver and pitch your topic in the best possible manner with this api administration solution api management market size by region tabular representation ppt styles graphics pdf. Use them to share invaluable insights on api management market size by region tabular representation and impress your audience. This template can be altered and modified as per your expectations. So, grab it now.
-
API Administration Solution API Management Market Size By Region World Map Representation Ppt Outline Graphics Download PDF
Presenting api administration solution api management market size by region world map representation ppt outline graphics download pdf to provide visual cues and insights. Share and navigate important information on five stages that need your due attention. This template can be used to pitch topics like security, growth, technical, development, technology. In addtion, this PPT design contains high resolution images, graphics, etc, that are easily editable and available for immediate download.
-
API Administration Solution API Management Market Size By Region Graphical Representation Icons PDF
The following chart shows the Application Interface Management Market Analysis by region , over a period of years. Deliver an awe inspiring pitch with this creative api administration solution api management market size by region graphical representation icons pdf bundle. Topics like proficient, technical, continuous, development, technology can be discussed with this completely editable template. It is available for immediate download depending on the needs and requirements of the user.
-
Future Work Graphical Representation Ppt Visual Aids Gallery PDF
This slide covers the graphical presentation of the quarterly future updates in Gantt chart format. Deliver and pitch your topic in the best possible manner with this future work graphical representation ppt visual aids gallery pdf. Use them to share invaluable insights on social media integration, revenue, mobile tracker app and impress your audience. This template can be altered and modified as per your expectations. So, grab it now.
-
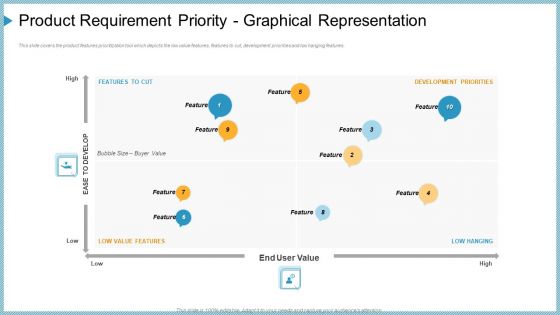
product requirement priority graphical representation ppt portfolio slides pdf
This slide covers the product features prioritization tool which depicts the low value features, features to cut, development priorities and low hanging features. This is a product requirement priority graphical representation ppt portfolio slides pdf template with various stages. Focus and dispense information on ten stages using this creative set, that comes with editable features. It contains large content boxes to add your information on topics like development priorities, ease to develop, end user value. You can also showcase facts, figures, and other relevant content using this PPT layout. Grab it now.
-
Product Demand Administration Future Work- Graphical Representation Themes PDF
This slide covers the graphical presentation of the quarterly future updates in Gantt chart format. Deliver an awe inspiring pitch with this creative product demand administration future work- graphical representation themes pdf bundle. Topics like future work graphical representation can be discussed with this completely editable template. It is available for immediate download depending on the needs and requirements of the user.
-
Product Demand Administration Product Requirement Priority Graphical Representation Information PDF
This slide covers the product features prioritization tool which depicts the low value features, features to cut, development priorities and low hanging features. This is a product demand administration product requirement priority graphical representation information pdf template with various stages. Focus and dispense information on four stages using this creative set, that comes with editable features. It contains large content boxes to add your information on topics like product requirement priority graphical representation. You can also showcase facts, figures, and other relevant content using this PPT layout. Grab it now.
-
API Ecosystem API Management Market Size By Region Graphical Representation Introduction PDF
The following chart shows the Application Interface Management Market Analysis by region , over a period of years. Deliver an awe inspiring pitch with this creative api ecosystem api management market size by region graphical representation introduction pdf bundle. Topics like management, development, technical, market can be discussed with this completely editable template. It is available for immediate download depending on the needs and requirements of the user.
-
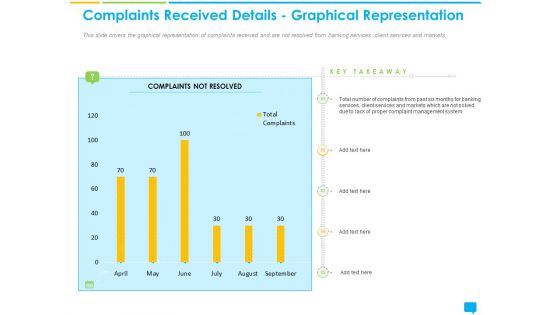
Complaints Received Details Graphical Representation Ppt Summary Mockup PDF
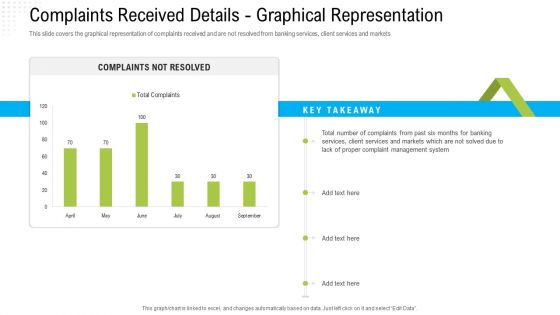
This slide covers the graphical representation of complaints received and are not resolved from banking services, client services and markets. Deliver and pitch your topic in the best possible manner with this complaints received details graphical representation ppt summary mockup pdf. Use them to share invaluable insights on management system, client services, complaints not resolved and impress your audience. This template can be altered and modified as per your expectations. So, grab it now.
-
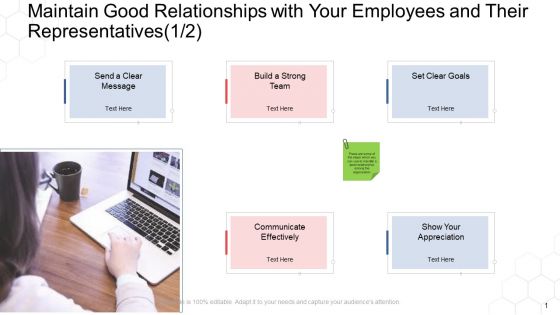
Corporate Regulation Maintain Good Relationships With Your Employees And Their Representatives Build Ppt Portfolio Graphics PDF
This is a corporate regulation maintain good relationships with your employees and their representatives build ppt portfolio graphics pdf template with various stages. Focus and dispense information on one stages using this creative set, that comes with editable features. It contains large content boxes to add your information on topics like communicate effectively, goals, appreciation, strong team. You can also showcase facts, figures, and other relevant content using this PPT layout. Grab it now.
-
API Management Market API Management Market Size By Region Graphical Representation Ideas PDF
The following chart shows the Application Interface Management Market Analysis by region , over a period of years. Deliver an awe inspiring pitch with this creative api management market api management market size by region graphical representation ideas pdf bundle. Topics like api management market size by region graphical representation can be discussed with this completely editable template. It is available for immediate download depending on the needs and requirements of the user.
-
Balance Sheet Graphical Representation Company Profile Ppt Slides Show PDF
Deliver an awe inspiring pitch with this creative balance sheet graphical representation company profile ppt slides show pdf bundle. Topics like total assets, total liabilities, current assets, current liabilities can be discussed with this completely editable template. It is available for immediate download depending on the needs and requirements of the user.
-
Income Statement Graphical Representation Company Profile Ppt Infographic Template Guidelines PDF
Deliver an awe inspiring pitch with this creative income statement graphical representation company profile ppt infographic template guidelines pdf bundle. Topics like operating profit, net profit, revenue, cogs can be discussed with this completely editable template. It is available for immediate download depending on the needs and requirements of the user.
-
Robotization In Issues Management Complaints Received Details Graphical Representation Microsoft PDF
This slide covers the graphical representation of complaints received and are not resolved from banking services, client services and markets. Deliver and pitch your topic in the best possible manner with this robotization in issues management complaints received details graphical representation microsoft pdf. Use them to share invaluable insights on services and markets, management system, complaints received details - graphical representation and impress your audience. This template can be altered and modified as per your expectations. So, grab it now.
-
Daily Reports Analysis Of Various Sales Representatives Daily Ppt Gallery Graphic Tips PDF
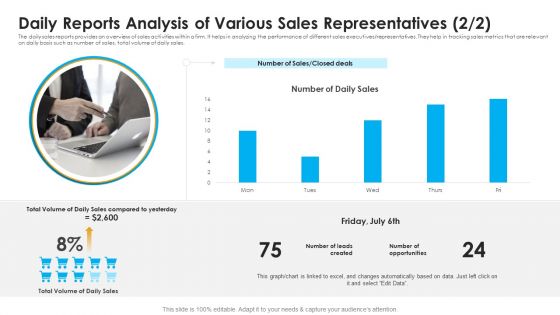
The daily sales reports provides an overview of sales activities within a firm. It helps in analyzing the performance of different sales executives representatives. They help in tracking sales metrics that are relevant on daily basis such as number of sales, total volume of daily sales. Deliver and pitch your topic in the best possible manner with this daily reports analysis of various sales representatives daily ppt gallery graphic tips pdf. Use them to share invaluable insights on opportunities, sales, analysis and impress your audience. This template can be altered and modified as per your expectations. So, grab it now.
-
API Management Market Size By Region Graphical Representation Ppt Layouts Visuals PDF
The following chart shows the Application Interface Management Market Analysis by region , over a period of years. Deliver and pitch your topic in the best possible manner with this api management market size by region graphical representation ppt layouts visuals pdf. Use them to share invaluable insights on development in technology, growth of market size, management market and impress your audience. This template can be altered and modified as per your expectations. So, grab it now.
-
Customer Complaint Handling Process Complaints Received Details Graphical Representation Slides PDF
This slide covers the graphical representation of complaints received and are not resolved from banking services, client services and markets. Deliver and pitch your topic in the best possible manner with this customer complaint handling process complaints received details graphical representation slides pdf. Use them to share invaluable insights on management, markets, services and impress your audience. This template can be altered and modified as per your expectations. So, grab it now.
-
Addressing HR Representative Training Schedule To Enhance Productivity Graphics PDF
This slide provides information regarding need of external training which will play important role in HR representative development. The external training will be given by experts of various fields. This training will not be free, and charges will cost the firm per employee. Deliver an awe-inspiring pitch with this creative addressing hr representative training schedule to enhance productivity graphics pdf. bundle. Topics like advanced software training, advanced skills training, training module can be discussed with this completely editable template. It is available for immediate download depending on the needs and requirements of the user.
-
Clients Support Representative Excellence Vector Icon Ppt PowerPoint Presentation Styles Graphics Template PDF
Showcasing this set of slides titled clients support representative excellence vector icon ppt powerpoint presentation styles graphics template pdf. The topics addressed in these templates are clients support representative excellence vector icon. All the content presented in this PPT design is completely editable. Download it and make adjustments in color, background, font etc. as per your unique business setting.
-
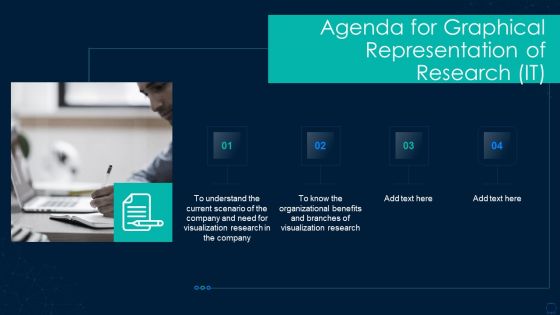
Agenda For Graphical Representation Of Research IT Download PDF
This is a agenda for graphical representation of research it download pdf template with various stages. Focus and dispense information on four stages using this creative set, that comes with editable features. It contains large content boxes to add your information on topics like agenda for graphical representation of research it. You can also showcase facts, figures, and other relevant content using this PPT layout. Grab it now.
-
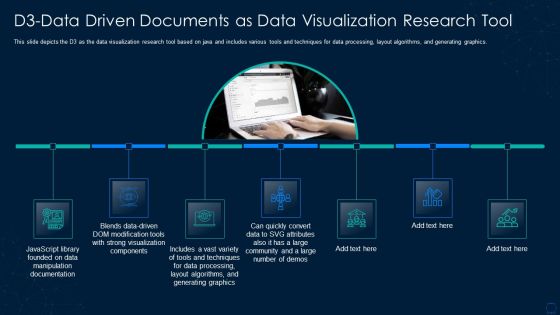
Graphical Representation Of Research IT D3 Data Driven Documents Infographics PDF
This slide depicts the D3 as the data visualization research tool based on java and includes various tools and techniques for data processing, layout algorithms, and generating graphics. Presenting graphical representation of research it d3 data driven documents infographics pdf to provide visual cues and insights. Share and navigate important information on seven stages that need your due attention. This template can be used to pitch topics like documentation, graphics, techniques, community. In addtion, this PPT design contains high resolution images, graphics, etc, that are easily editable and available for immediate download.
-
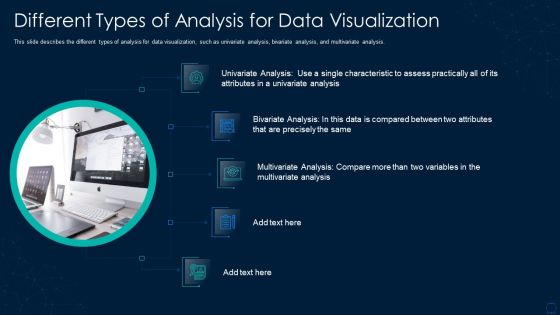
Graphical Representation Of Research IT Different Types Of Analysis For Data Visualization Structure PDF
This slide describes the different types of analysis for data visualization, such as univariate analysis, bivariate analysis, and multivariate analysis. This is a graphical representation of research it different types of analysis for data visualization structure pdf template with various stages. Focus and dispense information on five stages using this creative set, that comes with editable features. It contains large content boxes to add your information on topics like different types of analysis for data visualization. You can also showcase facts, figures, and other relevant content using this PPT layout. Grab it now.
-
Graphical Representation Of Research IT Finereport As Visualization Research Tool Structure PDF
This slide describes the fine report as the visualization research tool that can connect to various databases directly, making it easier to design. Presenting graphical representation of research it finereport as visualization research tool structure pdf to provide visual cues and insights. Share and navigate important information on eight stages that need your due attention. This template can be used to pitch topics like application, dashboards, databases. In addtion, this PPT design contains high resolution images, graphics, etc, that are easily editable and available for immediate download.
-
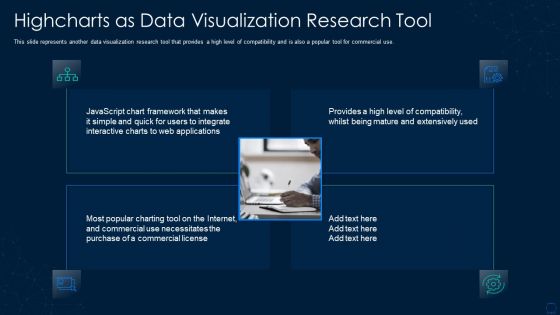
Graphical Representation Of Research IT Highcharts As Data Visualization Research Demonstration PDF
This slide represents another data visualization research tool that provides a high level of compatibility and is also a popular tool for commercial use. This is a graphical representation of research it highcharts as data visualization research demonstration pdf template with various stages. Focus and dispense information on four stages using this creative set, that comes with editable features. It contains large content boxes to add your information on topics like highcharts as data visualization research tool. You can also showcase facts, figures, and other relevant content using this PPT layout. Grab it now.
-
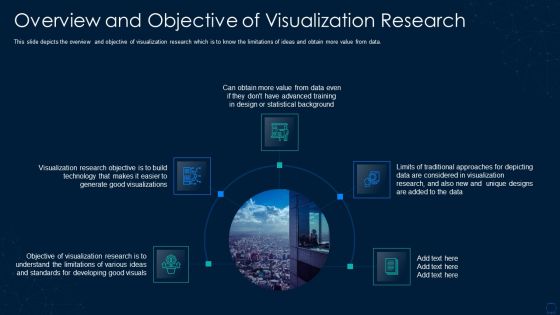
Graphical Representation Of Research IT Overview And Objective Slides PDF
Presenting graphical representation of research it overview and objective slides pdf to provide visual cues and insights. Share and navigate important information on five stages that need your due attention. This template can be used to pitch topics like technology, developing, design. In addtion, this PPT design contains high resolution images, graphics, etc, that are easily editable and available for immediate download.
-
Graphical Representation Of Research IT Why Do We Need Visualization Research Graphics PDF
This is a graphical representation of research it why do we need visualization research graphics pdf template with various stages. Focus and dispense information on five stages using this creative set, that comes with editable features. It contains large content boxes to add your information on topics like why do we need visualization research. You can also showcase facts, figures, and other relevant content using this PPT layout. Grab it now.
-
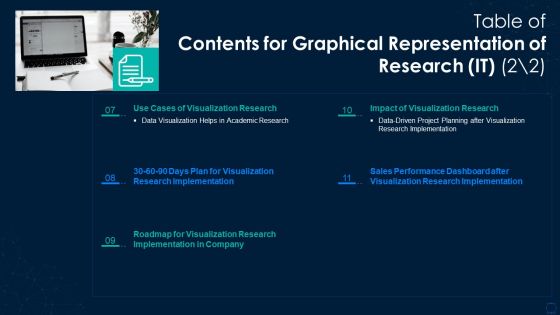
Table Of Contents For Graphical Representation Of Research IT Data Elements PDF
Presenting table of contents for graphical representation of research it data elements pdf to provide visual cues and insights. Share and navigate important information on five stages that need your due attention. This template can be used to pitch topics like implementation, plan, sales performance. In addtion, this PPT design contains high resolution images, graphics, etc, that are easily editable and available for immediate download.
-
Table Of Contents For Graphical Representation Of Research IT Template PDF
This is a table of contents for graphical representation of research it template pdf template with various stages. Focus and dispense information on six stages using this creative set, that comes with editable features. It contains large content boxes to add your information on topics like analysis, documents, data. You can also showcase facts, figures, and other relevant content using this PPT layout. Grab it now.
-
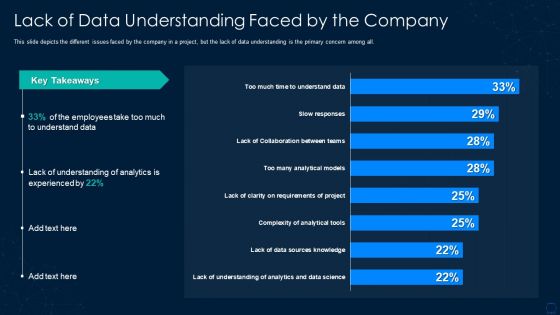
Graphical Representation Of Research IT Lack Of Data Understanding Slides PDF
This slide depicts the different issues faced by the company in a project, but the lack of data understanding is the primary concern among all. Deliver an awe inspiring pitch with this creative graphical representation of research it lack of data understanding slides pdf bundle. Topics like lack of data understanding faced by the company can be discussed with this completely editable template. It is available for immediate download depending on the needs and requirements of the user.
-
Graphical Representation Of Research IT Sales Performance Dashboard Sample PDF
This slide depicts the dashboard for sales performance after the implementation of visualization research based on revenue, quantity, regional sales. Deliver and pitch your topic in the best possible manner with this graphical representation of research it sales performance dashboard sample pdf. Use them to share invaluable insights on sales performance dashboard after visualization research implementation and impress your audience. This template can be altered and modified as per your expectations. So, grab it now.
-
Graphical Representation Of Research IT 30 60 90 Days Plan For Visualization Diagrams PDF
This slide shows the 30 60 90 days plan for visualization research, such as knowing and sorting the data, analyzing the information, and different tools required. This is a graphical representation of research it 30 60 90 days plan for visualization diagrams pdf template with various stages. Focus and dispense information on three stages using this creative set, that comes with editable features. It contains large content boxes to add your information on topics like information, required, analyzing. You can also showcase facts, figures, and other relevant content using this PPT layout. Grab it now.
-
Graphical Representation Of Research IT Bivariate Analysis Techniques Formats PDF
This slide describes the second analysis technique, bivariate analysis for data visualization, which includes three plots line, bar, and scatter. Deliver and pitch your topic in the best possible manner with this graphical representation of research it bivariate analysis techniques formats pdf. Use them to share invaluable insights on bivariate analysis techniques for data visualization and impress your audience. This template can be altered and modified as per your expectations. So, grab it now.
-
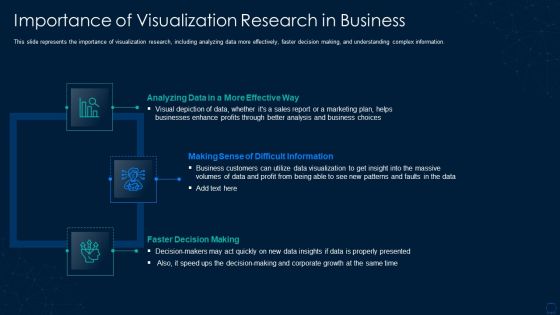
Graphical Representation Of Research IT Importance Of Visualization Research In Business Summary PDF
This slide represents the importance of visualization research, including analyzing data more effectively, faster decision making, and understanding complex information. This is a graphical representation of research it importance of visualization research in business summary pdf template with various stages. Focus and dispense information on three stages using this creative set, that comes with editable features. It contains large content boxes to add your information on topics like business customers, marketing plan, growth, data. You can also showcase facts, figures, and other relevant content using this PPT layout. Grab it now.
-
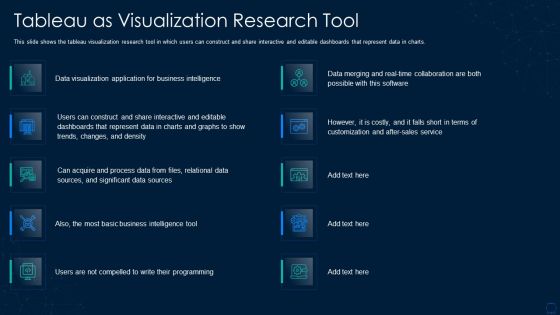
Graphical Representation Of Research IT Tableau As Visualization Research Tool Graphics PDF
This slide shows the tableau visualization research tool in which users can construct and share interactive and editable dashboards that represent data in charts. Deliver and pitch your topic in the best possible manner with this graphical representation of research it tableau as visualization research tool graphics pdf. Use them to share invaluable insights on process data, sources, sales, application and impress your audience. This template can be altered and modified as per your expectations. So, grab it now.
-
Icons Slide For Graphical Representation Of Research IT Information PDF
Presenting our innovatively structured icons slide for graphical representation of research it information pdf set of slides. The slides contain a hundred percent editable icons. You can replace these icons without any inconvenience. Therefore, pick this set of slides and create a striking presentation.
-
Graphical Representation Of Research IT Data Driven Project Planning Structure PDF
This slide depicts the impact of visualization research implementation, which results in data driven project planning, due to which there is a 23 times increase in happy customers. This is a graphical representation of research it data driven project planning structure pdf template with various stages. Focus and dispense information on three stages using this creative set, that comes with editable features. It contains large content boxes to add your information on topics like profit, customers, strategy. You can also showcase facts, figures, and other relevant content using this PPT layout. Grab it now.
-
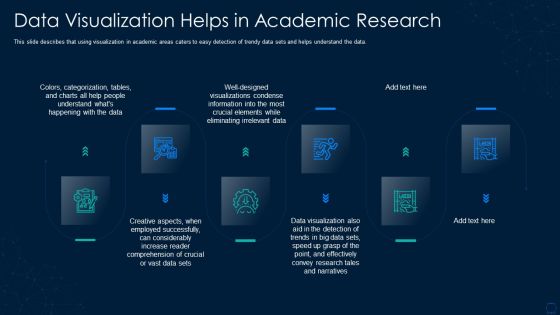
Graphical Representation Of Research IT Data Visualization Helps In Academic Research Microsoft PDF
This slide describes that using visualization in academic areas caters to easy detection of trendy data sets and helps understand the data. Presenting graphical representation of research it data visualization helps in academic research microsoft pdf to provide visual cues and insights. Share and navigate important information on six stages that need your due attention. This template can be used to pitch topics like data visualization helps in academic research. In addtion, this PPT design contains high resolution images, graphics, etc, that are easily editable and available for immediate download.
-
Graphical Representation Of Research IT Google Charts Tool For Data Visualization Introduction PDF
This slide depicts google charts as the tool for data visualization, which can extract data from various sources, including SQL, databases, google sheets. This is a graphical representation of research it google charts tool for data visualization introduction pdf template with various stages. Focus and dispense information on five stages using this creative set, that comes with editable features. It contains large content boxes to add your information on topics like dynamic, databases, sources, technology. You can also showcase facts, figures, and other relevant content using this PPT layout. Grab it now.
-
Graphical Representation Of Research IT Information Visualization Research Branch Icons PDF
This slide explains information visualization as a branch of visualization research that includes visuals like histograms, trend graphs, flow charts. Presenting graphical representation of research it information visualization research branch icons pdf to provide visual cues and insights. Share and navigate important information on four stages that need your due attention. This template can be used to pitch topics like geographic, information, design. In addtion, this PPT design contains high resolution images, graphics, etc, that are easily editable and available for immediate download.
-
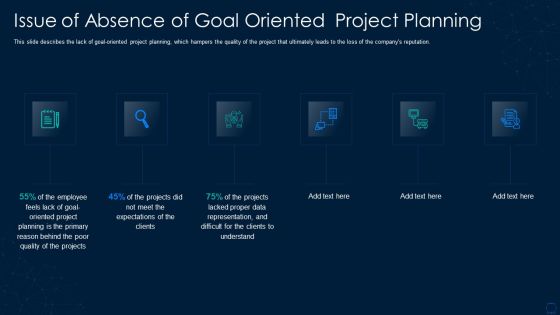
Graphical Representation Of Research IT Issue Of Absence Of Goal Designs PDF
This is a graphical representation of research it issue of absence of goal designs pdf template with various stages. Focus and dispense information on six stages using this creative set, that comes with editable features. It contains large content boxes to add your information on topics like planning, projects, quality. You can also showcase facts, figures, and other relevant content using this PPT layout. Grab it now.
-
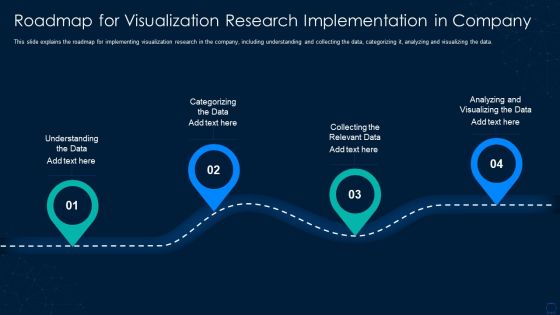
Graphical Representation Of Research IT Roadmap For Visualization Research Summary PDF
This slide explains the roadmap for implementing visualization research in the company, including understanding and collecting the data, categorizing it, analyzing and visualizing the data. Presenting graphical representation of research it roadmap for visualization research summary pdf to provide visual cues and insights. Share and navigate important information on four stages that need your due attention. This template can be used to pitch topics like roadmap for visualization research implementation in company. In addtion, this PPT design contains high resolution images, graphics, etc, that are easily editable and available for immediate download.
-
Graphical Representation Of Research IT Scientific Visualization Branch Information PDF
This slide explains scientific visualization, the first branch of visualization research which focuses on 3D phenomena and visually represents scientific data. This is a graphical representation of research it scientific visualization branch information pdf template with various stages. Focus and dispense information on four stages using this creative set, that comes with editable features. It contains large content boxes to add your information on topics like scientific visualization branch of visualization research. You can also showcase facts, figures, and other relevant content using this PPT layout. Grab it now.
-
Graphical Representation Of Research IT Univariate Analysis Techniques Icons PDF
This slide depicts the univariate analysis technique for data visualization, including distribution, box and whisker, and the violin plot. Presenting graphical representation of research it univariate analysis techniques icons pdf to provide visual cues and insights. Share and navigate important information on three stages that need your due attention. This template can be used to pitch topics like information, supplies, information, target. In addtion, this PPT design contains high resolution images, graphics, etc, that are easily editable and available for immediate download.
-
Graphical Representation Of Research IT Visual Analytics Branch Background PDF
This slide shows visual analytics, the last branch of visualization research, which emerged from the advancements in the other two branches and mainly focused on analytical reasoning. This is a graphical representation of research it visual analytics branch background pdf template with various stages. Focus and dispense information on five stages using this creative set, that comes with editable features. It contains large content boxes to add your information on topics like visual analytics branch of visualization research. You can also showcase facts, figures, and other relevant content using this PPT layout. Grab it now.
-
Graphical Representation Of Various Employee Engagement Statistics Microsoft PDF
Showcasing this set of slides titled graphical representation of various employee engagement statistics microsoft pdf. The topics addressed in these templates are graphical representation of various employee engagement statistics. All the content presented in this PPT design is completely editable. Download it and make adjustments in color, background, font etc. as per your unique business setting.
-
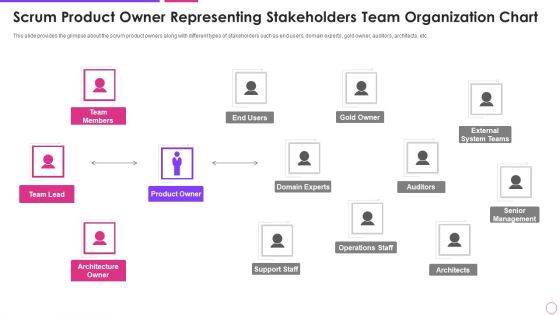
Scrum Product Owner Representing Agile Project Management Framework Graphics PDF
This slide provides the glimpse about the scrum product owners along with different types of stakeholders such as end users, domain experts, gold owner, auditors, architects, etc. Deliver an awe inspiring pitch with this creative scrum product owner representing agile project management framework graphics pdf bundle. Topics like product owner, system teams, senior management, architecture owner can be discussed with this completely editable template. It is available for immediate download depending on the needs and requirements of the user.
-
Graphical Representation Of Data Using Statistical Data Measures Elements PDF
Persuade your audience using this graphical representation of data using statistical data measures elements pdf. This PPT design covers four stages, thus making it a great tool to use. It also caters to a variety of topics including graphical representation of data using statistical data measures. Download this PPT design now to present a convincing pitch that not only emphasizes the topic but also showcases your presentation skills.
-
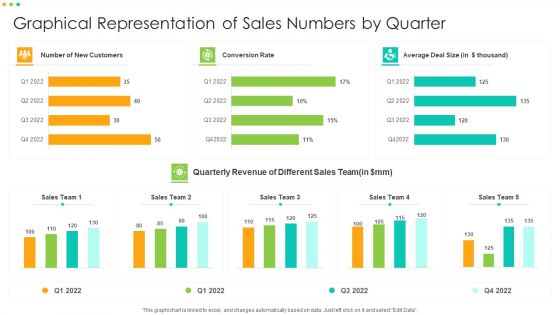
Graphical Representation Of Sales Numbers By Quarter Template PDF
Showcasing this set of slides titled Graphical Representation Of Sales Numbers By Quarter Template PDF. The topics addressed in these templates are Graphical Representation Of Sales Numbers By Quarter. All the content presented in this PPT design is completely editable. Download it and make adjustments in color, background, font etc. as per your unique business setting.
-
Graphical Representation Of International Macroeconomic Analysis Labour Market Diagrams PDF
This slide shows the graphical representation of international labour market in terms of high, middle and low-skilled workers which affects the production capacity of different industries that adversely affects the national income of the economy. Pitch your topic with ease and precision using this Graphical Representation Of International Macroeconomic Analysis Labour Market Diagrams PDF. This layout presents information on High Skilled, Middle Skilled, Low Skilled. It is also available for immediate download and adjustment. So, changes can be made in the color, design, graphics or any other component to create a unique layout.
-
Graphical Representation Of Macroeconomic Analysis Unemployment Rate Slides PDF
This slide shows the graphical presentation of unemployment rate in macroeconomic which includes percentage of increasing and decreasing rate of unemployment in united states in different years. Showcasing this set of slides titled Graphical Representation Of Macroeconomic Analysis Unemployment Rate Slides PDF. The topics addressed in these templates are US Unemployment Rate, Consumer. All the content presented in this PPT design is completely editable. Download it and make adjustments in color, background, font etc. as per your unique business setting.
-
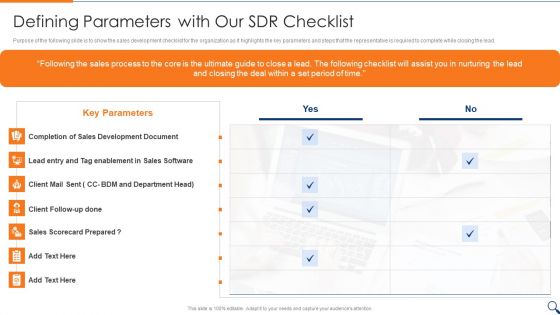
Sales Representative Onboarding Playbook Defining Parameters With Our Sdr Checklist Graphics PDF
Presenting Sales Representative Onboarding Playbook Defining Parameters With Our Sdr Checklist Graphics PDF to provide visual cues and insights. Share and navigate important information on one stages that need your due attention. This template can be used to pitch topics like Defining Parameters With Our SDR Checklist. In addtion, this PPT design contains high resolution images, graphics, etc, that are easily editable and available for immediate download.
-
Graphical Representation Of Firm Business Sales Highlights Pictures PDF
Showcasing this set of slides titled Graphical Representation Of Firm Business Sales Highlights Pictures PDF. The topics addressed in these templates are Average Revenue Per Unit, Customer Acquisition Cost, Sale Revenue. All the content presented in this PPT design is completely editable. Download it and make adjustments in color, background, font etc. as per your unique business setting.
-
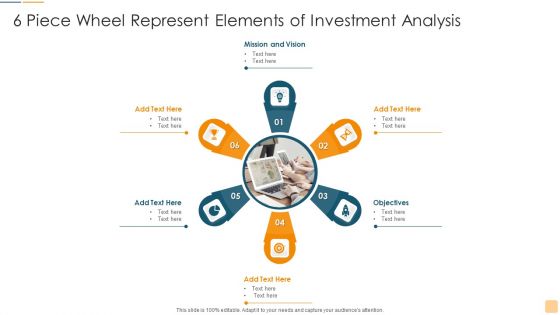
6 Piece Wheel Represent Elements Of Investment Analysis Ppt Ideas Graphics PDF
Presenting 6 Piece Wheel Represent Elements Of Investment Analysis Ppt Ideas Graphics PDF to dispense important information. This template comprises six stages. It also presents valuable insights into the topics including Mission And Vision, Objectives, Investment Analysis. This is a completely customizable PowerPoint theme that can be put to use immediately. So, download it and address the topic impactfully.
-
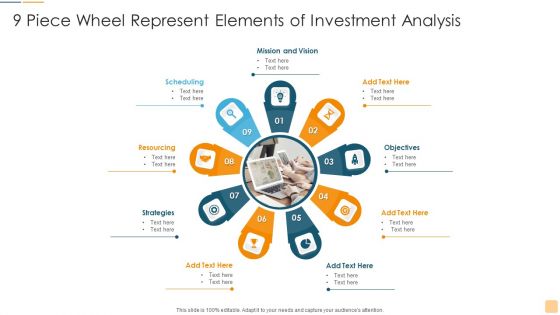
9 Piece Wheel Represent Elements Of Investment Analysis Ppt File Graphics Download PDF
Presenting 9 Piece Wheel Represent Elements Of Investment Analysis Ppt File Graphics Download PDF to dispense important information. This template comprises nine stages. It also presents valuable insights into the topics including Mission And Vision, Objectives, Investment Analysis. This is a completely customizable PowerPoint theme that can be put to use immediately. So, download it and address the topic impactfully.
-
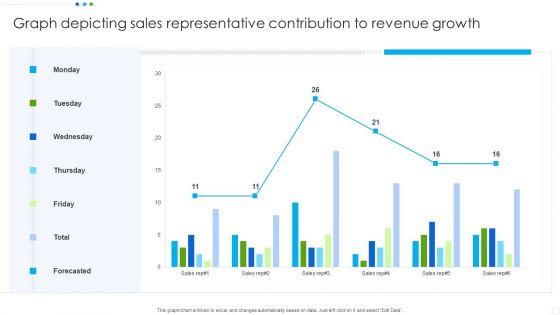
Graph Depicting Sales Representative Contribution To Revenue Growth Graphics PDF
Showcasing this set of slides titled Graph Depicting Sales Representative Contribution To Revenue Growth Graphics PDF. The topics addressed in these templates are Graph Depicting Sales, Revenue Growth. All the content presented in this PPT design is completely editable. Download it and make adjustments in color, background, font etc. as per your unique business setting.
-
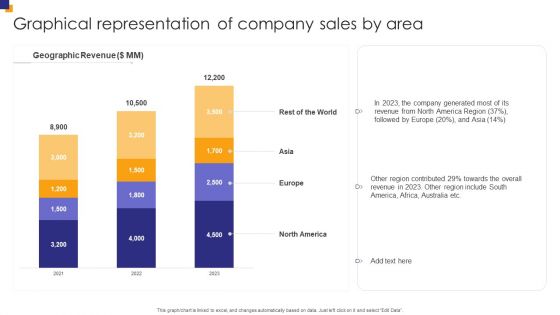
Graphical Representation Of Company Sales By Area Elements PDF
Showcasing this set of slides titled Graphical Representation Of Company Sales By Area Elements PDF. The topics addressed in these templates are Region Contributed, America Region, Include South. All the content presented in this PPT design is completely editable. Download it and make adjustments in color, background, font etc. as per your unique business setting.
-
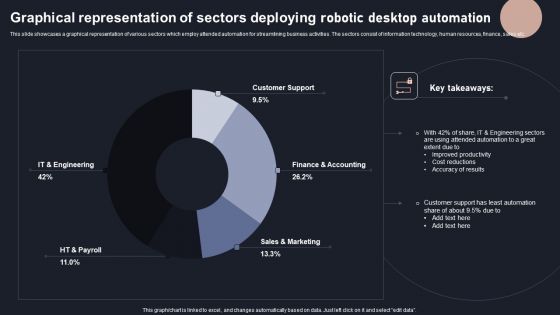
Graphical Representation Of Sectors Deploying Robotic Desktop Automation Formats PDF
This slide showcases a graphical representation of various sectors which employ attended automation for streamlining business activities. The sectors consist of information technology, human resources, finance, sales etc. Pitch your topic with ease and precision using this Graphical Representation Of Sectors Deploying Robotic Desktop Automation Formats PDF. This layout presents information on Productivity, Cost Reductions, Finance. It is also available for immediate download and adjustment. So, changes can be made in the color, design, graphics or any other component to create a unique layout.
-
Strategic Plan For Enterprise Sprint Burndown Chart Representing Team Velocity Graphics PDF
This slide represents the chart to help management to track total work remaining in the software implementation and the likelihood of achieving software implementation goal. It represents significance of sprint burndown chart. Want to ace your presentation in front of a live audience Our Strategic Plan For Enterprise Sprint Burndown Chart Representing Team Velocity Graphics PDF can help you do that by engaging all the users towards you.. Slidegeeks experts have put their efforts and expertise into creating these impeccable powerpoint presentations so that you can communicate your ideas clearly. Moreover, all the templates are customizable, and easy-to-edit and downloadable. Use these for both personal and commercial use.
-
Customer Representative Capability Evaluation Checklist Ppt PowerPoint Presentation Inspiration Graphics Example PDF
The following slide showcase a checklist for capability evaluation of customer executive. The checklist covers various points such as customer experience, phone contact handling skills, product knowledge, quality focus etc.Pitch your topic with ease and precision using this Customer Representative Capability Evaluation Checklist Ppt PowerPoint Presentation Inspiration Graphics Example PDF. This layout presents information on Customer Experience, Contact Handling, Excellent Communication. It is also available for immediate download and adjustment. So, changes can be made in the color, design, graphics or any other component to create a unique layout.
-
Graphical Representation Of Corporate Financial Challenges Icon Ppt Model Demonstration PDF
Presenting Graphical Representation Of Corporate Financial Challenges Icon Ppt Model Demonstration PDF to dispense important information. This template comprises four stages. It also presents valuable insights into the topics including Graphical Representation, Corporate Financial, Challenges Icon. This is a completely customizable PowerPoint theme that can be put to use immediately. So, download it and address the topic impactfully.
-
Strategy Playbook For Pharmaceutical Sales Representative Customer Journey A Part Of Our Process Graphics PDF
Purpose of the following slide is to display the customer journey customer goes through. It highlights the key stages such as awareness, consideration, decision, service and advocacy etc. Deliver an awe inspiring pitch with this creative Strategy Playbook For Pharmaceutical Sales Representative Customer Journey A Part Of Our Process Graphics PDF bundle. Topics like Awareness, Service, Technical Support can be discussed with this completely editable template. It is available for immediate download depending on the needs and requirements of the user.
-
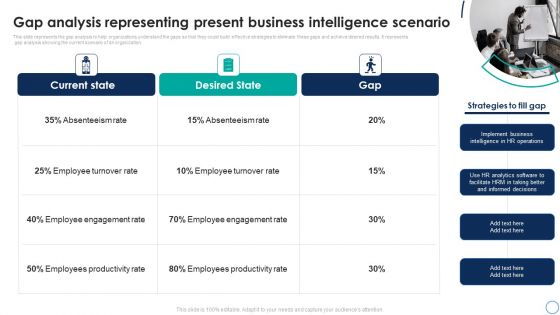
Business Analytics Application Gap Analysis Representing Present Business Graphics PDF
This slide represents the gap analysis to help organizations understand the gaps so that they could build effective strategies to eliminate these gaps and achieve desired results. It represents gap analysis showing the current scenario of an organization. This modern and well-arranged Business Analytics Application Gap Analysis Representing Present Business Graphics PDF provides lots of creative possibilities. It is very simple to customize and edit with the Powerpoint Software. Just drag and drop your pictures into the shapes. All facets of this template can be edited with Powerpoint, no extra software is necessary. Add your own material, put your images in the places assigned for them, adjust the colors, and then you can show your slides to the world, with an animated slide included.
-
Brand Equity Development On Customer Model Icon Representing High Profits Graphics PDF
Pitch your topic with ease and precision using this Brand Equity Development On Customer Model Icon Representing High Profits Graphics PDF. This layout presents information on Brand Equity Development, Customer Model, Icon Representing, High Profits. It is also available for immediate download and adjustment. So, changes can be made in the color, design, graphics or any other component to create a unique layout.
-
Map Representing Regional Corporate Sales In US Graphics PDF
Persuade your audience using this Map Representing Regional Corporate Sales In US Graphics PDF. This PPT design covers One stage, thus making it a great tool to use. It also caters to a variety of topics including Map Representing, Regional Corporate, Sales In US. Download this PPT design now to present a convincing pitch that not only emphasizes the topic but also showcases your presentation skills.
-
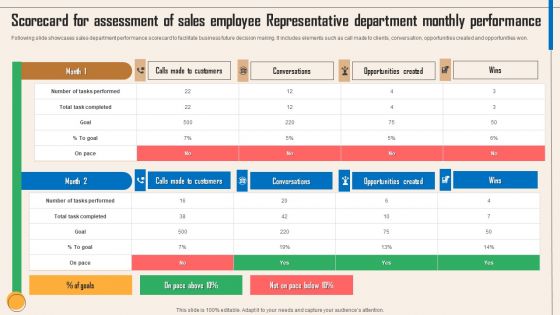
Scorecard For Assessment Of Sales Employee Representative Department Monthly Performance Graphics PDF
Following slide showcases sales department performance scorecard to facilitate business future decision making. It includes elements such as call made to clients, conversation, opportunities created and opportunities won. Showcasing this set of slides titled Scorecard For Assessment Of Sales Employee Representative Department Monthly Performance Graphics PDF. The topics addressed in these templates are Conversations, Opportunities Created, Wins, Calls Made To Customers. All the content presented in this PPT design is completely editable. Download it and make adjustments in color, background, font etc. as per your unique business setting.
-
Product Requirement Priority Graphical Representation Template PDF
This slide covers the product features prioritization tool which depicts the low value features, features to cut, development priorities and low hanging features. Get a simple yet stunning designed Product Requirement Priority Graphical Representation Template PDF. It is the best one to establish the tone in your meetings. It is an excellent way to make your presentations highly effective. So, download this PPT today from Slidegeeks and see the positive impacts. Our easy to edit Product Requirement Priority Graphical Representation Template PDF can be your go to option for all upcoming conferences and meetings. So, what are you waiting for Grab this template today.
-
House Of Brands Strategy For Better Market Representation Graphics PDF
This slide introduces the house of brand strategy for owning several brands in the same category. It includes critical benefits such as diversifying the business portfolio, increasing the reach, and being relatively expensive. From laying roadmaps to briefing everything in detail, our templates are perfect for you. You can set the stage with your presentation slides. All you have to do is download these easy to edit and customizable templates. House Of Brands Strategy For Better Market Representation Graphics PDF will help you deliver an outstanding performance that everyone would remember and praise you for. Do download this presentation today.
-
Closing Techniques Currently Used By Sales Representatives Ppt Icon Graphics Pictures PDF
The slide presents various techniques business is using for sales closure and acquiring the prospect. It includes methods such as now or never closes, summary closes and sharp angle closes. Formulating a presentation can take up a lot of effort and time, so the content and message should always be the primary focus. The visuals of the PowerPoint can enhance the presenters message, so our Closing Techniques Currently Used By Sales Representatives Ppt Icon Graphics Pictures PDF was created to help save time. Instead of worrying about the design, the presenter can concentrate on the message while our designers work on creating the ideal templates for whatever situation is needed. Slidegeeks has experts for everything from amazing designs to valuable content, we have put everything into Closing Techniques Currently Used By Sales Representatives Ppt Icon Graphics Pictures PDF.
-
Online Application Development Product Requirement Priority Graphical Representation Topics PDF
This slide covers the product features prioritization tool which depicts the low value features, features to cut, development priorities and low hanging features. This Online Application Development Product Requirement Priority Graphical Representation Topics PDF is perfect for any presentation, be it in front of clients or colleagues. It is a versatile and stylish solution for organizing your meetings. The Online Application Development Product Requirement Priority Graphical Representation Topics PDF features a modern design for your presentation meetings. The adjustable and customizable slides provide unlimited possibilities for acing up your presentation. Slidegeeks has done all the homework before launching the product for you. So, do not wait, grab the presentation templates today
-
Graphical Representation On Business Challenges Faced In B2b Company Slides Pdf
This slide showcases graphical portrayal of the challenges that a business-to-business corporation faces. It includes low response rate, lack of resources, paid acquisition, low deal close rate, etc. Showcasing this set of slides titled Graphical Representation On Business Challenges Faced In B2b Company Slides Pdf The topics addressed in these templates are Graphical Representation On Business, Challenges Faced In B2B Company All the content presented in this PPT design is completely editable. Download it and make adjustments in color, background, font etc. as per your unique business setting.
-
Timeline Representing Growth Of Microsoft Strategic Advancements By Microsofts Graphics Pdf
This slide shows a timeline which can be used to understand the progress and growth of Microsoft. It includes various milestones related to geographic expansion, new product launches, acquisition etc. Are you in need of a template that can accommodate all of your creative concepts This one is crafted professionally and can be altered to fit any style. Use it with Google Slides or PowerPoint. Include striking photographs, symbols, depictions, and other visuals. Fill, move around, or remove text boxes as desired. Test out color palettes and font mixtures. Edit and save your work, or work with colleagues. Download Timeline Representing Growth Of Microsoft Strategic Advancements By Microsofts Graphics Pdf and observe how to make your presentation outstanding. Give an impeccable presentation to your group and make your presentation unforgettable.


