Graphical representation of research it PowerPoint Presentation Templates and Google Slides
-
Graphical Representation Of Research IT Ppt PowerPoint Presentation Complete With Slides
Pitch yourself both in house and outside by utilizing this complete deck. This graphical representation of research it ppt powerpoint presentation complete with slides focuses on key fundamentals of the topic, displayed using different slides. With a total of forty eight slides, this template is the best tool you can use to persuade your audience. It will not only help you create great presentations but also induce strategic thinking because of its well researched content and graphics. You can easily personalize any of the elements to suit your unique business setting. Additionally, it can be saved in PNG, JPG, and PDF formats to save your time and resources.
-
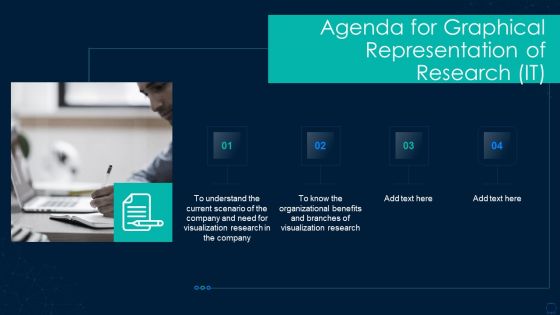
Agenda For Graphical Representation Of Research IT Download PDF
This is a agenda for graphical representation of research it download pdf template with various stages. Focus and dispense information on four stages using this creative set, that comes with editable features. It contains large content boxes to add your information on topics like agenda for graphical representation of research it. You can also showcase facts, figures, and other relevant content using this PPT layout. Grab it now.
-
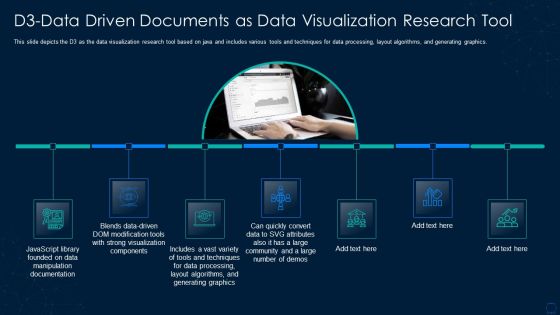
Graphical Representation Of Research IT D3 Data Driven Documents Infographics PDF
This slide depicts the D3 as the data visualization research tool based on java and includes various tools and techniques for data processing, layout algorithms, and generating graphics. Presenting graphical representation of research it d3 data driven documents infographics pdf to provide visual cues and insights. Share and navigate important information on seven stages that need your due attention. This template can be used to pitch topics like documentation, graphics, techniques, community. In addtion, this PPT design contains high resolution images, graphics, etc, that are easily editable and available for immediate download.
-
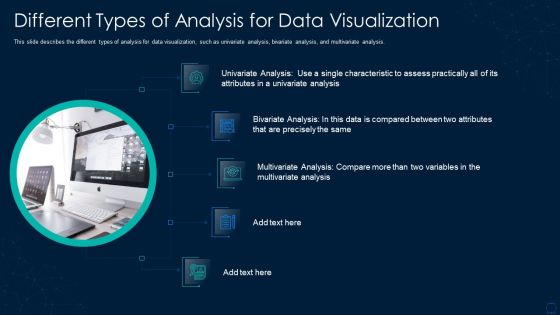
Graphical Representation Of Research IT Different Types Of Analysis For Data Visualization Structure PDF
This slide describes the different types of analysis for data visualization, such as univariate analysis, bivariate analysis, and multivariate analysis. This is a graphical representation of research it different types of analysis for data visualization structure pdf template with various stages. Focus and dispense information on five stages using this creative set, that comes with editable features. It contains large content boxes to add your information on topics like different types of analysis for data visualization. You can also showcase facts, figures, and other relevant content using this PPT layout. Grab it now.
-
Graphical Representation Of Research IT Finereport As Visualization Research Tool Structure PDF
This slide describes the fine report as the visualization research tool that can connect to various databases directly, making it easier to design. Presenting graphical representation of research it finereport as visualization research tool structure pdf to provide visual cues and insights. Share and navigate important information on eight stages that need your due attention. This template can be used to pitch topics like application, dashboards, databases. In addtion, this PPT design contains high resolution images, graphics, etc, that are easily editable and available for immediate download.
-
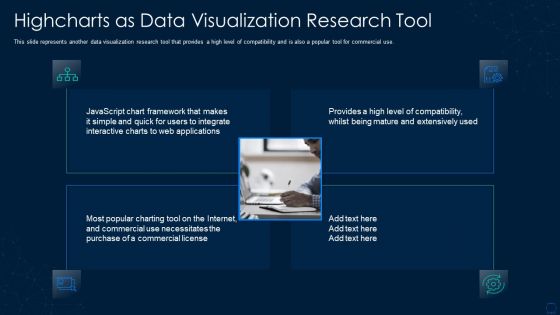
Graphical Representation Of Research IT Highcharts As Data Visualization Research Demonstration PDF
This slide represents another data visualization research tool that provides a high level of compatibility and is also a popular tool for commercial use. This is a graphical representation of research it highcharts as data visualization research demonstration pdf template with various stages. Focus and dispense information on four stages using this creative set, that comes with editable features. It contains large content boxes to add your information on topics like highcharts as data visualization research tool. You can also showcase facts, figures, and other relevant content using this PPT layout. Grab it now.
-
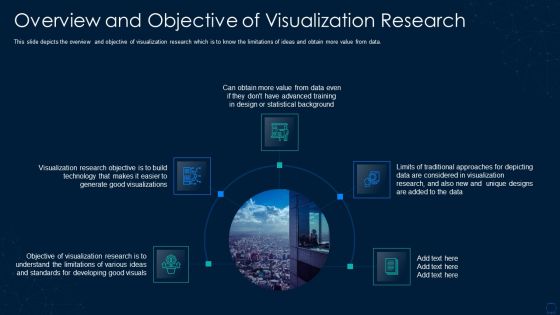
Graphical Representation Of Research IT Overview And Objective Slides PDF
Presenting graphical representation of research it overview and objective slides pdf to provide visual cues and insights. Share and navigate important information on five stages that need your due attention. This template can be used to pitch topics like technology, developing, design. In addtion, this PPT design contains high resolution images, graphics, etc, that are easily editable and available for immediate download.
-
Graphical Representation Of Research IT Why Do We Need Visualization Research Graphics PDF
This is a graphical representation of research it why do we need visualization research graphics pdf template with various stages. Focus and dispense information on five stages using this creative set, that comes with editable features. It contains large content boxes to add your information on topics like why do we need visualization research. You can also showcase facts, figures, and other relevant content using this PPT layout. Grab it now.
-
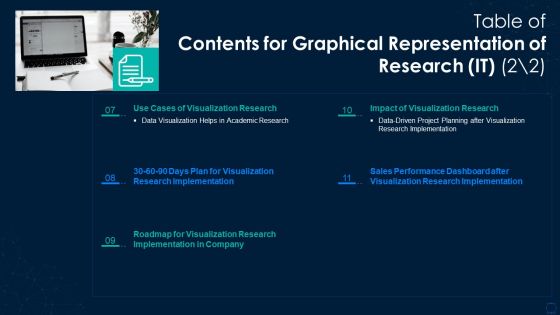
Table Of Contents For Graphical Representation Of Research IT Data Elements PDF
Presenting table of contents for graphical representation of research it data elements pdf to provide visual cues and insights. Share and navigate important information on five stages that need your due attention. This template can be used to pitch topics like implementation, plan, sales performance. In addtion, this PPT design contains high resolution images, graphics, etc, that are easily editable and available for immediate download.
-
Table Of Contents For Graphical Representation Of Research IT Template PDF
This is a table of contents for graphical representation of research it template pdf template with various stages. Focus and dispense information on six stages using this creative set, that comes with editable features. It contains large content boxes to add your information on topics like analysis, documents, data. You can also showcase facts, figures, and other relevant content using this PPT layout. Grab it now.
-
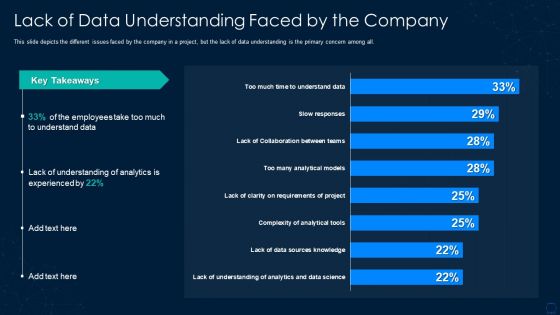
Graphical Representation Of Research IT Lack Of Data Understanding Slides PDF
This slide depicts the different issues faced by the company in a project, but the lack of data understanding is the primary concern among all. Deliver an awe inspiring pitch with this creative graphical representation of research it lack of data understanding slides pdf bundle. Topics like lack of data understanding faced by the company can be discussed with this completely editable template. It is available for immediate download depending on the needs and requirements of the user.
-
Graphical Representation Of Research IT Sales Performance Dashboard Sample PDF
This slide depicts the dashboard for sales performance after the implementation of visualization research based on revenue, quantity, regional sales. Deliver and pitch your topic in the best possible manner with this graphical representation of research it sales performance dashboard sample pdf. Use them to share invaluable insights on sales performance dashboard after visualization research implementation and impress your audience. This template can be altered and modified as per your expectations. So, grab it now.
-
Graphical Representation Of Research IT 30 60 90 Days Plan For Visualization Diagrams PDF
This slide shows the 30 60 90 days plan for visualization research, such as knowing and sorting the data, analyzing the information, and different tools required. This is a graphical representation of research it 30 60 90 days plan for visualization diagrams pdf template with various stages. Focus and dispense information on three stages using this creative set, that comes with editable features. It contains large content boxes to add your information on topics like information, required, analyzing. You can also showcase facts, figures, and other relevant content using this PPT layout. Grab it now.
-
Graphical Representation Of Research IT Bivariate Analysis Techniques Formats PDF
This slide describes the second analysis technique, bivariate analysis for data visualization, which includes three plots line, bar, and scatter. Deliver and pitch your topic in the best possible manner with this graphical representation of research it bivariate analysis techniques formats pdf. Use them to share invaluable insights on bivariate analysis techniques for data visualization and impress your audience. This template can be altered and modified as per your expectations. So, grab it now.
-
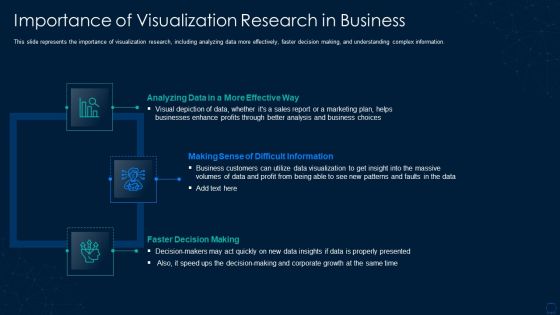
Graphical Representation Of Research IT Importance Of Visualization Research In Business Summary PDF
This slide represents the importance of visualization research, including analyzing data more effectively, faster decision making, and understanding complex information. This is a graphical representation of research it importance of visualization research in business summary pdf template with various stages. Focus and dispense information on three stages using this creative set, that comes with editable features. It contains large content boxes to add your information on topics like business customers, marketing plan, growth, data. You can also showcase facts, figures, and other relevant content using this PPT layout. Grab it now.
-
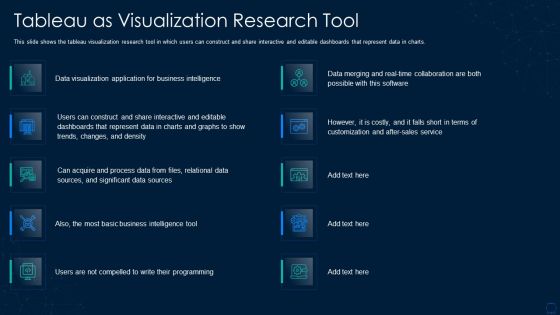
Graphical Representation Of Research IT Tableau As Visualization Research Tool Graphics PDF
This slide shows the tableau visualization research tool in which users can construct and share interactive and editable dashboards that represent data in charts. Deliver and pitch your topic in the best possible manner with this graphical representation of research it tableau as visualization research tool graphics pdf. Use them to share invaluable insights on process data, sources, sales, application and impress your audience. This template can be altered and modified as per your expectations. So, grab it now.
-
Icons Slide For Graphical Representation Of Research IT Information PDF
Presenting our innovatively structured icons slide for graphical representation of research it information pdf set of slides. The slides contain a hundred percent editable icons. You can replace these icons without any inconvenience. Therefore, pick this set of slides and create a striking presentation.
-
Graphical Representation Of Research IT Data Driven Project Planning Structure PDF
This slide depicts the impact of visualization research implementation, which results in data driven project planning, due to which there is a 23 times increase in happy customers. This is a graphical representation of research it data driven project planning structure pdf template with various stages. Focus and dispense information on three stages using this creative set, that comes with editable features. It contains large content boxes to add your information on topics like profit, customers, strategy. You can also showcase facts, figures, and other relevant content using this PPT layout. Grab it now.
-
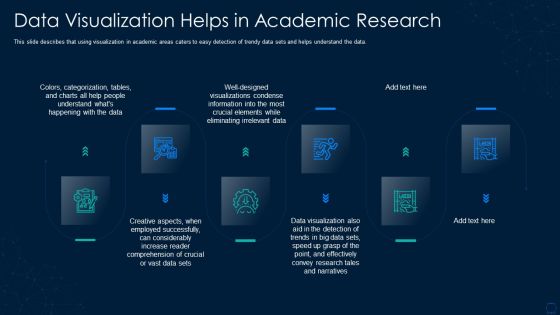
Graphical Representation Of Research IT Data Visualization Helps In Academic Research Microsoft PDF
This slide describes that using visualization in academic areas caters to easy detection of trendy data sets and helps understand the data. Presenting graphical representation of research it data visualization helps in academic research microsoft pdf to provide visual cues and insights. Share and navigate important information on six stages that need your due attention. This template can be used to pitch topics like data visualization helps in academic research. In addtion, this PPT design contains high resolution images, graphics, etc, that are easily editable and available for immediate download.
-
Graphical Representation Of Research IT Google Charts Tool For Data Visualization Introduction PDF
This slide depicts google charts as the tool for data visualization, which can extract data from various sources, including SQL, databases, google sheets. This is a graphical representation of research it google charts tool for data visualization introduction pdf template with various stages. Focus and dispense information on five stages using this creative set, that comes with editable features. It contains large content boxes to add your information on topics like dynamic, databases, sources, technology. You can also showcase facts, figures, and other relevant content using this PPT layout. Grab it now.
-
Graphical Representation Of Research IT Information Visualization Research Branch Icons PDF
This slide explains information visualization as a branch of visualization research that includes visuals like histograms, trend graphs, flow charts. Presenting graphical representation of research it information visualization research branch icons pdf to provide visual cues and insights. Share and navigate important information on four stages that need your due attention. This template can be used to pitch topics like geographic, information, design. In addtion, this PPT design contains high resolution images, graphics, etc, that are easily editable and available for immediate download.
-
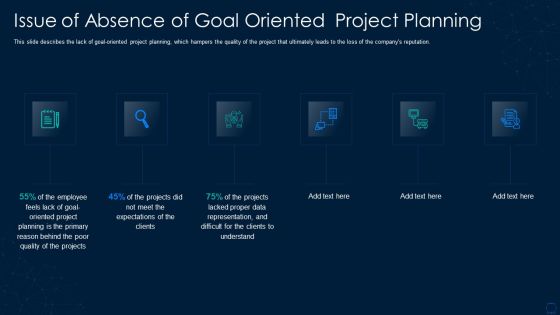
Graphical Representation Of Research IT Issue Of Absence Of Goal Designs PDF
This is a graphical representation of research it issue of absence of goal designs pdf template with various stages. Focus and dispense information on six stages using this creative set, that comes with editable features. It contains large content boxes to add your information on topics like planning, projects, quality. You can also showcase facts, figures, and other relevant content using this PPT layout. Grab it now.
-
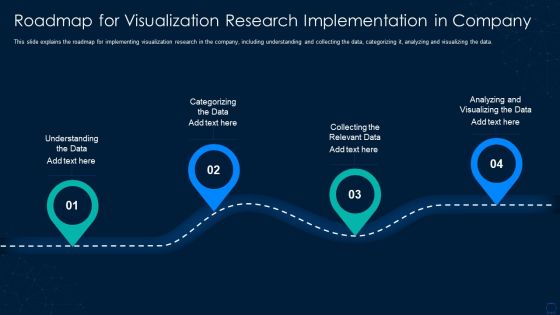
Graphical Representation Of Research IT Roadmap For Visualization Research Summary PDF
This slide explains the roadmap for implementing visualization research in the company, including understanding and collecting the data, categorizing it, analyzing and visualizing the data. Presenting graphical representation of research it roadmap for visualization research summary pdf to provide visual cues and insights. Share and navigate important information on four stages that need your due attention. This template can be used to pitch topics like roadmap for visualization research implementation in company. In addtion, this PPT design contains high resolution images, graphics, etc, that are easily editable and available for immediate download.
-
Graphical Representation Of Research IT Scientific Visualization Branch Information PDF
This slide explains scientific visualization, the first branch of visualization research which focuses on 3D phenomena and visually represents scientific data. This is a graphical representation of research it scientific visualization branch information pdf template with various stages. Focus and dispense information on four stages using this creative set, that comes with editable features. It contains large content boxes to add your information on topics like scientific visualization branch of visualization research. You can also showcase facts, figures, and other relevant content using this PPT layout. Grab it now.
-
Graphical Representation Of Research IT Univariate Analysis Techniques Icons PDF
This slide depicts the univariate analysis technique for data visualization, including distribution, box and whisker, and the violin plot. Presenting graphical representation of research it univariate analysis techniques icons pdf to provide visual cues and insights. Share and navigate important information on three stages that need your due attention. This template can be used to pitch topics like information, supplies, information, target. In addtion, this PPT design contains high resolution images, graphics, etc, that are easily editable and available for immediate download.
-
Graphical Representation Of Research IT Visual Analytics Branch Background PDF
This slide shows visual analytics, the last branch of visualization research, which emerged from the advancements in the other two branches and mainly focused on analytical reasoning. This is a graphical representation of research it visual analytics branch background pdf template with various stages. Focus and dispense information on five stages using this creative set, that comes with editable features. It contains large content boxes to add your information on topics like visual analytics branch of visualization research. You can also showcase facts, figures, and other relevant content using this PPT layout. Grab it now.


