Graphical chart PowerPoint Presentation Templates and Google Slides
-
Clustered Column Line Chart Ppt PowerPoint Presentation Inspiration Graphics Pictures
This is a clustered column line chart ppt powerpoint presentation inspiration graphics pictures. This is a four stage process. The stages in this process are business, marketing, strategy, planning, finance.
-
Radar Chart Ppt PowerPoint Presentation Show Graphics Download
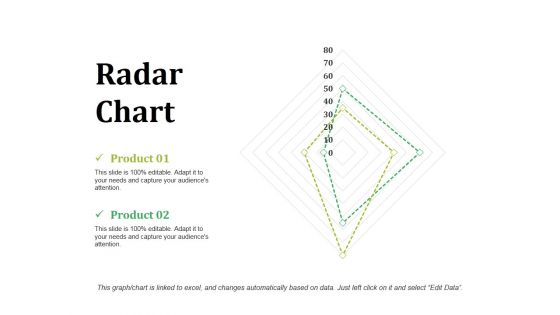
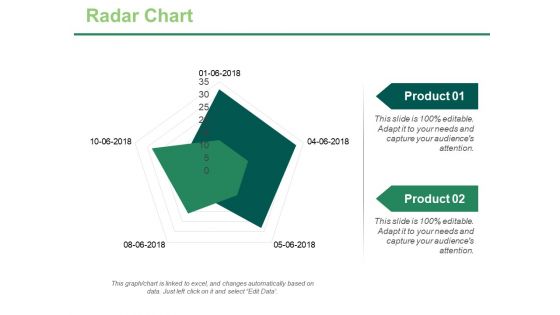
This is a radar chart ppt powerpoint presentation show graphics download. This is a two stage process. The stages in this process are business, marketing, strategy, planning, finance.
-
Organization Chart Ppt PowerPoint Presentation Gallery Graphics Pictures
This is a organization chart ppt powerpoint presentation gallery graphics pictures. This is a four stage process. The stages in this process are head customer relations name, production name, head bending name, head employee relation and admin, name head projects.
-
Area Chart Ppt PowerPoint Presentation Styles Graphics Download
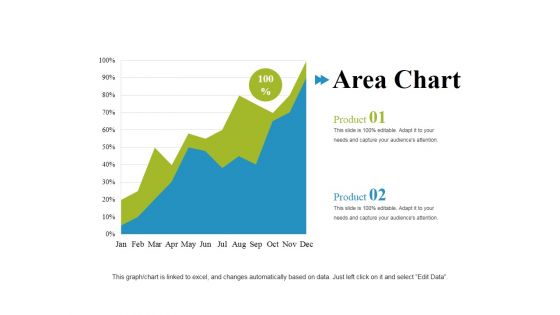
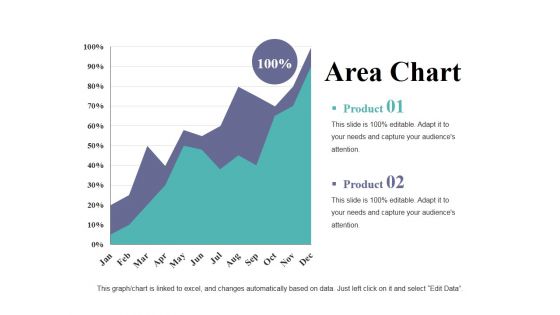
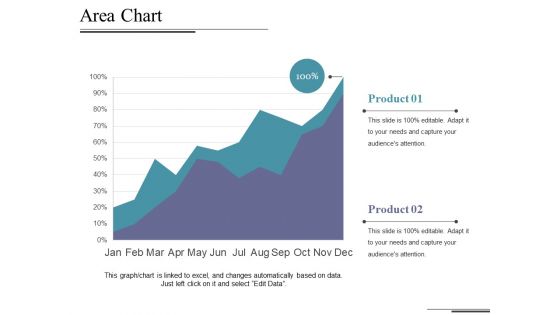
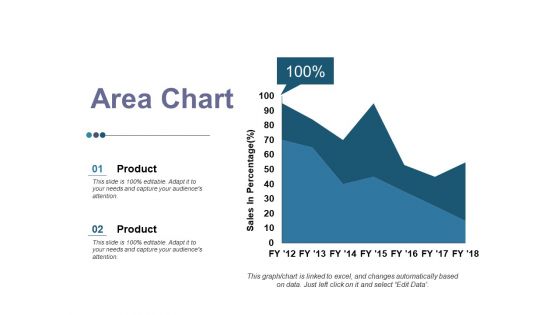
This is a area chart ppt powerpoint presentation styles graphics download. This is a two stage process. The stages in this process are product, in percentage, area chart, business, marketing.
-
Radar Chart Ppt PowerPoint Presentation Summary Graphics
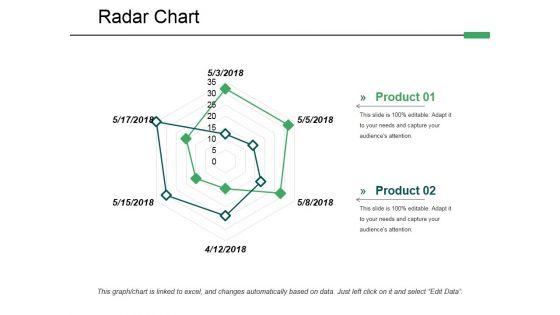
This is a radar chart ppt powerpoint presentation summary graphics. This is a two stage process. The stages in this process are radar chart, finance, analysis, marketing, business.
-
Rader Chart Ppt PowerPoint Presentation Icon Graphic Tips
This is a rader chart ppt powerpoint presentation icon graphic tips. This is a two stage process. The stages in this process are rader chart, finance, analysis, business, marketing.
-
Volume High Low Close Chart Ppt PowerPoint Presentation Icon Graphics Pictures
This is a volume high low close chart ppt powerpoint presentation icon graphics pictures. This is a two stage process. The stages in this process are high, volume, low.
-
Bubble Chart Ppt PowerPoint Presentation Summary Graphic Tips
This is a bubble chart ppt powerpoint presentation summary graphic tips. This is a three stage process. The stages in this process are chart, business, marketing, finance, strategy.
-
Volume Open High Low Close Chart Ppt PowerPoint Presentation File Graphics Template
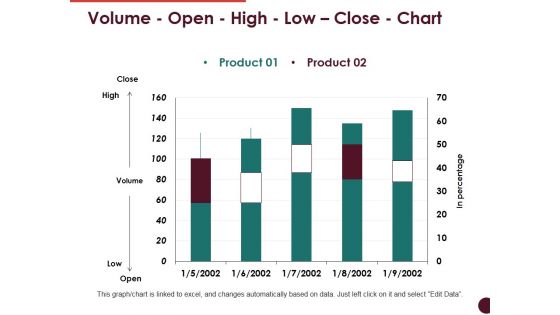
This is a volume open high low close chart ppt powerpoint presentation file graphics template. This is a two stage process. The stages in this process are close, high, volume, low, open, product.
-
Line Chart Ppt PowerPoint Presentation File Graphics Pictures
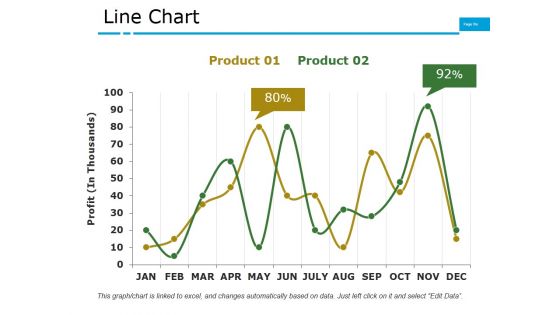
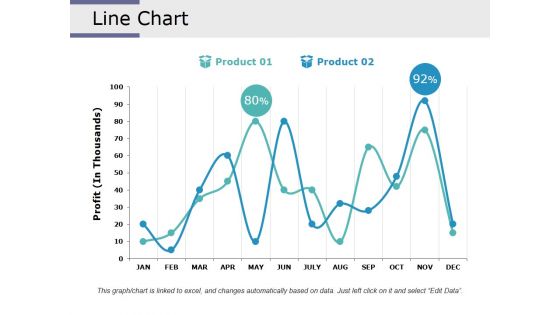
This is a line chart ppt powerpoint presentation file graphics pictures. This is a two stage process. The stages in this process are business, marketing, finance, graph, growth.
-
Column Chart Ppt PowerPoint Presentation Model Graphics Download
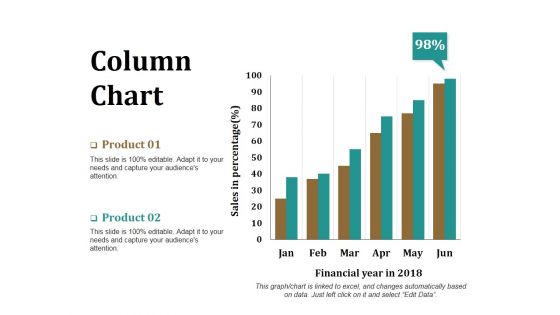
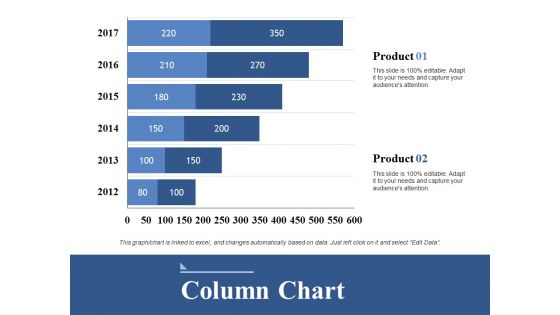
This is a column chart ppt powerpoint presentation model graphics download. This is a two stage process. The stages in this process are product, financial year, sales in percentage, bar graph, success.
-
Donut Pie Chart Ppt PowerPoint Presentation Portfolio Graphic Tips
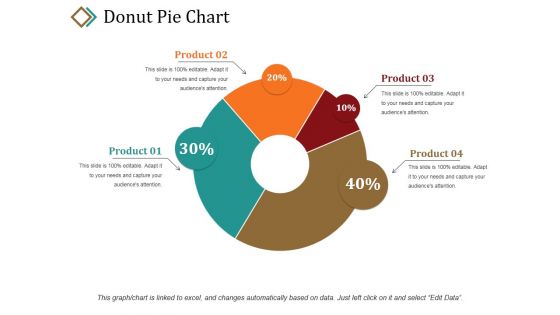
This is a donut pie chart ppt powerpoint presentation portfolio graphic tips. This is a four stage process. The stages in this process are product, percentage, business, marketing, donut.
-
Pie Chart Ppt PowerPoint Presentation Professional Graphic Images
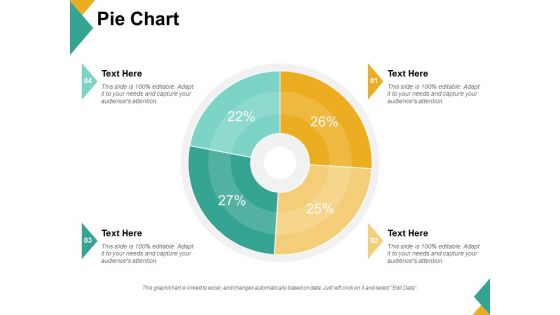
This is a pie chart ppt powerpoint presentation professional graphic images. This is a four stage process. The stages in this process are product, percentage, pie, finance, business.
-
Area Chart Ppt PowerPoint Presentation Styles Graphics Example
This is a area chart ppt powerpoint presentation styles graphics example. This is a two stage process. The stages in this process are business, marketing, strategy, finance, planning.
-
Column Chart Ppt PowerPoint Presentation Layouts Graphics Example
This is a column chart ppt powerpoint presentation layouts graphics example. This is a two stage process. The stages in this process are product, year, bar graph, business, finance.
-
Line Chart Ppt PowerPoint Presentation Pictures Graphic Images
This is a line chart ppt powerpoint presentation pictures graphic images. This is a two stage process. The stages in this process are line chart, growth, strategy, marketing, business.
-
Combo Chart Ppt PowerPoint Presentation Pictures Graphic Images
This is a combo chart ppt powerpoint presentation pictures graphic images. This is a three stage process. The stages in this process are bar graph, growth, market size, growth rate, success.
-
Stock Chart Ppt PowerPoint Presentation Summary Graphics
This is a stock chart ppt powerpoint presentation summary graphics. This is a two stage process. The stages in this process are High, Volume, Low, Business, Marketing.
-
Radar Chart Ppt PowerPoint Presentation Icon Graphics Example
This is a radar chart ppt powerpoint presentation icon graphics example. This is a two stage process. The stages in this process are business, marketing, strategy, planning, finance.
-
Area Chart Ppt PowerPoint Presentation Professional Graphic Images
This is a area chart ppt powerpoint presentation professional graphic images. This is a two stage process. The stages in this process are area chart, growth, strategy, business, finance, analysis.
-
Stacked Line Chart Ppt PowerPoint Presentation Summary Graphics Pictures
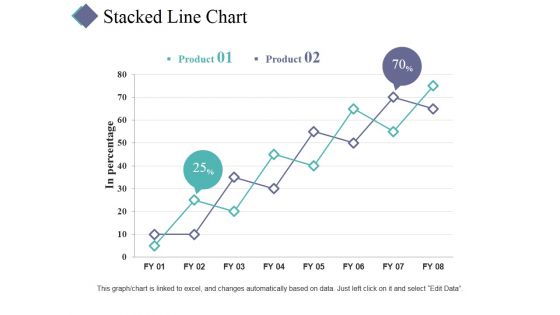
This is a stacked line chart ppt powerpoint presentation summary graphics pictures. This is a two stage process. The stages in this process are stacked line chart, growth, analysis, finance, business.
-
Area Chart Ppt PowerPoint Presentation File Graphics Example
This is a area chart ppt powerpoint presentation file graphics example. This is a two stage process. The stages in this process are business, marketing, strategy, planning, finance.
-
Donut Pie Chart Ppt PowerPoint Presentation Inspiration Graphic Images
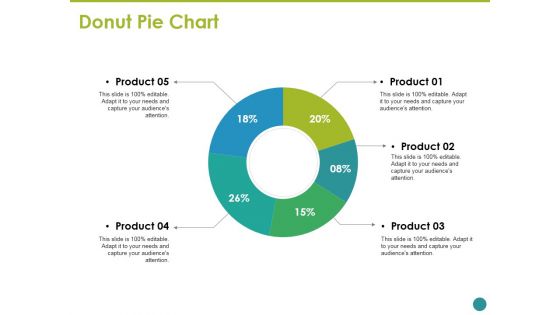
This is a donut pie chart ppt powerpoint presentation inspiration graphic images. This is a five stage process. The stages in this process are business, marketing, strategy, planning, donut.
-
Radar Chart Ppt PowerPoint Presentation Show Graphics Template
This is a radar chart ppt powerpoint presentation show graphics template. This is a two stage process. The stages in this process are business, marketing, strategy, finance, planning.
-
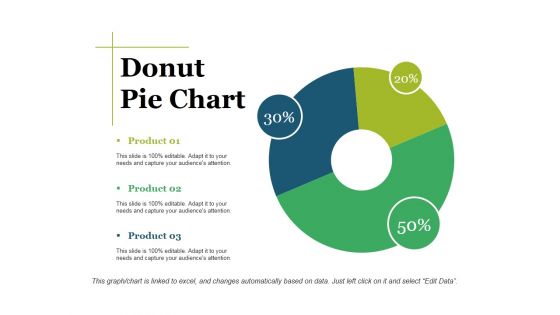
Donut Pie Chart Ppt PowerPoint Presentation Show Graphic Tips
This is a donut pie chart ppt powerpoint presentation show graphic tips. This is a three stage process. The stages in this process are donut pie chart, finance, marketing, strategy, analysis, business.
-
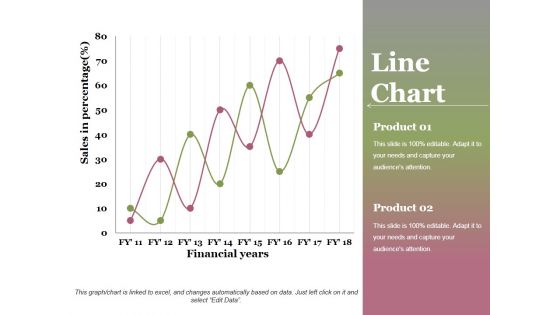
Line Chart Ppt PowerPoint Presentation Infographics Graphic Images
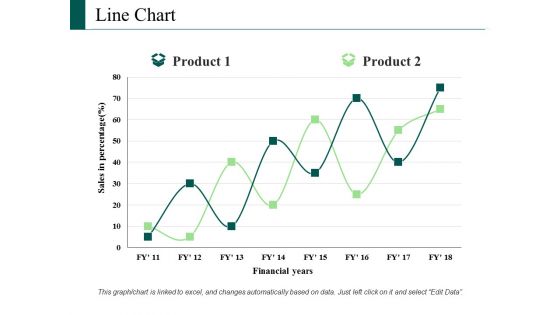
This is a line chart ppt powerpoint presentation infographics graphic images. This is a two stage process. The stages in this process are sales in percentage, financial years, growth, business, marketing.
-
Column Chart Ppt PowerPoint Presentation Gallery Graphics Example
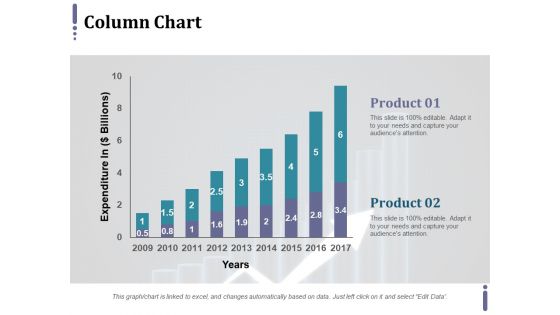
This is a column chart ppt powerpoint presentation gallery graphics example. This is a two stage process. The stages in this process are expenditure in, years, business, marketing, growth.
-
Line Chart Ppt PowerPoint Presentation Professional Graphics Design
This is a line chart ppt powerpoint presentation professional graphics design. This is a two stage process. The stages in this process are financial years, sales in percentage, product, growth, success.
-
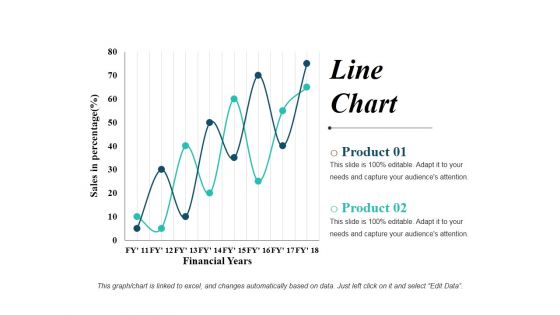
Line Chart Ppt PowerPoint Presentation Show Graphics Design
This is a line chart ppt powerpoint presentation show graphics design. This is a two stage process. The stages in this process are line graph, business, marketing, finance, planning.
-
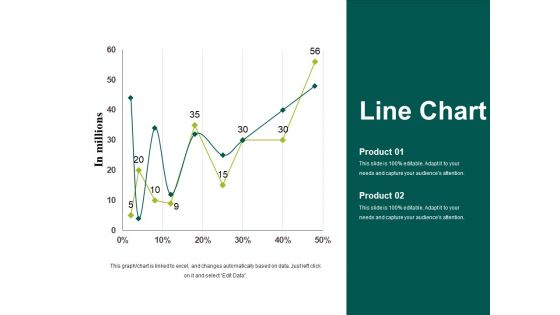
Line Chart Template 1 Ppt PowerPoint Presentation Styles Graphics Tutorials
This is a line chart template 1 ppt powerpoint presentation styles graphics tutorials. This is a two stage process. The stages in this process are in millions, business, marketing, strategy, graph.
-
Project Management Gantt Chart Template 1 Ppt PowerPoint Presentation Gallery Graphics Template
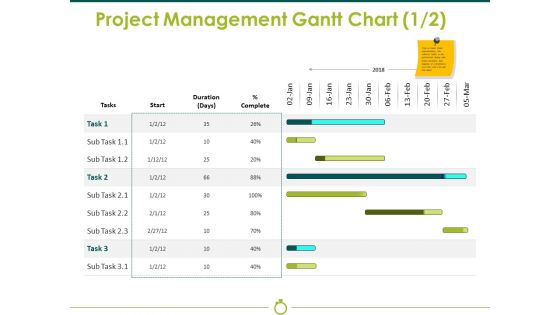
This is a project management gantt chart template 1 ppt powerpoint presentation gallery graphics template. This is a two stage process. The stages in this process are start, duration, complete, business, finance.
-
Pie Chart Ppt PowerPoint Presentation Professional Graphics
This is a pie chart ppt powerpoint presentation professional graphics. This is a three stage process. The stages in this process are chart, percentage, business, marketing, strategy.
-
Rader Chart Ppt PowerPoint Presentation Infographic Template Graphics
This is a rader chart ppt powerpoint presentation infographic template graphics. This is a three stage process. The stages in this process are rader, chart, business, marketing, finance.
-
Bubble Chart Ppt PowerPoint Presentation Inspiration Graphics Download
This is a bubble chart ppt powerpoint presentation inspiration graphics download. This is a three stage process. The stages in this process are product, growth, success, bubble chart, business.
-
Area Chart Ppt PowerPoint Presentation Outline Graphics Download
This is a area chart ppt powerpoint presentation outline graphics download. This is a two stage process. The stages in this process are chart, percentage, business, marketing, strategy.
-
Column Chart Ppt PowerPoint Presentation File Graphics
This is a column chart ppt powerpoint presentation file graphics. This is a two stage process. The stages in this process are column chart, finance, analysis, marketing, business.
-
Bubble Chart Ppt PowerPoint Presentation Layouts Graphic Images
This is a bubble chart ppt powerpoint presentation layouts graphic images. This is a two stage process. The stages in this process are bubble chart, finance, marketing, strategy, business, analysis.
-
Area Chart Ppt PowerPoint Presentation Portfolio Graphics Template
This is a area chart ppt powerpoint presentation portfolio graphics template. This is a two stage process. The stages in this process are area chart, finance, analysis, business, marketing.
-
Pie Chart Ppt PowerPoint Presentation Infographic Template Graphics Example
This is a pie chart ppt powerpoint presentation infographic template graphics example. This is a four stage process. The stages in this process are pie chart, finance, marketing, strategy, business.
-
Sample Project Charter Document Ppt PowerPoint Presentation Summary Graphic Images
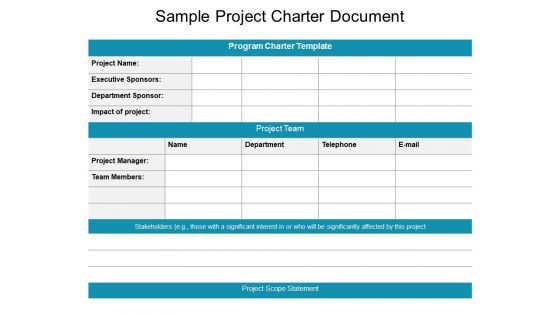
This is a sample project charter document ppt powerpoint presentation summary graphic images. This is a two stage process. The stages in this process are project management, project charter, program charter.
-
Area Chart Ppt PowerPoint Presentation Infographics Graphics Pictures
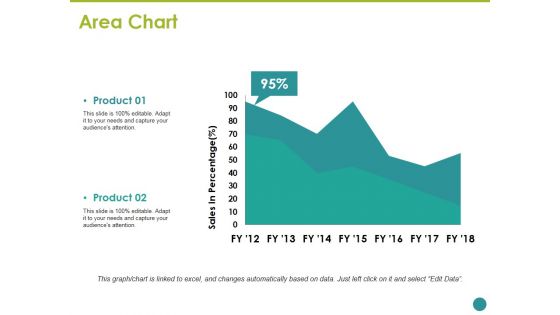
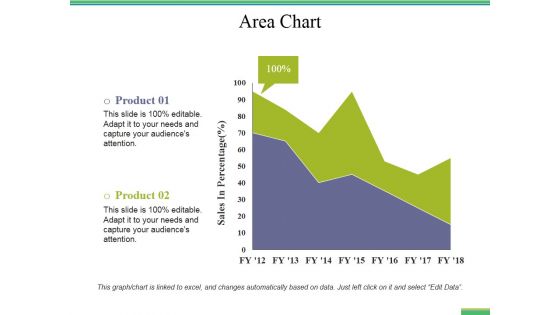
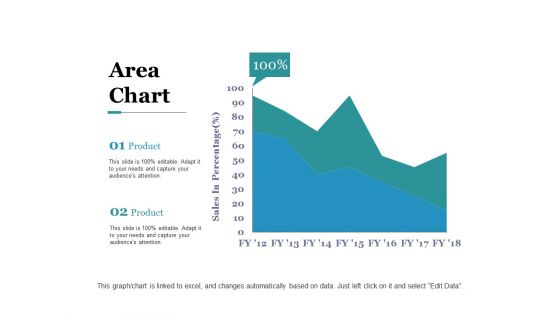
This is a area chart ppt powerpoint presentation infographics graphics pictures. This is a two stage process. The stages in this process are business, sales in percentage, area chart, marketing, graph.
-
Combo Chart Ppt PowerPoint Presentation Gallery Graphics Tutorials
This is a Combo Chart Ppt PowerPoint Presentation Gallery Graphics Tutorials. This is a three stage process. The stages in this process are combo chart, finance, marketing, strategy, analysis.
-
Organization Chart Ppt PowerPoint Presentation Ideas Graphics Download
This is a organization chart ppt powerpoint presentation ideas graphics download. This is a three stage process. The stages in this process are hierarchy, step, teamwork, communication, business.
-
Scatter Bubble Chart Ppt PowerPoint Presentation Infographic Template Graphic Images
This is a scatter bubble chart ppt powerpoint presentation infographic template graphic images. This is a two stage process. The stages in this process are business, in price, bubble chart, marketing, strategy.
-
Area Chart Ppt PowerPoint Presentation Outline Graphic Tips
This is a area chart ppt powerpoint presentation outline graphic tips. This is a two stage process. The stages in this process are business, sales in percentage, area chart, percentage, marketing.
-
Line Chart Ppt PowerPoint Presentation Inspiration Graphics Tutorials
This is a line chart ppt powerpoint presentation inspiration graphics tutorials. This is a two stage process. The stages in this process are line chart, growth, strategy, analysis, business.
-
Area Chart Ppt PowerPoint Presentation Layouts Graphic Images
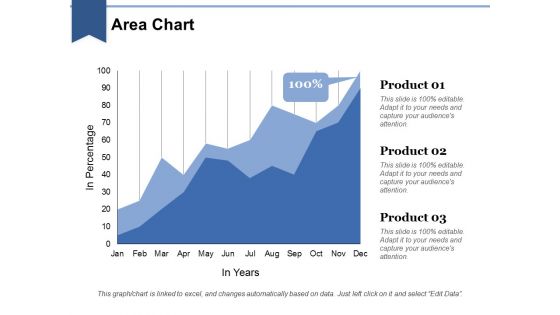
This is a area chart ppt powerpoint presentation layouts graphic images. This is a three stage process. The stages in this process are business, in years, marketing, in percentage, finance, graph.
-
Line Chart Ppt PowerPoint Presentation Ideas Graphics Tutorials
This is a line chart ppt powerpoint presentation ideas graphics tutorials. This is a two stage process. The stages in this process are line chart, marketing, strategy, planning, finance.
-
Pareto Chart Template Ppt PowerPoint Presentation Summary Graphic Images
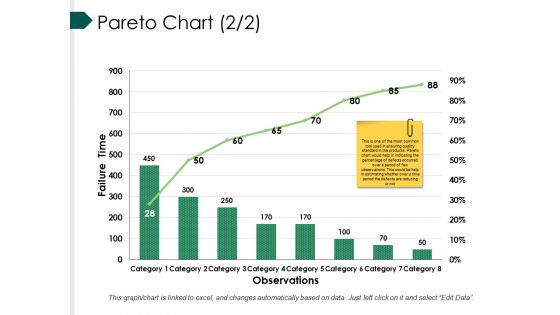
This is a pareto chart template ppt powerpoint presentation summary graphic images. This is a eight stage process. The stages in this process are bar, marketing, strategy, finance, teamwork.
-
Combo Chart Ppt PowerPoint Presentation Infographics Graphics Pictures
This is a combo chart ppt powerpoint presentation infographics graphics pictures. This is a three stage process. The stages in this process are product, business, marketing, combo chart.
-
Area Chart Ppt PowerPoint Presentation Inspiration Graphics
This is a area chart ppt powerpoint presentation inspiration graphics. This is a two stage process. The stages in this process are product, area chart, business, growth, sales in percentage.
-
Radar Chart Ppt PowerPoint Presentation Show Graphic Images
This is a radar chart ppt powerpoint presentation show graphic images. This is a two stage process. The stages in this process are business, radar chart, marketing, graph, strategy.
-
Scatter Chart Ppt PowerPoint Presentation File Graphics
This is a scatter chart ppt powerpoint presentation file graphics. This is a one stage process. The stages in this process are business, marketing, strategy, planning, finance.
-
Donut Pie Chart Ppt PowerPoint Presentation Professional Graphic Images
This is a donut pie chart ppt powerpoint presentation professional graphic images. This is a three stage process. The stages in this process are percentage, finance, donut, business, marketing.
-
Stacked Line Chart Ppt PowerPoint Presentation Styles Graphics
This is a stacked line chart ppt powerpoint presentation styles graphics. This is a two stage process. The stages in this process are product, year, profit, percentage, growth.
-
Column Chart Ppt PowerPoint Presentation Ideas Graphics
This is a column chart ppt powerpoint presentation ideas graphics. This is a two stage process. The stages in this process are business, chart, years, marketing, finance.
-
Radar Chart Ppt PowerPoint Presentation Portfolio Graphics Template
This is a radar chart ppt powerpoint presentation portfolio graphics template. This is a two stage process. The stages in this process are product, finance, shape, radar chart, business.
-
Column Chart Ppt PowerPoint Presentation Model Graphics Example
This is a column chart ppt powerpoint presentation model graphics example. This is a two stage process. The stages in this process are expenditure in, product, years.
-
Area Chart Ppt PowerPoint Presentation Outline Graphics Pictures
This is a area chart ppt powerpoint presentation outline graphics pictures. This is a two stage process. The stages in this process are financial year, in percentage, business, marketing, finance.
-
Column Chart Ppt PowerPoint Presentation Layouts Graphic Images
This is a column chart ppt powerpoint presentation layouts graphic images. This is a two stage process. The stages in this process are business, finance, years, graph, expenditure in, marketing.


