Graphical chart PowerPoint Presentation Templates and Google Slides
-
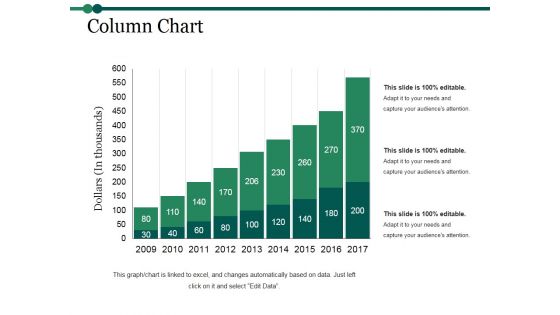
Column Chart Ppt PowerPoint Presentation Styles Graphic Tips
This is a column chart ppt powerpoint presentation styles graphic tips. This is a six stage process. The stages in this process are slide bar, business, marketing, strategy, finance.
-
Pie Chart Ppt PowerPoint Presentation Icon Graphics Download
This is a pie chart ppt powerpoint presentation icon graphics download. This is a four stage process. The stages in this process are pie, finance, analysis, marketing, percentage.
-
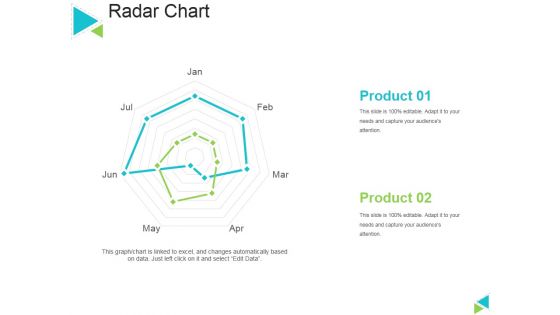
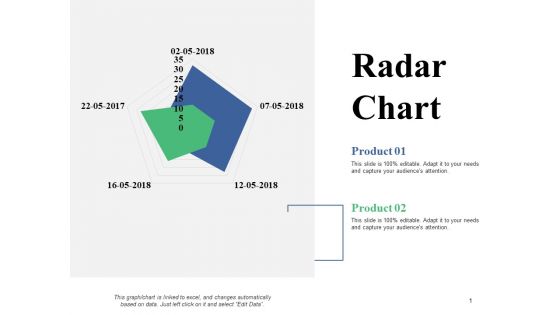
Radar Chart Ppt PowerPoint Presentation Gallery Graphic Tips
This is a radar chart ppt powerpoint presentation gallery graphic tips. This is a two stage process. The stages in this process are product, radar chart, process, business, marketing.
-
Area Chart Ppt PowerPoint Presentation Pictures Graphics Design
This is a area chart ppt powerpoint presentation pictures graphics design. This is a two stage process. The stages in this process are charts, success, finance, percentage, growth.
-
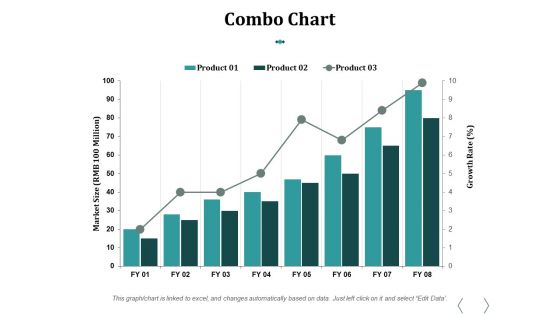
Combo Chart Ppt PowerPoint Presentation Pictures Graphics
This is a combo chart ppt powerpoint presentation pictures graphics. This is a eight stage process. The stages in this process are business, marketing, strategy, finance, bar.
-
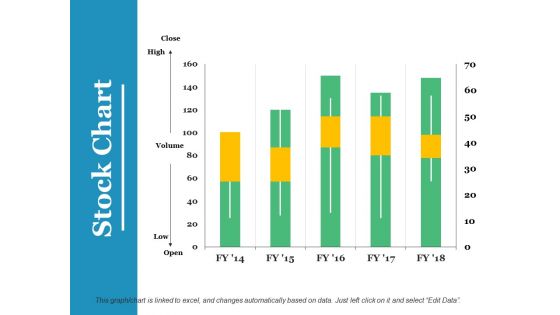
Stock Chart Ppt PowerPoint Presentation Pictures Graphics Tutorials
This is a stock chart ppt powerpoint presentation pictures graphics tutorials. This is a five stage process. The stages in this process are high, volume, low, product, business.
-
Scatter Bubble Chart Ppt PowerPoint Presentation Professional Graphics Pictures
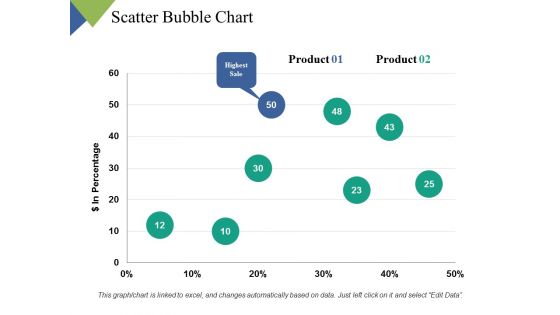
This is a scatter bubble chart ppt powerpoint presentation professional graphics pictures. This is a one stage process. The stages in this process are profit in sales, financial year, highest profit, product.
-
Stock Chart Ppt PowerPoint Presentation Outline Graphics Example
This is a stock chart ppt powerpoint presentation outline graphics example. This is a five stage process. The stages in this process are close, volume, low, high, open, product.
-
Hierarchy Chart Ppt PowerPoint Presentation Infographic Template Graphics
This is a hierarchy chart ppt powerpoint presentation infographic template graphics. This is a four stage process. The stages in this process are ceo, director, accountant, sales, developer.
-
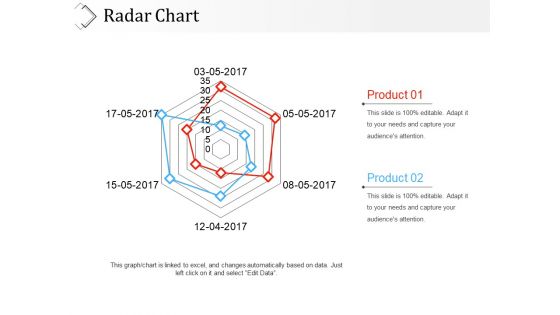
Radar Chart Ppt PowerPoint Presentation File Graphic Tips
This is a radar chart ppt powerpoint presentation file graphic tips. This is a two stage process. The stages in this process are product, finance, marketing, business.
-
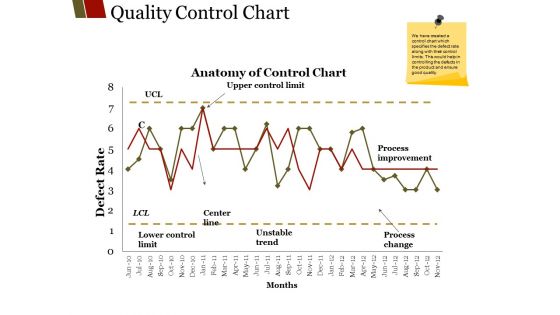
Quality Control Chart Ppt PowerPoint Presentation File Graphics Design
This is a quality control chart ppt powerpoint presentation file graphics design. This is a two stage process. The stages in this process are unstable trend, months center line, lower control limit, process improvement.
-
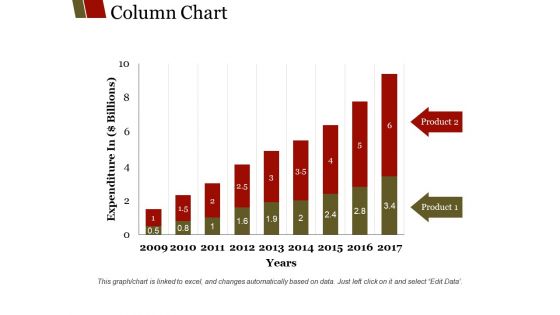
Column Chart Ppt PowerPoint Presentation Summary Graphics
This is a column chart ppt powerpoint presentation summary graphics. This is a nine stage process. The stages in this process are product, years, expenditure in billions, graph, business.
-
Stock Chart Ppt PowerPoint Presentation Icon Graphic Images
This is a stock chart ppt powerpoint presentation icon graphic images. This is a five stage process. The stages in this process are high, volume, low, close.
-
Stock Chart Ppt PowerPoint Presentation Gallery Graphic Images
This is a stock chart ppt powerpoint presentation gallery graphic images. This is a five stage process. The stages in this process are close, high, volume, low, open.
-
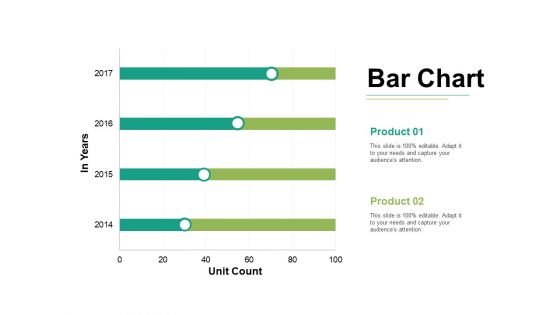
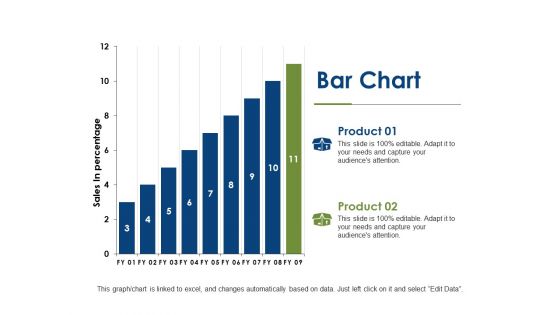
Bar Chart Ppt PowerPoint Presentation Professional Graphics Download
This is a bar chart ppt powerpoint presentation professional graphics download. This is a seven stage process. The stages in this process are sales in percentage, financial years, chart, business.
-
Area Chart Ppt PowerPoint Presentation File Graphic Tips
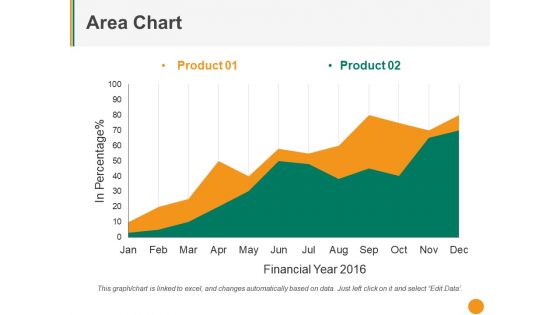
This is a area chart ppt powerpoint presentation file graphic tips. This is a two stage process. The stages in this process are product, in percentage, financial year, business, growth.
-
High Low Close Chart Template 1 Ppt PowerPoint Presentation Infographics Graphics Design
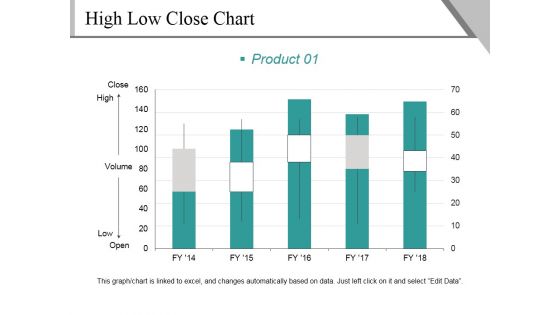
This is a high low close chart template 1 ppt powerpoint presentation infographics graphics design. This is a five stage process. The stages in this process are close, high, volume, low, open, product.
-
Volume Open High Low Close Chart Ppt PowerPoint Presentation Ideas Graphics Example
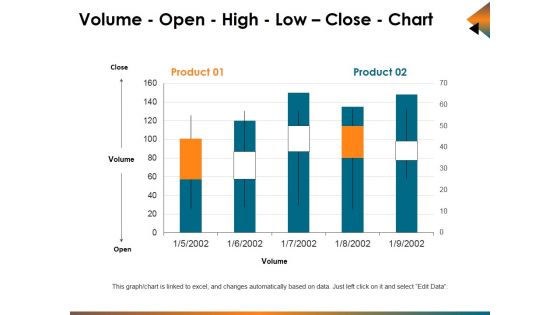
This is a volume open high low close chart ppt powerpoint presentation ideas graphics example. This is a five stage process. The stages in this process are business, bar graph, stock, cost, market.
-
Combo Chart Ppt PowerPoint Presentation Outline Graphics Tutorials
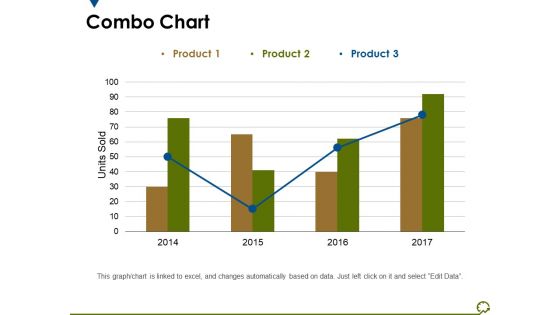
This is a combo chart ppt powerpoint presentation outline graphics tutorials. This is a three stage process. The stages in this process are units sold, years, business, marketing, graph.
-
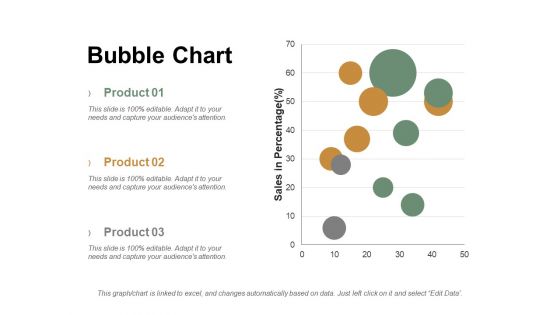
Bubble Chart Ppt PowerPoint Presentation Show Graphics
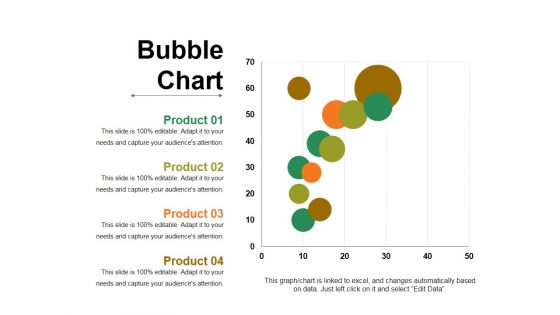
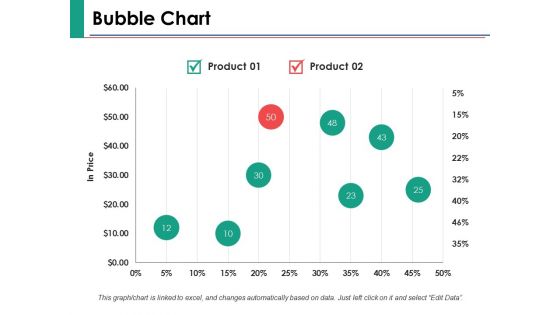
This is a bubble chart ppt powerpoint presentation show graphics. This is a four stage process. The stages in this process are business, marketing, graph, finance, strategy.
-
Scatter Chart Ppt PowerPoint Presentation Professional Graphic Images
This is a scatter chart ppt powerpoint presentation professional graphic images. This is a eight stage process. The stages in this process are product, profit, in percentage growth, business.
-
High Low Close Chart Ppt PowerPoint Presentation Model Graphics Tutorials
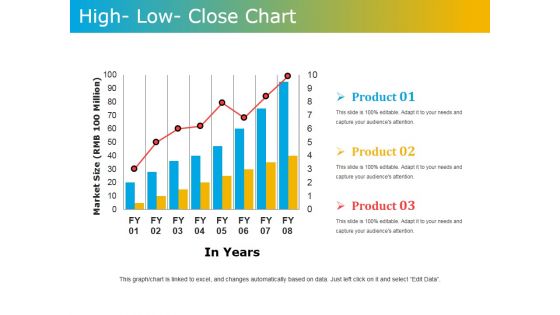
This is a high low close chart ppt powerpoint presentation model graphics tutorials. This is a three stage process. The stages in this process are market size, in years, product.
-
Area Chart Ppt PowerPoint Presentation Icon Graphics Tutorials
This is a area chart ppt powerpoint presentation icon graphics tutorials. This is a two stage process. The stages in this process are chart, percentage, business, growth, strategy.
-
Stock Chart Ppt PowerPoint Presentation Pictures Graphics Design
This is a stock chart ppt powerpoint presentation pictures graphics design. This is a five stage process. The stages in this process are high, volume, low, business, marketing, graph.
-
Bubble Chart Finance Ppt PowerPoint Presentation File Graphics
This is a bubble chart finance ppt powerpoint presentation file graphics. This is a two stage process. The stages in this process are bubble chart, finance, marketing, analysis, investment.
-
Control Charts Template 1 Ppt PowerPoint Presentation Show Graphics Design
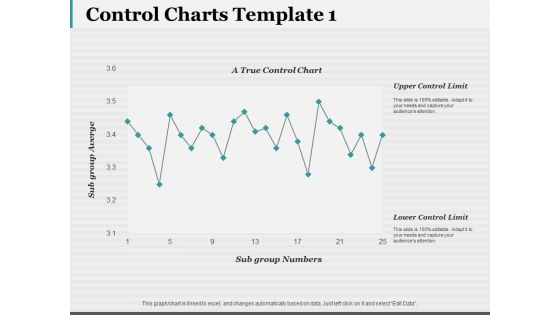
This is a control charts template 1 ppt powerpoint presentation show graphics design. This is a one stage process. The stages in this process are business, finance, marketing, strategy, analysis.
-
Combo Chart Finance Ppt PowerPoint Presentation Infographic Template Graphics
This is a combo chart finance ppt powerpoint presentation infographic template graphics. This is a two stage process. The stages in this process are growth, finance, marketing, management, investment.
-
Line Chart Finance Ppt PowerPoint Presentation Infographic Template Graphics Tutorials
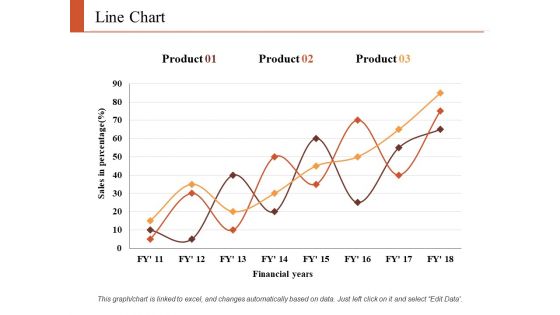
This is a line chart finance ppt powerpoint presentation infographic template graphics tutorials. This is a three stage process. The stages in this process are finance, marketing, analysis, business, investment.
-
Column Chart Ppt PowerPoint Presentation Infographics Graphics Template
This is a column chart ppt powerpoint presentation infographics graphics template. This is a two stage process. The stages in this process are percentage, product, business, management, marketing.
-
Area Chart Ppt PowerPoint Presentation Show Graphics Tutorials
This is a area chart ppt powerpoint presentation show graphics tutorials. This is a two stage process. The stages in this process are area chart, percentage, product, marketing, management.
-
Combo Chart Ppt PowerPoint Presentation Summary Graphic Images
This is a combo chart ppt powerpoint presentation summary graphic images. This is a three stage process. The stages in this process are combo chart, product, growth, marketing, business.
-
Bubble Chart Ppt PowerPoint Presentation Summary Graphics Tutorials
This is a bubble chart ppt powerpoint presentation summary graphics tutorials. This is a three stage process. The stages in this process are product, sales in percentage, bubble chart.
-
Radar Chart Ppt PowerPoint Presentation Slides Graphics Tutorials
This is a radar chart ppt powerpoint presentation slides graphics tutorials. This is a two stage process. The stages in this process are radar chart, finance, marketing, planning, business.
-
Bar Chart Ppt PowerPoint Presentation Styles Graphics Tutorials Ppt PowerPoint Presentation Slides Gallery
This is a bar chart ppt powerpoint presentation styles graphics tutorials ppt powerpoint presentation slides gallery. This is a two stage process. The stages in this process are bar graph, growth, success, business, marketing.
-
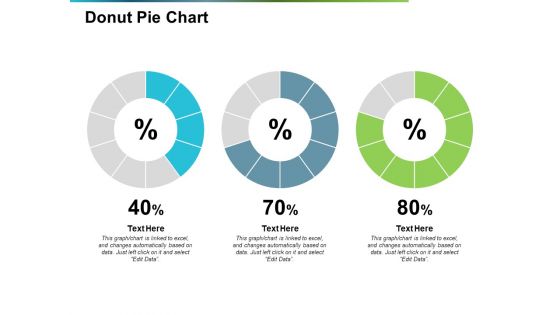
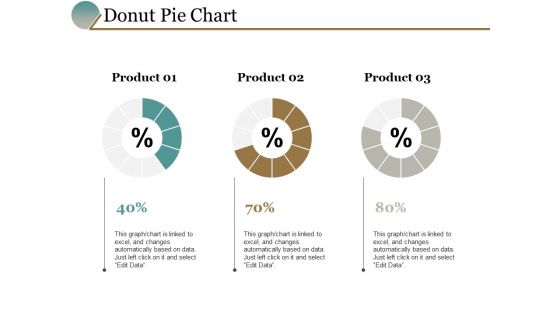
Donut Pie Chart Ppt PowerPoint Presentation Show Graphics Download
This is a donut pie chart ppt powerpoint presentation show graphics download. This is a three stage process. The stages in this process are percentage, finance, donut, business, marketing.
-
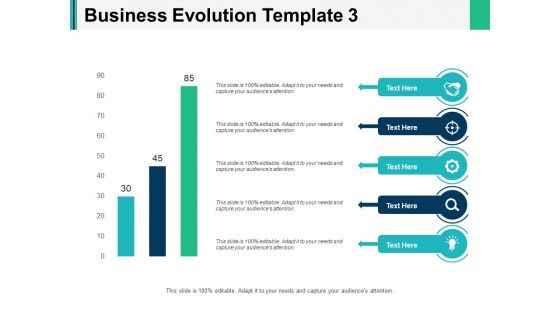
Business Evolution Chart Ppt PowerPoint Presentation Inspiration Graphics Tutorials
This is a business evolution chart ppt powerpoint presentation inspiration graphics tutorials. This is a three stage process. The stages in this process are marketing, business, management, planning, strategy.
-
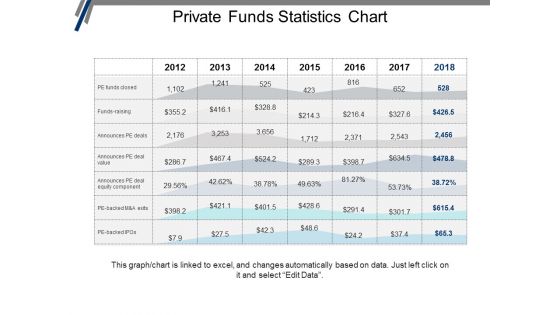
Private Funds Statistics Chart Ppt PowerPoint Presentation Portfolio Graphics Design
This is a private funds statistics chart ppt powerpoint presentation portfolio graphics design. This is a seven stage process. The stages in this process are investment, funding, private equity, venture capital.
-
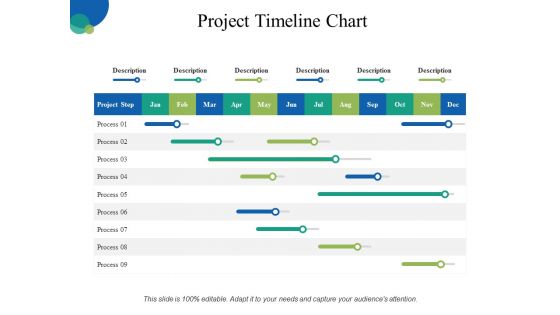
Project Timeline Chart Ppt PowerPoint Presentation Slides Graphics
This is a project timeline chart ppt powerpoint presentation slides graphics. This is a six stage process. The stages in this process are process, marketing, planning, strategy, timeline.
-
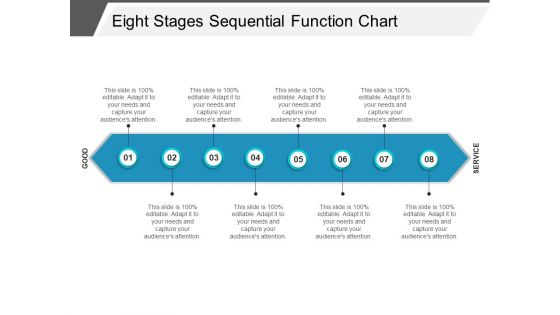
Eight Stages Sequential Function Chart Ppt PowerPoint Presentation Slides Graphics
This is a eight stages sequential function chart ppt powerpoint presentation slides graphics. This is a eight stage process. The stages in this process are circular, continuity, continuum.
-
Stock Chart Ppt PowerPoint Presentation Infographics Graphics Example
This is a stock chart ppt powerpoint presentation infographics graphics example. This is a five stage process. The stages in this process are stock chart, finance, business, planning, marketing.
-
Bar Chart Growth Ppt PowerPoint Presentation Gallery Graphics
This is a bar chart growth ppt powerpoint presentation gallery graphics. This is a two stage process. The stages in this process are analysis, business, finance, investment, strategy.
-
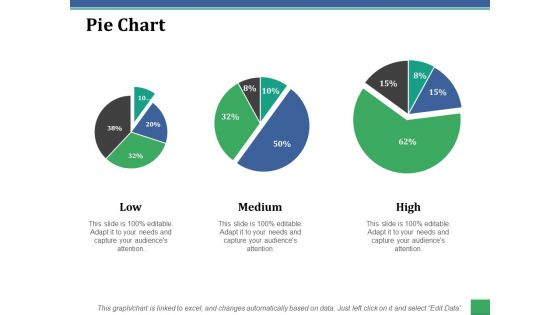
Pie Chart Ppt PowerPoint Presentation File Graphics Download
This is a pie chart ppt powerpoint presentation file graphics download. This is a three stage process. The stages in this process are low, medium, high, pie chart, finance.
-
Bubble Chart Finance Ppt PowerPoint Presentation Ideas Graphics
This is a bubble chart finance ppt powerpoint presentation ideas graphics. This is a two stage process. The stages in this process are finance, marketing, management, investment, analysis.
-
Scatter Bubble Chart Ppt PowerPoint Presentation Inspiration Graphics Tutorials
This is a scatter bubble chart ppt powerpoint presentation inspiration graphics tutorials. This is a two stage process. The stages in this process are finance, marketing, management, investment, analysis.
-
Responsibility Chart Project Management Ppt Powerpoint Presentation Show Graphics Design Cpb
This is a responsibility chart project management ppt powerpoint presentation show graphics design cpb. This is a four stage process. The stages in this process are responsibility chart project management.
-
Mobile With Analytics Chart Ppt PowerPoint Presentation Layouts Graphics
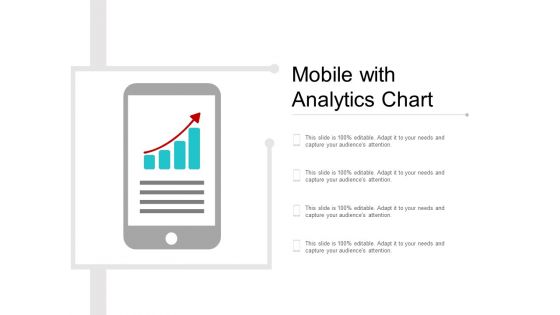
This is a mobile with analytics chart ppt powerpoint presentation layouts graphics. This is a four stage process. The stages in this process are mobile analytics, mobile tracking, mobile web analytics.
-
Donut Pie Chart Finance Management Ppt PowerPoint Presentation Portfolio Graphics Design
This is a donut pie chart finance management ppt powerpoint presentation portfolio graphics design. This is a three stage process. The stages in this process are pie chart, finance, marketing, business, analysis.
-
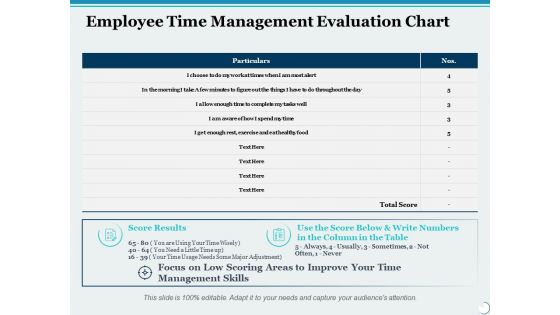
Employee Time Management Evaluation Chart Ppt PowerPoint Presentation File Graphic Images
This is a employee time management evaluation chart ppt powerpoint presentation file graphic images. This is a two stage process. The stages in this process are compare, business, management, marketing.
-
Plot Chart With Blue Green Dots Ppt Powerpoint Presentation Portfolio Graphic Tips
This is a plot chart with blue green dots ppt powerpoint presentation portfolio graphic tips. This is a four stage process. The stages in this process are scatter plot, probability plots, plot diagram.
-
Data Collection And Analysis Flow Chart Ppt PowerPoint Presentation Outline Graphics
This is a data collection and analysis flow chart ppt powerpoint presentation outline graphics. This is a five stage process. The stages in this process are business, management, planning, strategy, marketing.
-
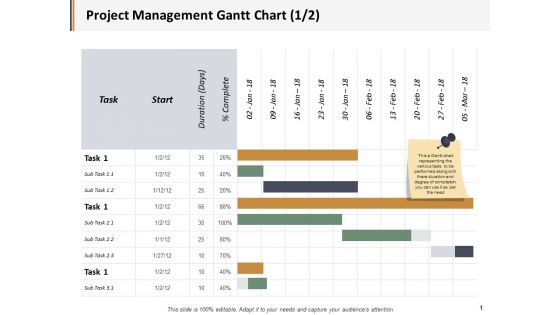
Project Management Gantt Chart Ppt PowerPoint Presentation File Graphic Images
This is a project management gantt chart ppt powerpoint presentation file graphic images. This is a three stage process. The stages in this process are business, management, marketing, compare.
-
Line Chart Ppt PowerPoint Presentation Summary Graphic Tips
This is a line chart ppt powerpoint presentation summary graphic tips. This is a two stage process. The stages in this process are line chart, product, in percentage, analysis, business.
-
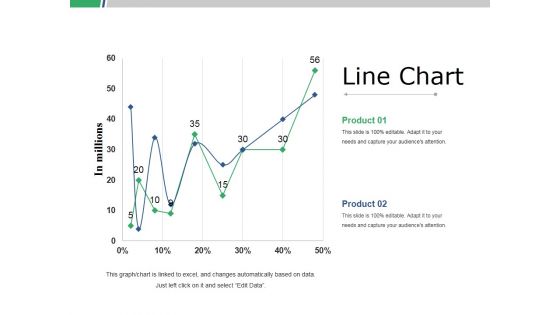
Line Chart Ppt PowerPoint Presentation Slides Graphics Tutorials
This is a line chart ppt powerpoint presentation slides graphics tutorials. This is a two stage process. The stages in this process are product, in millions, line chart, percentage, finance.
-
Column Chart Ppt PowerPoint Presentation Icon Graphic Images
This is a column chart ppt powerpoint presentation icon graphic images. This is a two stage process. The stages in this process are circle, loop, process, marketing, strategy.
-
Line Chart Ppt PowerPoint Presentation Slides Graphics Template
This is a line chart ppt powerpoint presentation slides graphics template. This is a two stage process. The stages in this process are business, marketing, strategy, line graph, finance.
-
Area Chart Ppt PowerPoint Presentation Portfolio Graphics
This is a area chart ppt powerpoint presentation portfolio graphics. This is a two stage process. The stages in this process are business, finance, area chart, management, growth.
-
Column Chart Ppt PowerPoint Presentation Gallery Graphics Pictures
This is a column chart ppt powerpoint presentation gallery graphics pictures. This is a two stage process. The stages in this process are column chart, finance, planning, analysis, management, growth.
-
Line Chart Ppt PowerPoint Presentation Inspiration Graphics
This is a line chart ppt powerpoint presentation inspiration graphics. This is a two stage process. The stages in this process are line chart, growth, percentage, marketing, analysis, business.
-
Donut Pie Chart Ppt Powerpoint Presentation Pictures Graphics Design
This is a donut pie chart ppt powerpoint presentation pictures graphics design. This is a four stage process. The stages in this process are donut pie chart, business, finance, management, analysis.
-
Column Chart Ppt PowerPoint Presentation Inspiration Graphics Example
This is a column chart ppt powerpoint presentation inspiration graphics example. This is a nine stage process. The stages in this process are column chart, finance, marketing, strategy, analysis, business.


