Graphical chart PowerPoint Presentation Templates and Google Slides
-
Demand Grid Chart For Tracking User Traffic Ppt Ideas Graphics Pictures PDF
Persuade your audience using this demand grid chart for tracking user traffic ppt ideas graphics pictures pdf. This PPT design covers four stages, thus making it a great tool to use. It also caters to a variety of topics including demand grid chart for tracking user traffic. Download this PPT design now to present a convincing pitch that not only emphasizes the topic but also showcases your presentation skills.
-
Hoshin Kanri Strategic Planning System Chart With Annual Goals Ppt PowerPoint Presentation Gallery Graphics Design PDF
This slide illustrates the timeline for executing annual strategic goals and actions to be measured with key performance indicators. Showcasing this set of slides titled hoshin kanri strategic planning system chart with annual goals ppt powerpoint presentation gallery graphics design pdf. The topics addressed in these templates are product design, product development, annual goals. All the content presented in this PPT design is completely editable. Download it and make adjustments in color, background, font etc. as per your unique business setting.
-
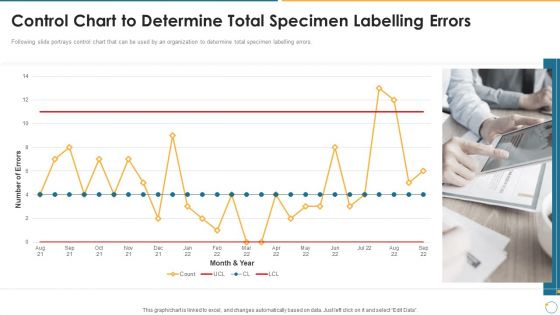
Collection Of Quality Assurance PPT Control Chart To Determine Total Specimen Labelling Graphics PDF
Following slide portrays control chart that can be used by an organization to determine total specimen labelling errors. Deliver an awe inspiring pitch with this creative collection of quality assurance ppt control chart to determine total specimen labelling graphics pdf bundle. Topics like control chart to determine total specimen labelling errors can be discussed with this completely editable template. It is available for immediate download depending on the needs and requirements of the user.
-
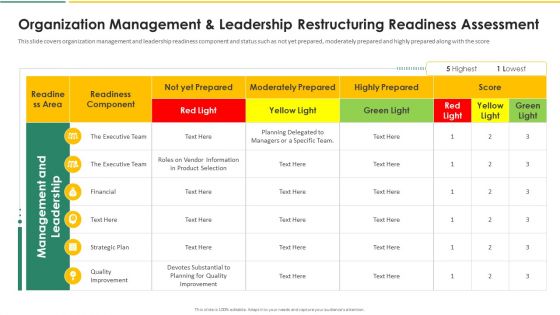
Organization Chart And Corporate Model Transformation Organization Management And Leadership Graphics PDF
This slide covers organization management and leadership readiness component and status such as not yet prepared, moderately prepared and highly prepared along with the score. Deliver an awe inspiring pitch with this creative organization chart and corporate model transformation organization management and leadership graphics pdf bundle. Topics like executive team, financial, strategic plan, quality improvement can be discussed with this completely editable template. It is available for immediate download depending on the needs and requirements of the user.
-
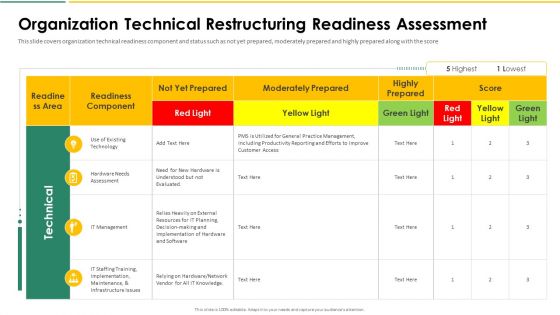
Organization Chart And Corporate Model Transformation Organization Technical Restructuring Graphics PDF
This slide covers organization technical readiness component and status such as not yet prepared, moderately prepared and highly prepared along with the score. Deliver an awe inspiring pitch with this creative organization chart and corporate model transformation organization technical restructuring graphics pdf bundle. Topics like use of existing technology, hardware needs assessment, it management, it staffing training, implementation, maintenance, infrastructure issues can be discussed with this completely editable template. It is available for immediate download depending on the needs and requirements of the user.
-
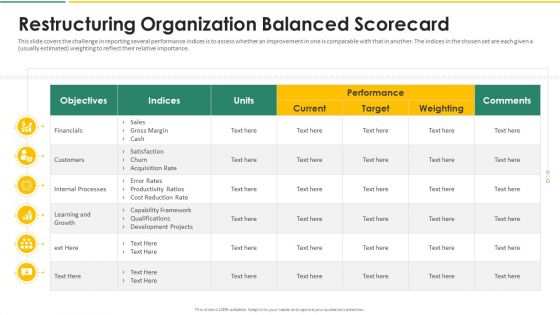
Organization Chart And Corporate Model Transformation Restructuring Organization Graphics PDF
This slide covers the timeline for restructuring the organization in four phases such as diagnose design develop and deliver. Deliver and pitch your topic in the best possible manner with this organization chart and corporate model transformation restructuring organization graphics pdf. Use them to share invaluable insights on diagnose, design, develop, deliver and impress your audience. This template can be altered and modified as per your expectations. So, grab it now.
-
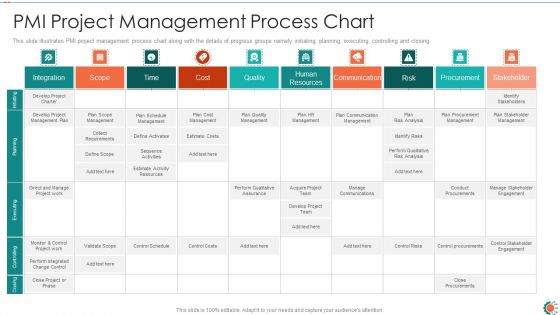
PMI Project Management Process Chart Ppt Infographic Template Graphics Download PDF
This slide illustrates PMI project management process chart along with the details of progress groups namely initiating, planning, executing, controlling and closing. Deliver and pitch your topic in the best possible manner with this pmi project management process chart ppt infographic template graphics download pdf. Use them to share invaluable insights on qualitative, assurance, management and impress your audience. This template can be altered and modified as per your expectations. So, grab it now.
-
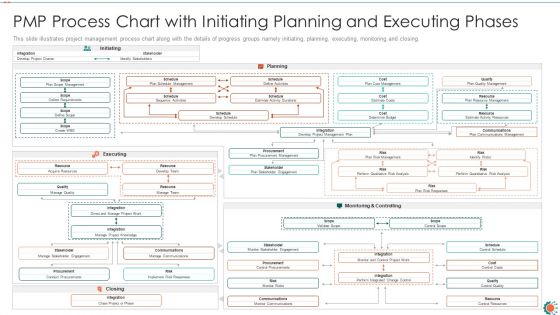
PMP Process Chart With Initiating Planning And Executing Phases Ppt Model Graphics Design PDF
This slide illustrates project management process chart along with the details of progress groups namely initiating, planning, executing, monitoring and closing. Deliver an awe inspiring pitch with this creative pmp procedure chart it poste it notes ppt portfolio guidelines pdf bundle. Topics like pmp process chart with initiating planning and executing phases can be discussed with this completely editable template. It is available for immediate download depending on the needs and requirements of the user.
-
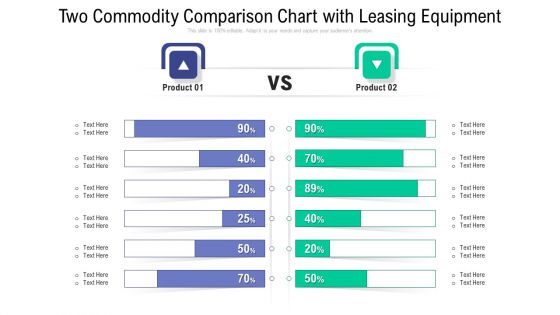
Two Commodity Comparison Chart With Leasing Equipment Graphics PDF
Persuade your audience using this two commodity comparison chart with leasing equipment graphics pdf. This PPT design covers two stages, thus making it a great tool to use. It also caters to a variety of topics including two commodity comparison chart with leasing equipment. Download this PPT design now to present a convincing pitch that not only emphasizes the topic but also showcases your presentation skills.
-
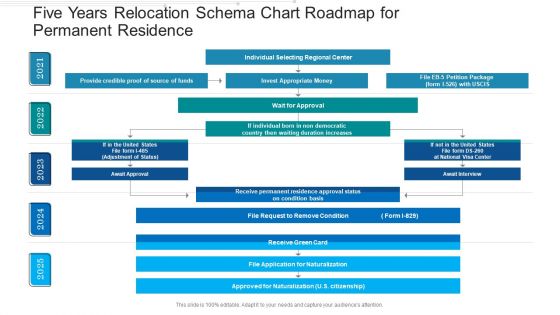
Five Years Relocation Schema Chart Roadmap For Permanent Residence Graphics
Presenting our innovatively structured five years relocation schema chart roadmap for permanent residence graphics Template. Showcase your roadmap process in different formats like PDF, PNG, and JPG by clicking the download button below. This PPT design is available in both Standard Screen and Widescreen aspect ratios. It can also be easily personalized and presented with modified font size, font type, color, and shapes to measure your progress in a clear way.
-
Foreign Relocation Schema Chart Five Years Roadmap Graphics
Introducing our foreign relocation schema chart five years roadmap graphics. This PPT presentation is Google Slides compatible, therefore, you can share it easily with the collaborators for measuring the progress. Also, the presentation is available in both standard screen and widescreen aspect ratios. So edit the template design by modifying the font size, font type, color, and shapes as per your requirements. As this PPT design is fully editable it can be presented in PDF, JPG and PNG formats.
-
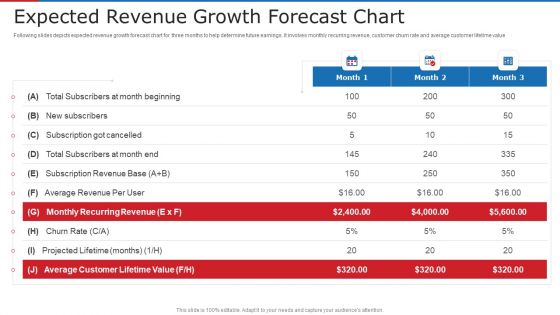
Expected Revenue Growth Forecast Chart Ppt Professional Graphics Tutorials PDF
Following slides depicts expected revenue growth forecast chart for three months to help determine future earnings. It involves monthly recurring revenue, customer churn rate and average customer lifetime value Deliver an awe inspiring pitch with this creative expected revenue growth forecast chart ppt professional graphics tutorials pdf bundle. Topics like average, revenue, rate can be discussed with this completely editable template. It is available for immediate download depending on the needs and requirements of the user.
-
Plan For Project Scoping Management Project Charter Document Graphics PDF
This slide provides the glimpse about the project charter document which is important during the initiation phase of the project management plan. Deliver an awe inspiring pitch with this creative plan for project scoping management project charter document graphics pdf bundle. Topics like teams, portfolio management, target, involvement can be discussed with this completely editable template. It is available for immediate download depending on the needs and requirements of the user.
-
Marketing Playbook To Maximize ROI Different Products Price Comparison Chart Graphics PDF
This slide provides information regarding product price comparison chart that captures information about price per unit, change over list price, reason for proposed price, volumes sold, forecasted growth. This is a marketing playbook to maximize roi different products price comparison chart graphics pdf template with various stages. Focus and dispense information on two stages using this creative set, that comes with editable features. It contains large content boxes to add your information on topics like different products price comparison chart. You can also showcase facts, figures, and other relevant content using this PPT layout. Grab it now.
-
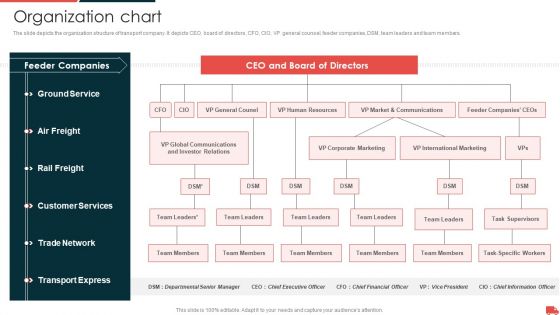
Transportation And Logistics Services Company Profile Organization Chart Graphics PDF
The slide depicts the organization structure of transport company. It depicts CEO, board of directors, CFO, CIO, VP general counsel, feeder companies, DSM, team leaders and team members. Presenting Transportation And Logistics Services Company Profile Organization Chart Graphics PDF to provide visual cues and insights. Share and navigate important information on six stages that need your due attention. This template can be used to pitch topics like Ground Service, Feeder Companies, Customer Services, Trade Network, Transport Express. In addtion, this PPT design contains high resolution images, graphics, etc, that are easily editable and available for immediate download.
-
Business Quality Improvement Chart Icon With Arrow Graphics PDF
Persuade your audience using this Business Quality Improvement Chart Icon With Arrow Graphics PDF This PPT design covers one stage, thus making it a great tool to use. It also caters to a variety of topics including Business Quality, Improvement Chart, Icon With Arrow Download this PPT design now to present a convincing pitch that not only emphasizes the topic but also showcases your presentation skills.
-
Business Restructuring Organization Chart After Restructuring Ppt Infographic Template Graphic Images PDF
This slide is covering organizational chart where chairman is at the top of the hierarchy and the other key board members with sub members. Presenting Business Restructuring Organization Chart After Restructuring Ppt Infographic Template Graphic Images PDF to provide visual cues and insights. Share and navigate important information on eight stages that need your due attention. This template can be used to pitch topics like Board Audit Committee, Board Safety Quality, Recruitment And Remuneration. In addtion, this PPT design contains high resolution images, graphics, etc, that are easily editable and available for immediate download.
-
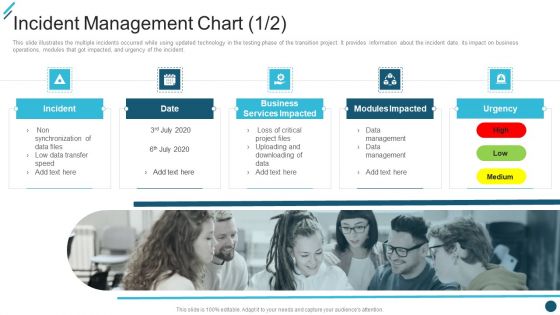
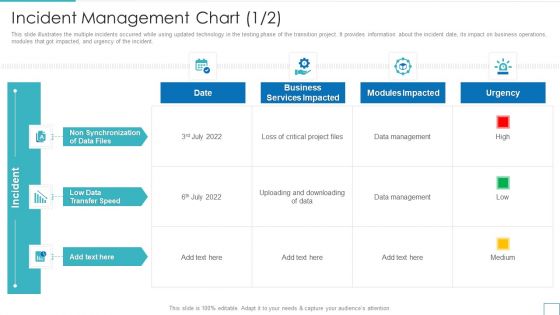
Change Execution Plan Incident Management Chart Ppt PowerPoint Presentation File Graphics Template PDF
This slide illustrates the multiple incidents occurred while using updated technology in the testing phase of the transition project. It provides information about the incident date, its impact on business operations, modules that got impacted, and urgency of the incident. This is a Change Execution Plan Incident Management Chart Ppt PowerPoint Presentation File Graphics Template PDF template with various stages. Focus and dispense information on five stages using this creative set, that comes with editable features. It contains large content boxes to add your information on topics like Business Services Impacted, Modules Impacted Urgency, High Low Medium. You can also showcase facts, figures, and other relevant content using this PPT layout. Grab it now.
-
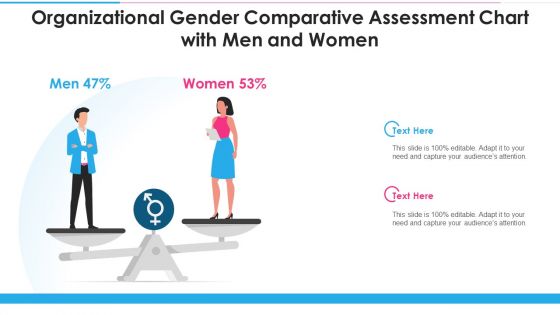
Organizational Gender Comparative Assessment Chart With Men And Women Graphics PDF
Persuade your audience using this organizational gender comparative assessment chart with men and women graphics pdf. This PPT design covers two stages, thus making it a great tool to use. It also caters to a variety of topics including organizational gender comparative assessment chart with men and women. Download this PPT design now to present a convincing pitch that not only emphasizes the topic but also showcases your presentation skills.
-
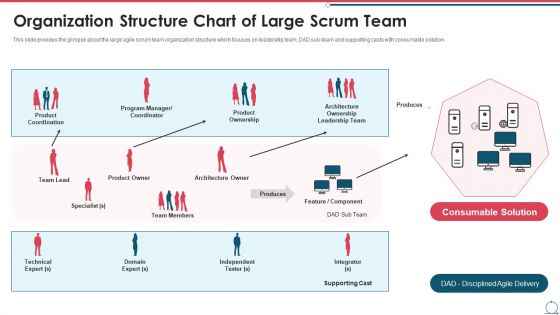
Building An Agile Development Scrum Team Organization Structure Chart Of Large Scrum Team Graphics PDF
This slide provides the glimpse about the large agile scrum team organization structure which focuses on leadership team, DAD sub-team and supporting casts with consumable solution. This is a building an agile development scrum team organization structure chart of large scrum team graphics pdf template with various stages. Focus and dispense information on one stages using this creative set, that comes with editable features. It contains large content boxes to add your information on topics like technical expert, domain expert, independent tester, integrator. You can also showcase facts, figures, and other relevant content using this PPT layout. Grab it now.
-
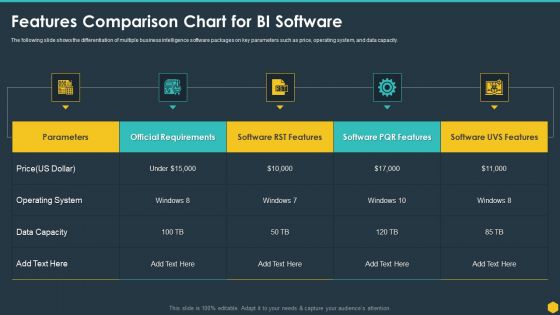
Features Comparison Chart For BI Software BI Transformation Toolset Graphics PDF
The following slide shows the differentiation of multiple business intelligence software packages on key parameters such as price, operating system, and data capacity. Deliver and pitch your topic in the best possible manner with this Features Comparison Chart For BI Software BI Transformation Toolset Graphics PDF. Use them to share invaluable insights on Operating System, Data Capacity, Price, Official Requirements and impress your audience. This template can be altered and modified as per your expectations. So, grab it now.
-
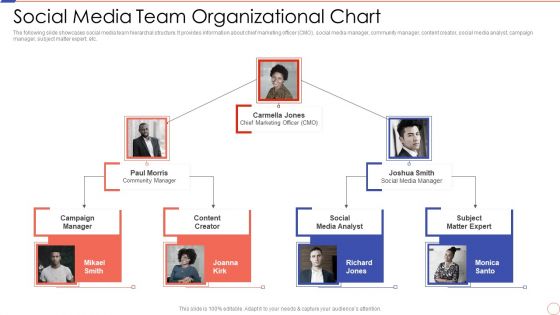
Social Media Engagement To Increase Customer Engagement Social Media Team Organizational Chart Graphics PDF
The following slide showcases social media team hierarchal structure. It provides information about chief marketing officer CMO, social media manager, community manager, content creator, social media analyst, campaign manager, subject matter expert, etc. This is a Social Media Engagement To Increase Customer Engagement Social Media Team Organizational Chart Graphics PDF template with various stages. Focus and dispense information on three stages using this creative set, that comes with editable features. It contains large content boxes to add your information on topics like Social Media Team Organizational Chart. You can also showcase facts, figures, and other relevant content using this PPT layout. Grab it now.
-
Technology Upgradation Action Plan Incident Management Chart Ppt Layouts Graphics PDF
This slide illustrates the multiple incidents occurred while using updated technology in the testing phase of the transition project. It provides information about the incident date, its impact on business operations, modules that got impacted, and urgency of the incident. Deliver and pitch your topic in the best possible manner with this Technology Upgradation Action Plan Incident Management Chart Ppt Layouts Graphics PDF. Use them to share invaluable insights on Business Services Impacted, Modules Impacted, Urgency, High, Low, Medium and impress your audience. This template can be altered and modified as per your expectations. So, grab it now.
-
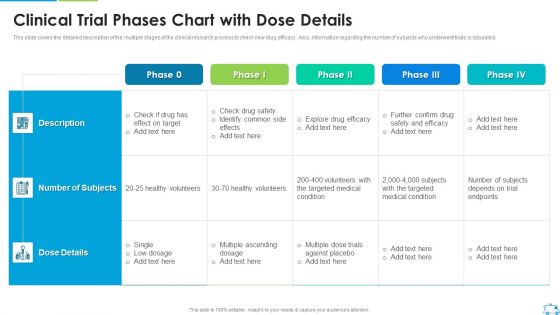
Clinical Trial Phases Chart With Dose Details Graphics PDF
This slide covers the detailed description of the multiple stages of the clinical research process to check new drug efficacy. Also, information regarding the number of subjects who underwent trials is tabulated.Deliver an awe inspiring pitch with this creative Clinical Trial Phases Chart With Dose Details Graphics PDF bundle. Topics like Clinical Trial Phases Chart With Dose Details can be discussed with this completely editable template. It is available for immediate download depending on the needs and requirements of the user.
-
6 Step Brand Development With Analysing Competitors In Round Chart Graphics PDF
Presenting 6 step brand development with analysing competitors in round chart graphics pdf to dispense important information. This template comprises six stages. It also presents valuable insights into the topics including target, awareness, brand growth. This is a completely customizable PowerPoint theme that can be put to use immediately. So, download it and address the topic impactfully.
-
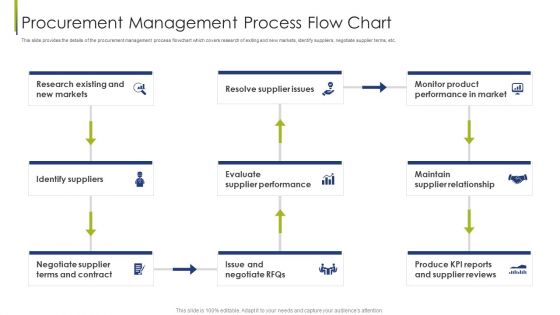
Procurement Management Process Flow Chart Procurement Vendor Ppt Show Graphics Template PDF
This slide provides the details of the procurement management process flowchart which covers research of exiting and new markets, identify suppliers, negotiate supplier terms, etc. This is a procurement management process flow chart procurement vendor ppt show graphics template pdf template with various stages. Focus and dispense information on nine stages using this creative set, that comes with editable features. It contains large content boxes to add your information on topics like resolve supplier issues, supplier performance, terms and contract, supplier reviews. You can also showcase facts, figures, and other relevant content using this PPT layout. Grab it now.
-
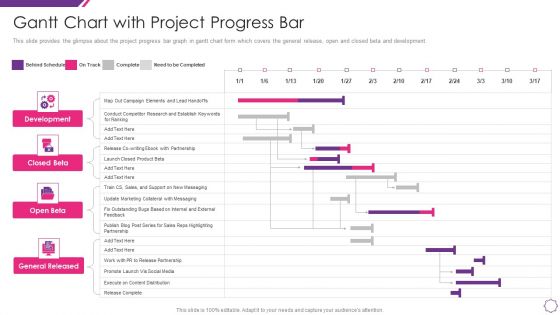
Handle Project Escalations Gantt Chart With Project Progress Bar Ppt Layouts Graphics Design PDF
This slide provides the glimpse about the project progress bar graph in gantt chart form which covers the general release, open and closed beta and development. Introducing our handle project escalations gantt chart with project progress bar ppt layouts graphics design pdf that is designed to showcase some of the vital components that will help you create timelines, roadmaps, and project plans. In addition, also communicate your project durations, milestones, tasks, subtasks, dependencies, and other attributes using this well structured handle project escalations gantt chart with project progress bar ppt layouts graphics design pdf template. You can also exhibit preeminence against time by deploying this easily adaptable slide to your business presentation. Our experts have designed this template in such a way that it is sure to impress your audience. Thus, download it and steer your project meetings, meetups, and conferences.
-
Sales Techniques Playbook Different Products Price Comparison Chart Graphics PDF
This slide provides information regarding product price comparison chart that captures information about price per unit, change over list price, reason for proposed price, volumes sold, forecasted growth. This is a sales techniques playbook different products price comparison chart graphics pdf template with various stages. Focus and dispense information on one stage using this creative set, that comes with editable features. It contains large content boxes to add your information on topics like ensuring effective communication among sales management team You can also showcase facts, figures, and other relevant content using this PPT layout. Grab it now.
-
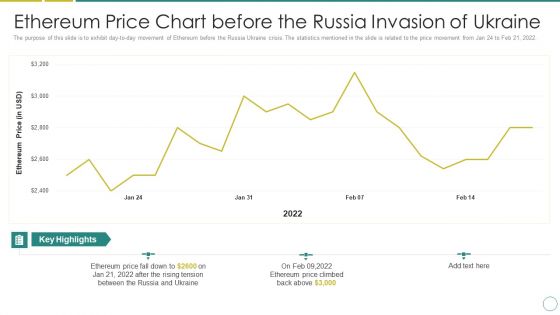
Russia Ukraine Ethereum Price Chart Before The Russia Invasion Of Ukraine Graphics PDF
The purpose of this slide is to exhibit day-to-day movement of Ethereum before the Russia Ukraine crisis. The statistics mentioned in the slide is related to the price movement from Jan 24 to Feb 21, 2022. Deliver an awe inspiring pitch with this creative russia ukraine ethereum price chart before the russia invasion of ukraine graphics pdf bundle. Topics like ethereum price can be discussed with this completely editable template. It is available for immediate download depending on the needs and requirements of the user.
-
Organizational Issue Resolution Tool Organizational Chart With Key People Involved Graphics PDF
This slide presents the organizational structure of the firm with key people involved in managing firm. Presenting Organizational Issue Resolution Tool Organizational Chart With Key People Involved Graphics PDF to provide visual cues and insights. Share and navigate important information on one stage that need your due attention. This template can be used to pitch topics like Finance Manager, President, Marketing, Operations Manager. In addtion, this PPT design contains high resolution images, graphics, etc, that are easily editable and available for immediate download.
-
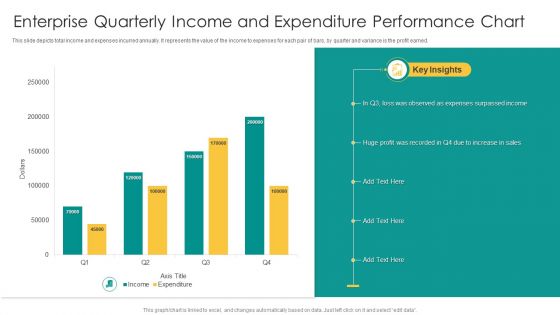
Enterprise Quarterly Income And Expenditure Performance Chart Graphics PDF
This slide depicts total income and expenses incurred annually. It represents the value of the income to expenses for each pair of bars, by quarter and variance is the profit earned. Pitch your topic with ease and precision using this Enterprise Quarterly Income And Expenditure Performance Chart Graphics PDF. This layout presents information on Expenses Surpassed Income, Sales, Huge Profit. It is also available for immediate download and adjustment. So, changes can be made in the color, design, graphics or any other component to create a unique layout.
-
Trend Of Quarterly Funding For Start Up Project Performance Chart Graphics PDF
This slide depicts investment made in different start up projects for 2 years. It also includes the investment amount, funding quarters in graphical form with a trend line and insights. Pitch your topic with ease and precision using this Trend Of Quarterly Funding For Start Up Project Performance Chart Graphics PDF. This layout presents information on Good Management, Efficient Team, Investment Decreased. It is also available for immediate download and adjustment. So, changes can be made in the color, design, graphics or any other component to create a unique layout.
-
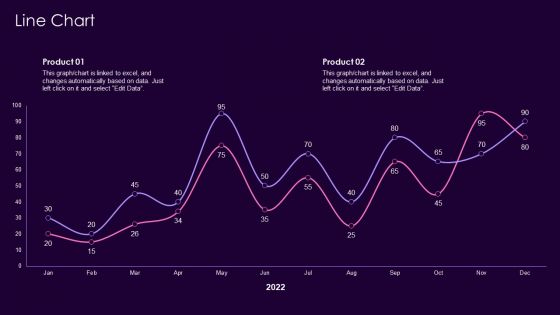
Product Management Techniques Line Chart Ppt Professional Graphics Download PDF
Deliver and pitch your topic in the best possible manner with this Product Management Techniques Line Chart Ppt Professional Graphics Download PDF. Use them to share invaluable insights on Line Chart and impress your audience. This template can be altered and modified as per your expectations. So, grab it now.
-
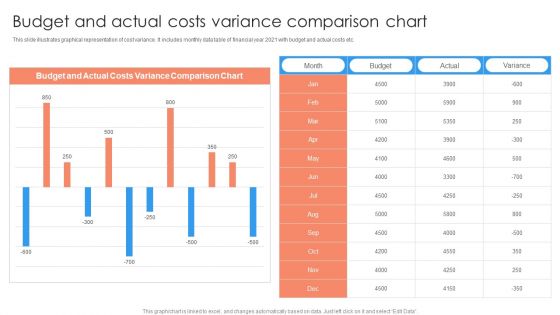
Budget And Actual Costs Variance Comparison Chart Ppt PowerPoint Presentation Show Graphics Example PDF
This slide illustrates graphical representation of cost variance. It includes monthly data table of financial year 2021 with budget and actual costs etc.Showcasing this set of slides titled Budget And Actual Costs Variance Comparison Chart Ppt PowerPoint Presentation Show Graphics Example PDF. The topics addressed in these templates are Budget And Actual, Costs Variance, Comparison Chart. All the content presented in this PPT design is completely editable. Download it and make adjustments in color, background, font etc. as per your unique business setting.
-
Global Automobile Sector Overview Bar Chart Template Graphics PDF
Deliver an awe inspiring pitch with this creative Global Automobile Sector Overview Bar Chart Template Graphics PDF bundle. Topics like Bar Chart Template can be discussed with this completely editable template. It is available for immediate download depending on the needs and requirements of the user.
-
Customizable Circle Charts For Revenue Split Of The Company Graphics PDF
Showcasing this set of slides titled Customizable Circle Charts For Revenue Split Of The Company Graphics PDF The topics addressed in these templates are Customizable Circle, Charts Revenue, Split Company All the content presented in this PPT design is completely editable. Download it and make adjustments in color, background, font etc. as per your unique business setting.
-
Project Transition Plan Escalations Chart Ppt PowerPoint Presentation Gallery Graphics Pictures PDF
This slides list the multiple escalations raised by technology user in the transition project. It also provides details about the escalation priority, expected resolution date, and information about the decision-maker. Deliver an awe inspiring pitch with this creative Project Transition Plan Escalations Chart Ppt PowerPoint Presentation Gallery Graphics Pictures PDF bundle. Topics like Expected Resolution, Data Downloading, Decision Maker can be discussed with this completely editable template. It is available for immediate download depending on the needs and requirements of the user.
-
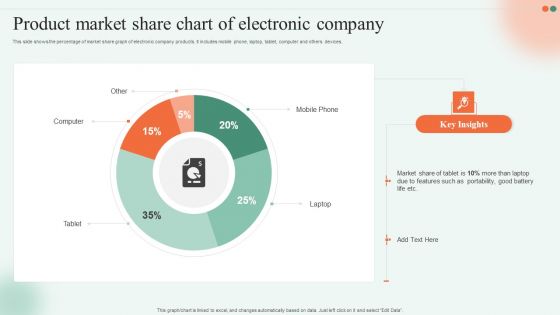
Product Market Share Chart Of Electronic Company Ppt Gallery Graphic Tips PDF
This slide shows the percentage of market share graph of electronic company products. It includes mobile phone, laptop, tablet, computer and others devices. Pitch your topic with ease and precision using this Product Market Share Chart Of Electronic Company Ppt Gallery Graphic Tips PDF. This layout presents information on Mobile Phone, Computer, Laptop, Tablet. It is also available for immediate download and adjustment. So, changes can be made in the color, design, graphics or any other component to create a unique layout.
-
Internal Hiring Handbook Stacked Column Chart Ppt PowerPoint Presentation File Graphics Example PDF
This modern and well-arranged Internal Hiring Handbook Stacked Column Chart Ppt PowerPoint Presentation File Graphics Example PDF provides lots of creative possibilities. It is very simple to customize and edit with the Powerpoint Software. Just drag and drop your pictures into the shapes. All facets of this template can be edited with Powerpoint, no extra software is necessary. Add your own material, put your images in the places assigned for them, adjust the colors, and then you can show your slides to the world, with an animated slide included.
-
Stacked Cloumn Chart Of Sales Split By Products Graphics PDF
Showcasing this set of slides titled Stacked Cloumn Chart Of Sales Split By Products Graphics PDF. The topics addressed in these templates are Sales Split Beverage, Company Products. All the content presented in this PPT design is completely editable. Download it and make adjustments in color, background, font etc. as per your unique business setting.
-
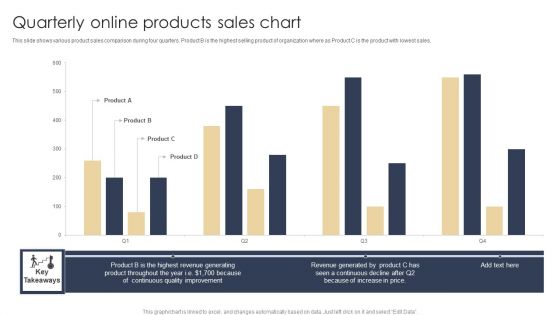
Quarterly Online Products Sales Chart Graphics PDF
This slide shows various product sales comparison during four quarters. Product B is the highest selling product of organization where as Product C is the product with lowest sales. Showcasing this set of slides titled Quarterly Online Products Sales Chart Graphics PDF. The topics addressed in these templates are Revenue Generated, Increase In Price, Quality. All the content presented in this PPT design is completely editable. Download it and make adjustments in color, background, font etc. as per your unique business setting.
-
Strategic Plan For Enterprise Sprint Burndown Chart Representing Team Velocity Graphics PDF
This slide represents the chart to help management to track total work remaining in the software implementation and the likelihood of achieving software implementation goal. It represents significance of sprint burndown chart. Want to ace your presentation in front of a live audience Our Strategic Plan For Enterprise Sprint Burndown Chart Representing Team Velocity Graphics PDF can help you do that by engaging all the users towards you.. Slidegeeks experts have put their efforts and expertise into creating these impeccable powerpoint presentations so that you can communicate your ideas clearly. Moreover, all the templates are customizable, and easy-to-edit and downloadable. Use these for both personal and commercial use.
-
Lead Nurturing Tactics For Lead Generation Column Chart Graphics PDF
Slidegeeks is one of the best resources for PowerPoint templates. You can download easily and regulate Lead Nurturing Tactics For Lead Generation Column Chart Graphics PDF for your personal presentations from our wonderful collection. A few clicks is all it takes to discover and get the most relevant and appropriate templates. Use our Templates to add a unique zing and appeal to your presentation and meetings. All the slides are easy to edit and you can use them even for advertisement purposes.
-
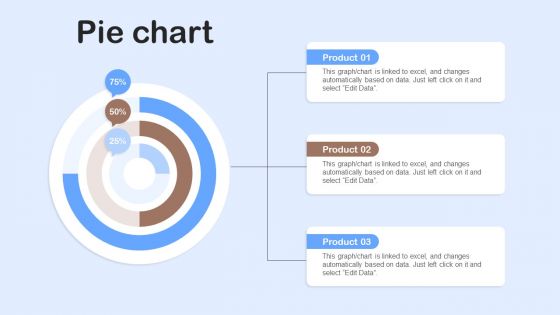
Nestle Performance Management Report Pie Chart Ppt Ideas Graphics Example PDF
This graph or chart is linked to excel, and changes automatically based on data. Just left click on it and select Edit Data. Are you in need of a template that can accommodate all of your creative concepts This one is crafted professionally and can be altered to fit any style. Use it with Google Slides or PowerPoint. Include striking photographs, symbols, depictions, and other visuals. Fill, move around, or remove text boxes as desired. Test out color palettes and font mixtures. Edit and save your work, or work with colleagues. Download Nestle Performance Management Report Pie Chart Ppt Ideas Graphics Example PDF and observe how to make your presentation outstanding. Give an impeccable presentation to your group and make your presentation unforgettable.
-
Pie Chart Showing Current Production Efficiencies Graphics PDF
Make sure to capture your audiences attention in your business displays with our gratis customizable Pie Chart Showing Current Production Efficiencies Graphics PDF. These are great for business strategies, office conferences, capital raising or task suggestions. If you desire to acquire more customers for your tech business and ensure they stay satisfied, create your own sales presentation with these plain slides.
-
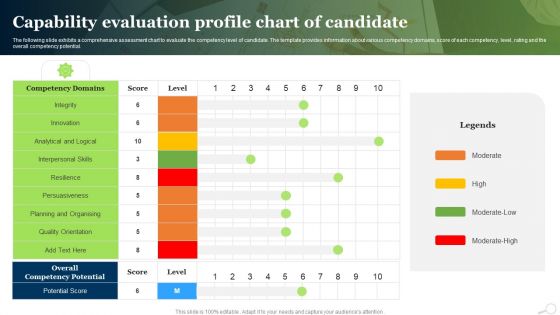
Capability Evaluation Profile Chart Of Candidate Ppt PowerPoint Presentation Slides Graphics Example PDF
The following slide exhibits a comprehensive assessment chart to evaluate the competency level of candidate. The template provides information about various competency domains, score of each competency, level, rating and the overall competency potential.Showcasing this set of slides titled Capability Evaluation Profile Chart Of Candidate Ppt PowerPoint Presentation Slides Graphics Example PDF. The topics addressed in these templates are Persuasiveness, Interpersonal Skills, Analytical Logical. All the content presented in this PPT design is completely editable. Download it and make adjustments in color, background, font etc. as per your unique business setting.
-
5 Years Profit And Loss Comparative Analysis Chart Of Enterprise Ppt Icon Graphics PDF
This slide represents the comparison of profit and loss of an organization for the five years. It includes details related to profit and loss from various accounts such as order fees, concession income, facility rental etc. Pitch your topic with ease and precision using this 5 Years Profit And Loss Comparative Analysis Chart Of Enterprise Ppt Icon Graphics PDF. This layout presents information on Account, 2018 To 2022, Exchange Fees. It is also available for immediate download and adjustment. So, changes can be made in the color, design, graphics or any other component to create a unique layout.
-
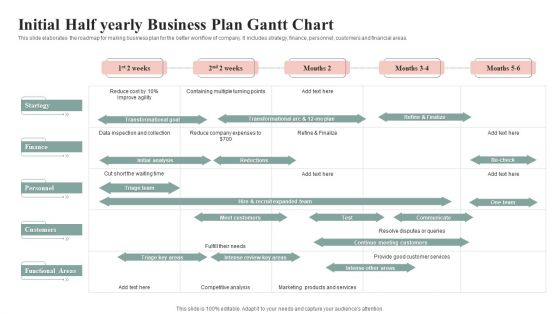
Initial Half Yearly Business Plan Gantt Chart Graphics PDF
This slide elaborates the roadmap for making business plan for the better workflow of company. It includes strategy, finance, personnel, customers and financial areas. Pitch your topic with ease and precision using this Initial Half Yearly Business Plan Gantt Chart Graphics PDF. This layout presents information on Finance, Startegy, Customers. It is also available for immediate download and adjustment. So, changes can be made in the color, design, graphics or any other component to create a unique layout.
-
Transportation Company Profile Organization Chart Ppt PowerPoint Presentation Styles Graphics Tutorials PDF
This is a Transportation Company Profile Organization Chart Ppt PowerPoint Presentation Styles Graphics Tutorials PDF template with various stages. Focus and dispense information on one stage using this creative set, that comes with editable features. It contains large content boxes to add your information on topics like Customer Services, Global Communications, Transport Express. You can also showcase facts, figures, and other relevant content using this PPT layout. Grab it now.
-
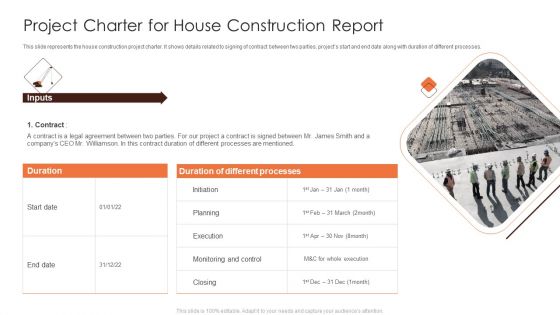
Project Charter For House Construction Report Graphics PDF
This slide represents the house construction project charter. It shows details related to signing of contract between two parties, projects start and end date along with duration of different processes. Pitch your topic with ease and precision using this Project Charter For House Construction Report Graphics PDF. This layout presents information on Planning, Execution, Project Charter. It is also available for immediate download and adjustment. So, changes can be made in the color, design, graphics or any other component to create a unique layout.
-
Decision Making Flow Chart Icon With Arrows Ppt Layouts Graphics Design PDF
Persuade your audience using this Decision Making Flow Chart Icon With Arrows Ppt Layouts Graphics Design PDF. This PPT design covers four stages, thus making it a great tool to use. It also caters to a variety of topics including Decision Making, Flow Chart, Icon With Arrows. Download this PPT design now to present a convincing pitch that not only emphasizes the topic but also showcases your presentation skills.
-
Data Flow Charts For Social Media Application Icon Graphics PDF
Persuade your audience using this Data Flow Charts For Social Media Application Icon Graphics PDF. This PPT design covers three stages, thus making it a great tool to use. It also caters to a variety of topics including Data Flow Charts, Social Media Application, Icon. Download this PPT design now to present a convincing pitch that not only emphasizes the topic but also showcases your presentation skills.
-
Weekly KPI Attain Production Goals And Objectives Chart Ppt Icon Graphics Template PDF
This slide showcases the manufacturing target achievement table. It can be used for evaluating the variance between actual and estimated KPIs such as throughput rate, inventory turns, scarp rate, etc. Showcasing this set of slides titled Weekly KPI Attain Production Goals And Objectives Chart Ppt Icon Graphics Template PDF. The topics addressed in these templates are Target, KPI, Inventory Turns. All the content presented in this PPT design is completely editable. Download it and make adjustments in color, background, font etc. as per your unique business setting.
-
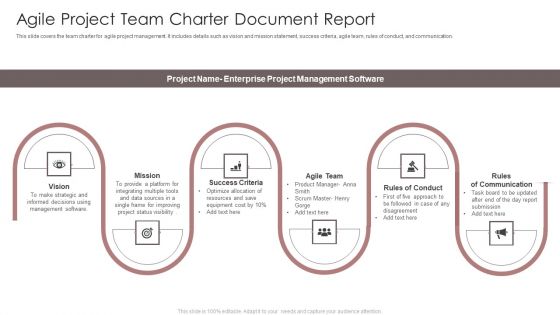
Agile Project Team Charter Document Report Ppt File Graphics Design PDF
This slide covers the team charter for agile project management. It includes details such as vision and mission statement, success criteria, agile team, rules of conduct, and communication. Presenting Agile Project Team Charter Document Report Ppt File Graphics Design PDF to dispense important information. This template comprises six stages. It also presents valuable insights into the topics including Vision, Mission, Success Criteria, Agile Team. This is a completely customizable PowerPoint theme that can be put to use immediately. So, download it and address the topic impactfully.
-
Workplace Facility Management Services Company Facilities Management Functional Organizational Chart Graphics PDF
This slide highlights the functional organizational chart of facilities management company which includes facilities operations, utilities operations, planning and design, custodial services and waste management operations department. From laying roadmaps to briefing everything in detail, our templates are perfect for you. You can set the stage with your presentation slides. All you have to do is download these easy to edit and customizable templates. Workplace Facility Management Services Company Facilities Management Functional Organizational Chart Graphics PDF will help you deliver an outstanding performance that everyone would remember and praise you for. Do download this presentation today.
-
Workplace Facility Management Services Company Workplace Facility Management Services Company Chart Graphics PDF
If your project calls for a presentation, then Slidegeeks is your go to partner because we have professionally designed, easy to edit templates that are perfect for any presentation. After downloading, you can easily edit Workplace Facility Management Services Company Workplace Facility Management Services Company Chart Graphics PDF and make the changes accordingly. You can rearrange slides or fill them with different images. Check out all the handy templates.
-
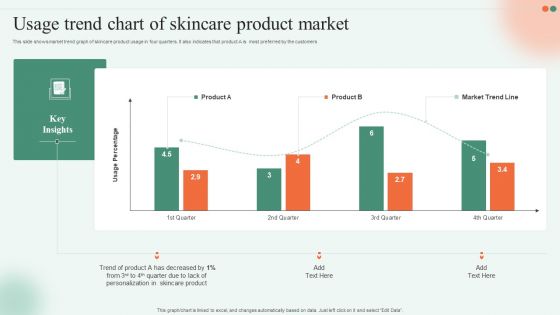
Usage Trend Chart Of Skincare Product Market Ppt Slides Graphics Download PDF
This slide shows market trend graph of skincare product usage in four quarters. It also indicates that product A is most preferred by the customers. Pitch your topic with ease and precision using this Usage Trend Chart Of Skincare Product Market Ppt Slides Graphics Download PDF. This layout presents information on Trend Product, Skincare Product, Quarter Due. It is also available for immediate download and adjustment. So, changes can be made in the color, design, graphics or any other component to create a unique layout.
-
Creating Project Charter For Managing Tasks Strategies To Enhance Project Lifecycle Graphics PDF
This slide covers the project charter which focuses on title, manager, sponsor of project with business need, risk and issues, assumptions and deliverables, financials, milestones schedule, reviewing committee, project team, etc.Slidegeeks has constructed Creating Project Charter For Managing Tasks Strategies To Enhance Project Lifecycle Graphics PDF after conducting extensive research and examination. These presentation templates are constantly being generated and modified based on user preferences and critiques from editors. Here, you will find the most attractive templates for a range of purposes while taking into account ratings and remarks from users regarding the content. This is an excellent jumping-off point to explore our content and will give new users an insight into our top-notch PowerPoint Templates.
-
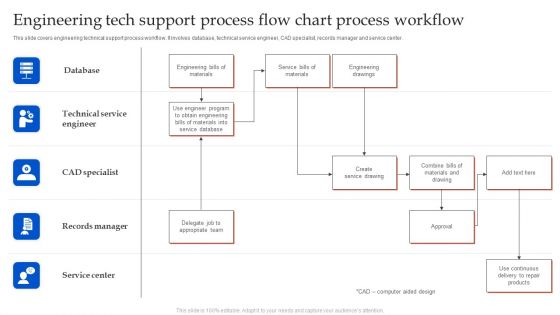
Engineering Tech Support Process Flow Chart Process Workflow Graphics PDF
This slide covers engineering technical support process workflow. It involves database, technical service engineer, CAD specialist, records manager and service center. Presenting Engineering Tech Support Process Flow Chart Process Workflow Graphics PDF to dispense important information. This template comprises five stages. It also presents valuable insights into the topics including Database, CAD Specialist, Records Manager. This is a completely customizable PowerPoint theme that can be put to use immediately. So, download it and address the topic impactfully.
-
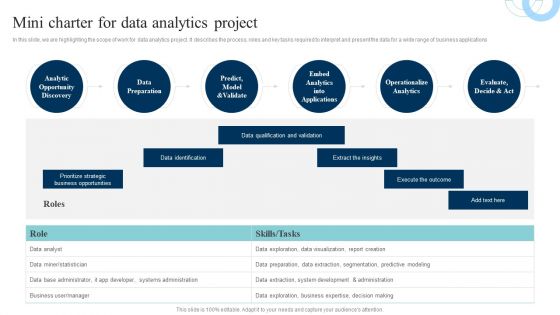
Data Evaluation And Processing Toolkit Mini Charter For Data Analytics Project Graphics PDF
In this slide, we are highlighting the scope of work for data analytics project. It describes the process, roles and key tasks required to interpret and present the data for a wide range of business applications. Do you have to make sure that everyone on your team knows about any specific topic I yes, then you should give Data Evaluation And Processing Toolkit Mini Charter For Data Analytics Project Graphics PDF a try. Our experts have put a lot of knowledge and effort into creating this impeccable Data Evaluation And Processing Toolkit Mini Charter For Data Analytics Project Graphics PDF. You can use this template for your upcoming presentations, as the slides are perfect to represent even the tiniest detail. You can download these templates from the Slidegeeks website and these are easy to edit. So grab these today.


