Graph shows PowerPoint Presentation Templates and Google Slides
-
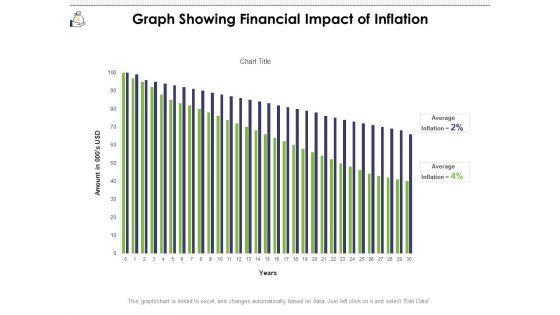
Graph Showing Financial Impact Of Inflation Ppt PowerPoint Presentation File Graphics Tutorials PDF
Presenting this set of slides with name graph showing financial impact of inflation ppt powerpoint presentation file graphics tutorials pdf. The topics discussed in these slide is graph showing financial impact of inflation. This is a completely editable PowerPoint presentation and is available for immediate download. Download now and impress your audience.
-
Financial Strategy Icon Showing Pie Graph Ppt PowerPoint Presentation Icon Picture PDF
Presenting this set of slides with name financial strategy icon showing pie graph ppt powerpoint presentation icon picture pdf. The topics discussed in these slide is financial strategy icon showing pie graph. This is a completely editable PowerPoint presentation and is available for immediate download. Download now and impress your audience.
-
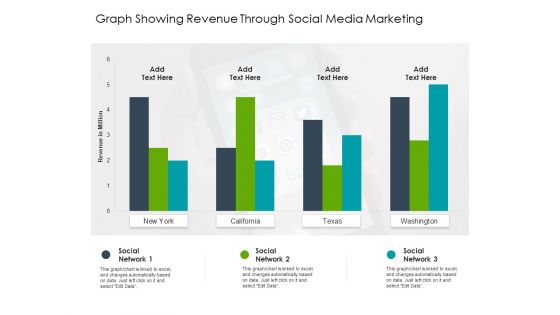
Graph Showing Revenue Through Social Media Marketing Ppt PowerPoint Presentation Gallery Professional PDF
Presenting this set of slides with name graph showing revenue through social media marketing ppt powerpoint presentation gallery professional pdf. The topics discussed in these slide is graph showing revenue through social media marketing. This is a completely editable PowerPoint presentation and is available for immediate download. Download now and impress your audience.
-
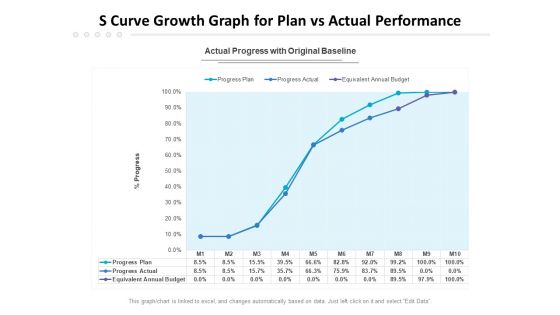
S Curve Growth Graph For Plan Vs Actual Performance Ppt PowerPoint Presentation Show Layouts PDF
Presenting this set of slides with name s curve growth graph for plan vs actual performance ppt powerpoint presentation show layouts pdf. The topics discussed in these slides are progress plan, progress actual, equivalent annual budget. This is a completely editable PowerPoint presentation and is available for immediate download. Download now and impress your audience.
-
Bar Graph Showing Growth In Money Flow Ppt PowerPoint Presentation File Show PDF
Presenting this set of slides with name bar graph showing growth in money flow ppt powerpoint presentation file show pdf. This is a three stage process. The stages in this process are bar graph showing growth in money flow. This is a completely editable PowerPoint presentation and is available for immediate download. Download now and impress your audience.
-
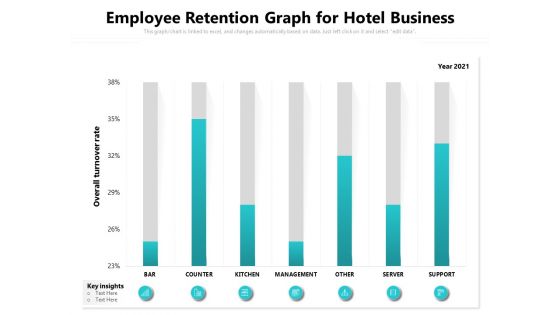
Employee Retention Graph For Hotel Business Ppt PowerPoint Presentation Show Skills PDF
Presenting this set of slides with name employee retention graph for hotel business ppt powerpoint presentation show skills pdf. The topics discussed in these slides are bar, counter, kitchen, management, other, server, support. This is a completely editable PowerPoint presentation and is available for immediate download. Download now and impress your audience.
-
Graph Showing Sales Team Annual Employee Turnover Analysis Ppt PowerPoint Presentation Ideas PDF
Presenting this set of slides with name graph showing sales team annual employee turnover analysis ppt powerpoint presentation ideas pdf. The topics discussed in these slides are sales department, turnover rate, percentage, key insights, 2020. This is a completely editable PowerPoint presentation and is available for immediate download. Download now and impress your audience.
-
Burndown Graph With Remaining And Completed Tasks Ppt PowerPoint Presentation Icon Show PDF
Presenting this set of slides with name burndown graph with remaining and completed tasks ppt powerpoint presentation icon show pdf. The topics discussed in these slides are task completed, efforts remained, ideal burndown, task remained. This is a completely editable PowerPoint presentation and is available for immediate download. Download now and impress your audience.
-
Financial Gain Shown By Bar Graph Vector Icon Ppt PowerPoint Presentation File Diagrams PDF
Presenting this set of slides with name financial gain shown by bar graph vector icon ppt powerpoint presentation file diagrams pdf. This is a three stage process. The stages in this process are financial gain shown by bar graph vector icon. This is a completely editable PowerPoint presentation and is available for immediate download. Download now and impress your audience.
-
Magnifying Glass Bar Graph Showing Business Statistical Analysis Ppt PowerPoint Presentation File Sample PDF
Presenting this set of slides with name magnifying glass bar graph showing business statistical analysis ppt powerpoint presentation file sample pdf. This is a three stage process. The stages in this process are magnifying glass bar graph showing business statistical analysis. This is a completely editable PowerPoint presentation and is available for immediate download. Download now and impress your audience.
-
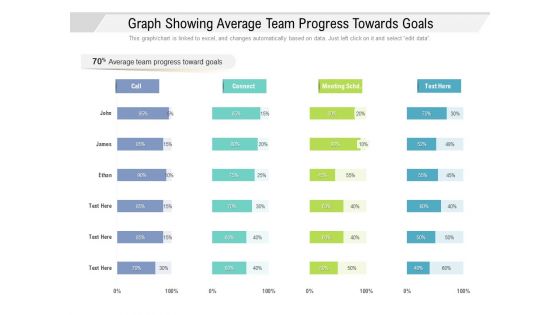
Graph Showing Average Team Progress Towards Goals Ppt PowerPoint Presentation Slides Picture PDF
Presenting this set of slides with name graph showing average team progress towards goals ppt powerpoint presentation slides picture pdf. The topics discussed in these slide is graph showing average team progress towards goals. This is a completely editable PowerPoint presentation and is available for immediate download. Download now and impress your audience.
-
Bar Graph Showing License Users Of Three Countries Ppt PowerPoint Presentation Outline Guide PDF
Presenting this set of slides with name bar graph showing license users of three countries ppt powerpoint presentation outline guide pdf. The topics discussed in these slides are 2017 to 2020. This is a completely editable PowerPoint presentation and is available for immediate download. Download now and impress your audience.
-
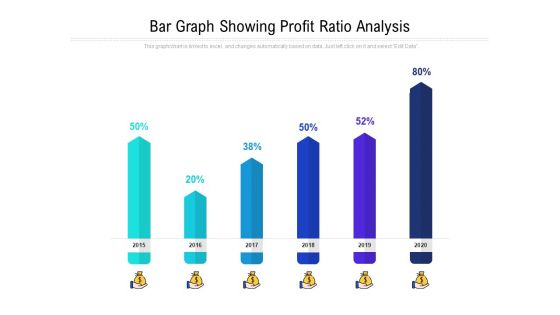
Bar Graph Showing Profit Ratio Analysis Ppt PowerPoint Presentation Styles Brochure PDF
Presenting this set of slides with name bar graph showing profit ratio analysis ppt powerpoint presentation styles brochure pdf. The topics discussed in these slides are 2015 to 2020. This is a completely editable PowerPoint presentation and is available for immediate download. Download now and impress your audience.
-
Bar Graph Showing Sales Cost And Profit Analysis Ppt PowerPoint Presentation Infographics Images PDF
Presenting this set of slides with name bar graph showing sales cost and profit analysis ppt powerpoint presentation infographics images pdf. The topics discussed in these slides are sales, cost, roi, profit. This is a completely editable PowerPoint presentation and is available for immediate download. Download now and impress your audience.
-
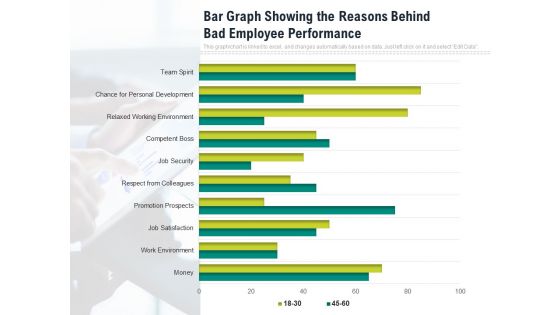
Bar Graph Showing The Reasons Behind Bad Employee Performance Ppt PowerPoint Presentation Slides Tips PDF
Presenting this set of slides with name bar graph showing the reasons behind bad employee performance ppt powerpoint presentation slides tips pdf. The topics discussed in these slides are work environment, job satisfaction, promotion prospects, respect from colleagues, job security, competent boss, relaxed working environment. This is a completely editable PowerPoint presentation and is available for immediate download. Download now and impress your audience.
-
Bar Graph With Clock Vector Icon Ppt PowerPoint Presentation Show Structure PDF
Presenting this set of slides with name bar graph with clock vector icon ppt powerpoint presentation show structure pdf. This is a three stage process. The stages in this process are bar graph with clock vector icon. This is a completely editable PowerPoint presentation and is available for immediate download. Download now and impress your audience.
-
Business Performance Improvement Graph Vector Icon Ppt PowerPoint Presentation File Show PDF
Presenting this set of slides with name business performance improvement graph vector icon ppt powerpoint presentation file show pdf. This is a three stage process. The stages in this process are business performance improvement graph vector icon. This is a completely editable PowerPoint presentation and is available for immediate download. Download now and impress your audience.
-
Values Promised By Company Graphs And Charts Ppt Show Model PDF
Presenting this set of slides with name values promised by company graphs and charts ppt show model pdf. The topics discussed in these slides are graphs and charts. This is a completely editable PowerPoint presentation and is available for immediate download. Download now and impress your audience.
-
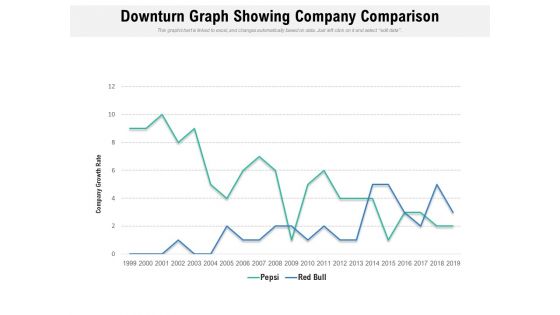
Downturn Graph Showing Company Comparison Ppt PowerPoint Presentation Professional Graphics Design PDF
Pitch your topic with ease and precision using this downturn graph showing company comparison ppt powerpoint presentation professional graphics design pdf. This layout presents information on company growth rate, red bull, pepsi. It is also available for immediate download and adjustment. So, changes can be made in the color, design, graphics or any other component to create a unique layout.
-
Downturn Graph Showing Decrease In Income Over The Years Ppt PowerPoint Presentation Icon File Formats PDF
Showcasing this set of slides titled downturn graph showing decrease in income over the years ppt powerpoint presentation icon file formats pdf. The topics addressed in these templates are middle class share of total income, middle class share of income, union membership rate, 2013 to 2020. All the content presented in this PPT design is completely editable. Download it and make adjustments in color, background, font etc. as per your unique business setting.
-
Graphs Showing Of Task Tracking Report Ppt PowerPoint Presentation Slides Example Introduction PDF
Showcasing this set of slides titled graphs showing of task tracking report ppt powerpoint presentation slides example introduction pdf. The topics addressed in these templates are progress, project not stared yet, complete task, on progress, pending task. All the content presented in this PPT design is completely editable. Download it and make adjustments in color, background, font etc. as per your unique business setting.
-
Sales Analysis Bar Graph Real Estate Ppt PowerPoint Presentation Infographic Template Show PDF
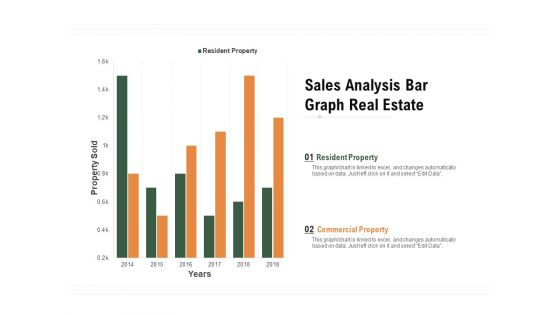
Pitch your topic with ease and precision using this sales analysis bar graph real estate ppt powerpoint presentation infographic template show pdf. This layout presents information on resident property, commercial property, property sold, 2014 to 2018. It is also available for immediate download and adjustment. So, changes can be made in the color, design, graphics or any other component to create a unique layout.
-
Graph Showing Compound Annual Growth Rate Ppt PowerPoint Presentation Inspiration Slide Download PDF
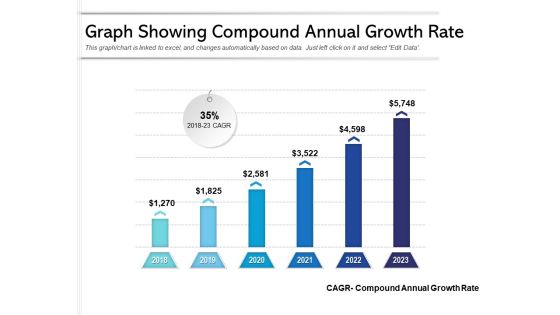
Pitch your topic with ease and precision using this primary data analysis, secondary data analysis, tertiary data analysis. This layout presents information on cagr compound annual growth rate, 2018 to 2023. It is also available for immediate download and adjustment. So, changes can be made in the color, design, graphics or any other component to create a unique layout.
-
Graph Showing Career Growth Of Company Employee Ppt PowerPoint Presentation Gallery Guide PDF
Showcasing this set of slides titled graph showing career growth of company employee ppt powerpoint presentation gallery guide pdf. The topics addressed in these templates are market, promotion, analyst. All the content presented in this PPT design is completely editable. Download it and make adjustments in color, background, font etc. as per your unique business setting.
-
Vector Showing Career Growth Graph Of Businessman Ppt PowerPoint Presentation File Background Designs PDF
Presenting vector showing career growth graph of businessman ppt powerpoint presentation file background designs pdf to dispense important information. This template comprises three stages. It also presents valuable insights into the topics including vector showing career growth graph of businessman. This is a completely customizable PowerPoint theme that can be put to use immediately. So, download it and address the topic impactfully.
-
Graph Showing Reduction In Product Sales Ppt PowerPoint Presentation Infographic Template Graphics Design PDF
Pitch your topic with ease and precision using this graph showing reduction in product sales ppt powerpoint presentation infographic template graphics design pdf. This layout presents information on graph showing reduction in product sales, 2015 to 2020. It is also available for immediate download and adjustment. So, changes can be made in the color, design, graphics or any other component to create a unique layout.
-
Bar Graph Showing Goal Attainment Over Time Ppt PowerPoint Presentation Gallery Demonstration PDF
Showcasing this set of slides titled bar graph showing goal attainment over time ppt powerpoint presentation gallery demonstration pdf. The topics addressed in these templates are bar graph showing goal attainment over time. All the content presented in this PPT design is completely editable. Download it and make adjustments in color, background, font etc. as per your unique business setting.
-
Bar Graph Showing Income Of Business Segments Ppt PowerPoint Presentation Icon Example PDF
Pitch your topic with ease and precision using this bar graph showing income of business segments ppt powerpoint presentation icon example pdf. This layout presents information on bar graph showing income of business segments. It is also available for immediate download and adjustment. So, changes can be made in the color, design, graphics or any other component to create a unique layout.
-
Bar Graph Showing Product Sales Strategy Ppt PowerPoint Presentation File Samples PDF
Showcasing this set of slides titled bar graph showing product sales strategy ppt powerpoint presentation file samples pdf. The topics addressed in these templates are bar graph showing product sales strategy. All the content presented in this PPT design is completely editable. Download it and make adjustments in color, background, font etc. as per your unique business setting.
-
Business Market Share By Country Through Bar Graph Ppt PowerPoint Presentation Gallery Show PDF
Showcasing this set of slides titled business market share by country through bar graph ppt powerpoint presentation gallery show pdf. The topics addressed in these templates are business market share by country through bar graph. All the content presented in this PPT design is completely editable. Download it and make adjustments in color, background, font etc. as per your unique business setting.
-
Good Financial Position Shown With Graph Ppt PowerPoint Presentation Model Elements PDF
Presenting good financial position shown with graph ppt powerpoint presentation model elements pdf to dispense important information. This template comprises two stages. It also presents valuable insights into the topics including good financial position shown with graph. This is a completely customizable PowerPoint theme that can be put to use immediately. So, download it and address the topic impactfully.
-
Software Development Effort Estimation Graph Ppt PowerPoint Presentation Styles Show PDF
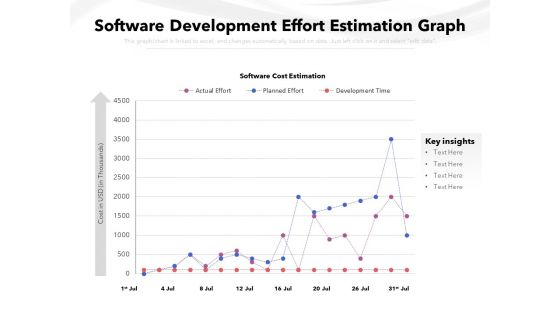
Showcasing this set of slides titled software development effort estimation graph ppt powerpoint presentation styles show pdf. The topics addressed in these templates are key insights, cost, software cost estimation, actual effort, planned effort, development time. All the content presented in this PPT design is completely editable. Download it and make adjustments in color, background, font etc. as per your unique business setting.
-
Sprint Burndown Graph With Completed Tasks Ppt PowerPoint Presentation Show Styles PDF
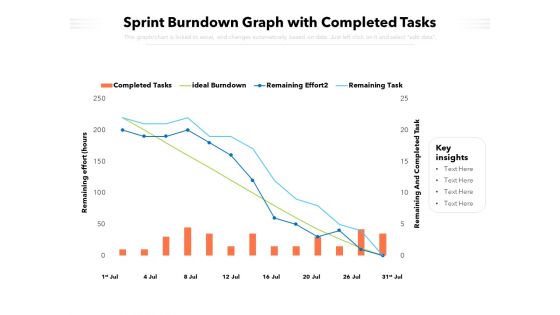
Pitch your topic with ease and precision using this sprint burndown graph with completed tasks ppt powerpoint presentation show styles pdf. This layout presents information on completed tasks, ideal burndown, remaining effort2, remaining task. It is also available for immediate download and adjustment. So, changes can be made in the color, design, graphics or any other component to create a unique layout.
-
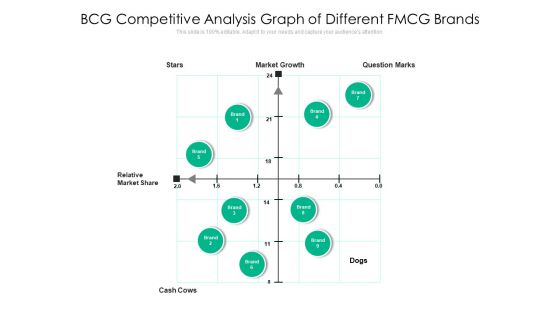
BCG Competitive Analysis Graph Of Different FMCG Brands Ppt PowerPoint Presentation Gallery Show PDF
Presenting bcg competitive analysis graph of different fmcg brands ppt powerpoint presentation gallery show pdf to dispense important information. This template comprises nine stages. It also presents valuable insights into the topics including market, growth, cash cows. This is a completely customizable PowerPoint theme that can be put to use immediately. So, download it and address the topic impactfully.
-
Statistics Analysis Graph Vector Icon Ppt PowerPoint Presentation Professional Show PDF
Showcasing this set of slides titled statistics analysis graph vector icon ppt powerpoint presentation professional show pdf. The topics addressed in these templates are statistics analysis graph vector icon. All the content presented in this PPT design is completely editable. Download it and make adjustments in color, background, font etc. as per your unique business setting.
-
Bar Graph Showing Future Sales Vector Icon Ppt PowerPoint Presentation File Master Slide PDF
Presenting bar graph showing future sales vector icon ppt powerpoint presentation file master slide pdf to dispense important information. This template comprises three stages. It also presents valuable insights into the topics including bar graph showing future sales vector icon. This is a completely customizable PowerPoint theme that can be put to use immediately. So, download it and address the topic impactfully.
-
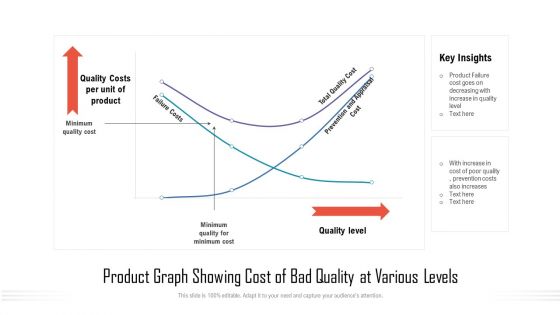
Product Graph Showing Cost Of Bad Quality At Various Levels Ppt PowerPoint Styles Model PDF
Pitch your topic with ease and precision using this product graph showing cost of bad quality at various levels ppt powerpoint styles model pdf. This layout presents information on minimum quality cost, minimum quality for minimum cost, total quality cost. It is also available for immediate download and adjustment. So, changes can be made in the color, design, graphics or any other component to create a unique layout.
-
Bar Graph Showing New Business Launch Ppt PowerPoint Presentation File Clipart PDF
Presenting bar graph showing new business launch ppt powerpoint presentation file clipart pdf to dispense important information. This template comprises three stages. It also presents valuable insights into the topics including bar graph showing new business launch. This is a completely customizable PowerPoint theme that can be put to use immediately. So, download it and address the topic impactfully.
-
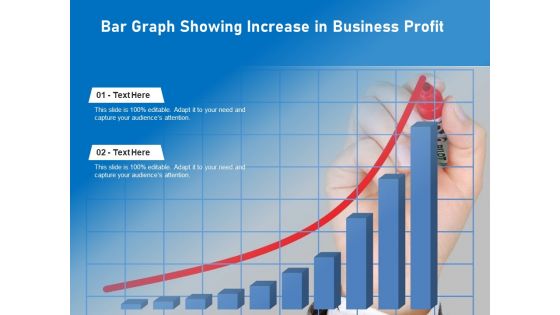
Bar Graph Showing Increase In Business Profit Ppt PowerPoint Presentation Infographic Template Show PDF
Persuade your audience using this bar graph showing increase in business profit ppt powerpoint presentation infographic template show pdf. This PPT design covers two stages, thus making it a great tool to use. It also caters to a variety of topics including bar graph showing increase in business profit. Download this PPT design now to present a convincing pitch that not only emphasizes the topic but also showcases your presentation skills.
-
Graph Showing Increase In Share Value Ppt PowerPoint Presentation Backgrounds PDF
Presenting graph showing increase in share value ppt powerpoint presentation backgrounds pdf to dispense important information. This template comprises two stages. It also presents valuable insights into the topics including graph showing increase in share value. This is a completely customizable PowerPoint theme that can be put to use immediately. So, download it and address the topic impactfully.
-
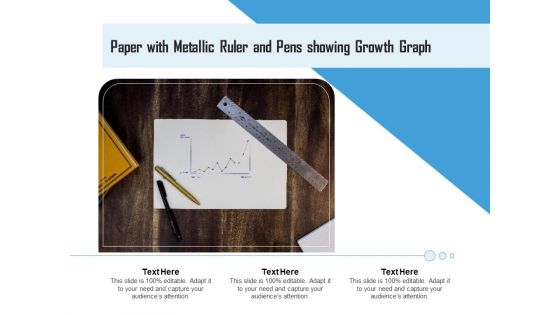
Paper With Metallic Ruler And Pens Showing Growth Graph Ppt PowerPoint Presentation Professional Shapes PDF
Persuade your audience using this paper with metallic ruler and pens showing growth graph ppt powerpoint presentation professional shapes pdf. This PPT design covers one stages, thus making it a great tool to use. It also caters to a variety of topics including paper with metallic ruler and pens showing growth graph. Download this PPT design now to present a convincing pitch that not only emphasizes the topic but also showcases your presentation skills.
-
Bar Graph Showing Revenues Generated By Sales Department Ppt Portfolio Graphics Example PDF
This graph or chart is linked to excel, and changes automatically based on data. Just left click on it and select edit data. Showcasing this set of slides titled bar graph showing revenues generated by sales department ppt portfolio graphics example pdf. The topics addressed in these templates are yearly sales revenues, sales team, profits. All the content presented in this PPT design is completely editable. Download it and make adjustments in color, background, font etc. as per your unique business setting.
-
Bar Graph Showing Net Changes In Cash Flow Ppt PowerPoint Presentation Gallery Clipart Images PDF
Showcasing this set of slides titled bar graph showing net changes in cash flow ppt powerpoint presentation gallery clipart images pdf. The topics addressed in these templates are bar graph showing net changes in cash flow. All the content presented in this PPT design is completely editable. Download it and make adjustments in color, background, font etc. as per your unique business setting.
-
Business Targets Achievement Shown Through Sales Growth Graph Ppt PowerPoint Presentation Gallery Elements PDF
Pitch your topic with ease and precision using this business targets achievement shown through sales growth graph ppt powerpoint presentation gallery elements pdf. This layout presents information on business targets achievement shown through sales growth graph. It is also available for immediate download and adjustment. So, changes can be made in the color, design, graphics or any other component to create a unique layout.
-
Revenue Split Pie Graph Vector Icon Ppt PowerPoint Presentation Show Elements PDF
Showcasing this set of slides titled revenue split pie graph vector icon ppt powerpoint presentation show elements pdf. The topics addressed in these templates are revenue split pie graph vector icon. All the content presented in this PPT design is completely editable. Download it and make adjustments in color, background, font etc. as per your unique business setting.
-
Pie Graph Showing Monthly Spend On Employee Ppt PowerPoint Presentation Summary Icon PDF
Showcasing this set of slides titled pie graph showing monthly spend on employee ppt powerpoint presentation summary icon pdf. The topics addressed in these templates are allowances, travel expenses, training and development. All the content presented in this PPT design is completely editable. Download it and make adjustments in color, background, font etc. as per your unique business setting.
-
Graph Showing Key Insights Of Environmental Problems Structure PDF
Pitch your topic with ease and precision using this graph showing key insights of environmental problems structure pdf. This layout presents information on graph showing key insights of environmental problems. It is also available for immediate download and adjustment. So, changes can be made in the color, design, graphics or any other component to create a unique layout.
-
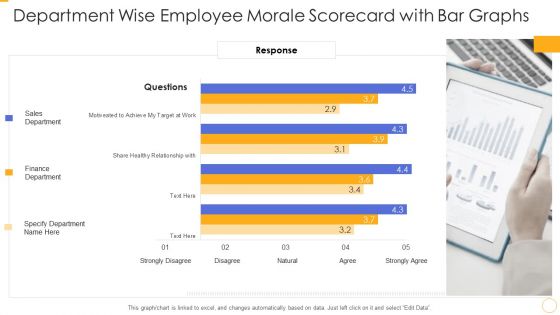
Department Wise Employee Morale Scorecard With Bar Graphs Ppt Show Templates PDF
Deliver an awe inspiring pitch with this creative department wise employee morale scorecard with bar graphs ppt show templates pdf bundle. Topics like finance department, sales department, target can be discussed with this completely editable template. It is available for immediate download depending on the needs and requirements of the user.
-
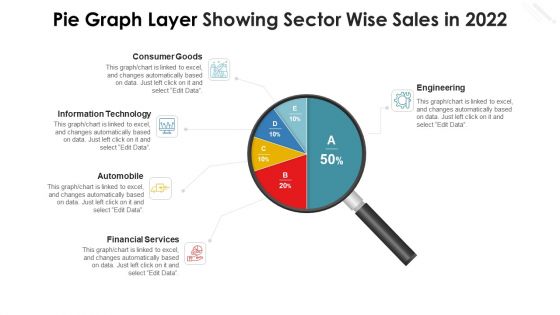
Pie Graph Layer Showing Sector Wise Sales In 2022 Microsoft PDF
Pitch your topic with ease and precision using this pie graph layer showing sector wise sales in 2022 microsoft pdf. This layout presents information on consumer goods, information technology, automobile, financial services, engineering. It is also available for immediate download and adjustment. So, changes can be made in the color, design, graphics or any other component to create a unique layout.
-
Graph Showing The Statistics Of Employee Engagement Count By Region Formats PDF
Pitch your topic with ease and precision using this graph showing the statistics of employee engagement count by region formats pdf. This layout presents information on graph showing the statistics of employee engagement count by region. It is also available for immediate download and adjustment. So, changes can be made in the color, design, graphics or any other component to create a unique layout.
-
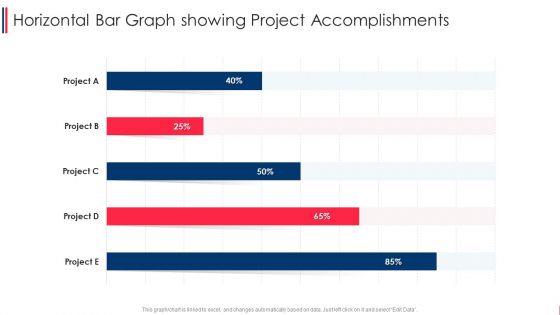
Horizontal Bar Graph Showing Project Accomplishments Structure PDF
Showcasing this set of slides titled horizontal bar graph showing project accomplishments structure pdf. The topics addressed in these templates are horizontal bar graph showing project accomplishments. All the content presented in this PPT design is completely editable. Download it and make adjustments in color, background, font etc. as per your unique business setting.
-
Statistical Data Graph Icon Showing Financial Forecast Rules PDF
Presenting statistical data graph icon showing financial forecast rules pdf to dispense important information. This template comprises four stages. It also presents valuable insights into the topics including statistical data graph icon showing financial forecast. This is a completely customizable PowerPoint theme that can be put to use immediately. So, download it and address the topic impactfully.
-
Graph Showing Financial Prediction Of Company Sales Revenue Topics PDF
Pitch your topic with ease and precision using this graph showing financial prediction of company sales revenue topics pdf. This layout presents information on graph showing financial prediction of company sales revenue. It is also available for immediate download and adjustment. So, changes can be made in the color, design, graphics or any other component to create a unique layout.
-
Graph Showing Sales Number With Search Symbol Professional PDF
Persuade your audience using this Graph Showing Sales Number With Search Symbol Professional PDF. This PPT design covers three stages, thus making it a great tool to use. It also caters to a variety of topics including Graph Showing Sales Number With Search Symbol. Download this PPT design now to present a convincing pitch that not only emphasizes the topic but also showcases your presentation skills.
-
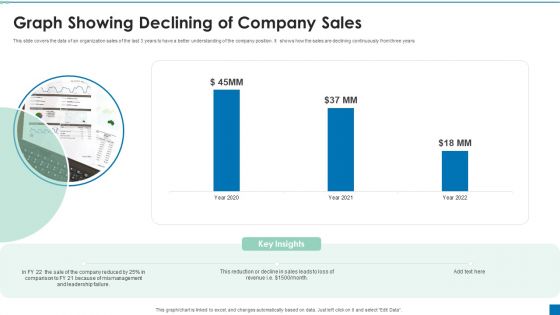
Graph Showing Declining Of Company Sales Ppt PowerPoint Presentation Portfolio Graphics Example PDF
This slide covers the data of an organization sales of the last 3 years to have a better understanding of the company position. It shows how the sales are declining continuously from three years.Pitch your topic with ease and precision using this Graph Showing Declining Of Company Sales Ppt PowerPoint Presentation Portfolio Graphics Example PDF. This layout presents information on Reduction Decline, Comparison, Mismanagement. It is also available for immediate download and adjustment. So, changes can be made in the color, design, graphics or any other component to create a unique layout.
-
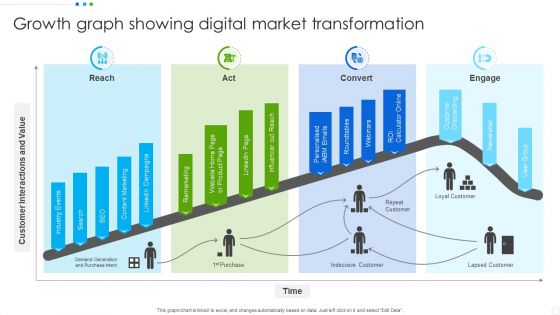
Growth Graph Showing Digital Market Transformation Inspiration PDF
Showcasing this set of slides titled Growth Graph Showing Digital Market Transformation Inspiration PDF. The topics addressed in these templates are Industry Events, Content Marketing, Loyal Customer. All the content presented in this PPT design is completely editable. Download it and make adjustments in color, background, font etc. as per your unique business setting.
-
Line Graph Showing Growth In Customer Conversion Rate Inspiration PDF
Pitch your topic with ease and precision using this Line Graph Showing Growth In Customer Conversion Rate Inspiration PDF. This layout presents information on Monthly Average, Customer Conversion Rate, Previous Average. It is also available for immediate download and adjustment. So, changes can be made in the color, design, graphics or any other component to create a unique layout.
-
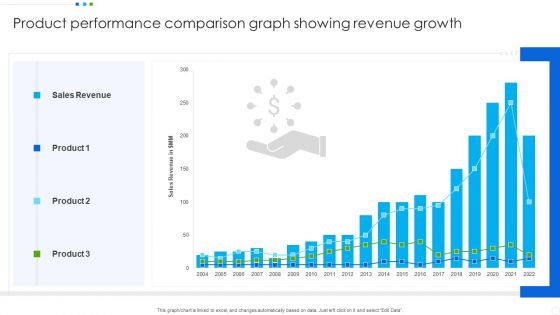
Product Performance Comparison Graph Showing Revenue Growth Portrait PDF
Showcasing this set of slides titled Product Performance Comparison Graph Showing Revenue Growth Portrait PDF. The topics addressed in these templates are Sales Revenue, Product. All the content presented in this PPT design is completely editable. Download it and make adjustments in color, background, font etc. as per your unique business setting.
-
Sales Growth Graph Showing Annual Product Performance Slides PDF
Pitch your topic with ease and precision using this Sales Growth Graph Showing Annual Product Performance Slides PDF. This layout presents information on Sales Growth, Product Performance. It is also available for immediate download and adjustment. So, changes can be made in the color, design, graphics or any other component to create a unique layout.
-
Income And Expenditure Details Of Company Shown Via Doughnut Graph Graphics PDF
This graph or chart is linked to excel, and changes automatically based on data. Just left click on it and select Edit Data. Pitch your topic with ease and precision using this Income And Expenditure Details Of Company Shown Via Doughnut Graph Graphics PDF. This layout presents information on Property Rent, Corporate Sales, Expenditure. It is also available for immediate download and adjustment. So, changes can be made in the color, design, graphics or any other component to create a unique layout.


