Graph profit finance PowerPoint Presentation Templates and Google Slides
-
Graph Profit Finance PowerPoint Templates And PowerPoint Themes 0512
Microsoft Powerpoint Templates and Background with business growth-Graph Profit Finance PowerPoint Templates And PowerPoint Themes 0512-These PowerPoint designs and slide layouts can be used for themes relating to -Graph profit finance, business, finance, sales, shape, success
-
Profit Graph Finance PowerPoint Templates And PowerPoint Themes 0612
Profit Graph Finance PowerPoint Templates And PowerPoint Themes Business-Microsoft Powerpoint Templates and Background with business success with arrow
-
Profit Graph Finance PowerPoint Templates And PowerPoint Themes 0812
Profit Graph Finance PowerPoint Templates And PowerPoint Themes 0812-Microsoft Powerpoint Templates and Background with profit graph with arrow
-
Profits Bar Graph Finance PowerPoint Templates And PowerPoint Themes 0712
Profits Bar Graph Finance PowerPoint Templates And PowerPoint Themes 0712-Microsoft Powerpoint Templates and Background with profits bar chart
-
Profit And Loss Graph Concept Finance PowerPoint Templates And PowerPoint Themes 0912
Profit And Loss Graph Concept Finance PowerPoint Templates And PowerPoint Themes 0912-Microsoft Powerpoint Templates and Background with profit and loss graph-Profit and loss graph, business, finance, money, sales, marketing
-
Financial Graph Showing Profit Volume Analysis Ppt PowerPoint Presentation Model Master Slide PDF
Presenting this set of slides with name financial graph showing profit volume analysis ppt powerpoint presentation model master slide pdf. The topics discussed in these slides are high cost and competition, low cost and risk, head, the long tail, high profitability of conversion, low profitability of conversion. This is a completely editable PowerPoint presentation and is available for immediate download. Download now and impress your audience.
-
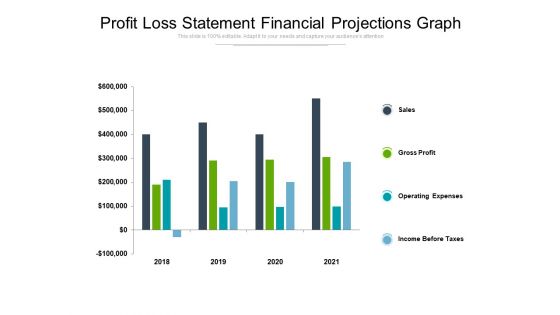
Profit Loss Statement Financial Projections Graph Ppt PowerPoint Presentation Summary Slides
Presenting this set of slides with name profit loss statement financial projections graph ppt powerpoint presentation summary slides. The topics discussed in these slides are sales, gross profit, operating expenses, income before taxes. This is a completely editable PowerPoint presentation and is available for immediate download. Download now and impress your audience.
-
Monthly Financial Metrics Graph With Operating Profit And Cost Of Goods Sold Pictures PDF
This slide showcases monthly analytics for to keep company finances organized and identify problem areas. It further includes details about marketing, professional fees, COGS and other operations. Pitch your topic with ease and precision using this Monthly Financial Metrics Graph With Operating Profit And Cost Of Goods Sold Pictures PDF. This layout presents information on Key Insights, Operating Profit, Total Revenue. It is also available for immediate download and adjustment. So, changes can be made in the color, design, graphics or any other component to create a unique layout.


