Graph chart PowerPoint Presentation Templates and Google Slides
-
Gantt Chart Ppt PowerPoint Presentation Diagram Graph Charts PDF
From laying roadmaps to briefing everything in detail, our templates are perfect for you. You can set the stage with your presentation slides. All you have to do is download these easy to edit and customizable templates. Gantt Chart Ppt PowerPoint Presentation Diagram Graph Charts PDF will help you deliver an outstanding performance that everyone would remember and praise you for. Do download this presentation today.
-
Introduction And Benefits Of Marketing Collateral Ppt PowerPoint Presentation Diagram Graph Charts PDF
The following slide provides an overview of marketing collateral along with its positive impact on business. It showcases advantages such as standard information communication, reference material for sales, support material for conversations and campaign promotions. Present like a pro with Introduction And Benefits Of Marketing Collateral Ppt PowerPoint Presentation Diagram Graph Charts PDF Create beautiful presentations together with your team, using our easy to use presentation slides. Share your ideas in real time and make changes on the fly by downloading our templates. So whether you are in the office, on the go, or in a remote location, you can stay in sync with your team and present your ideas with confidence. With Slidegeeks presentation got a whole lot easier. Grab these presentations today.
-
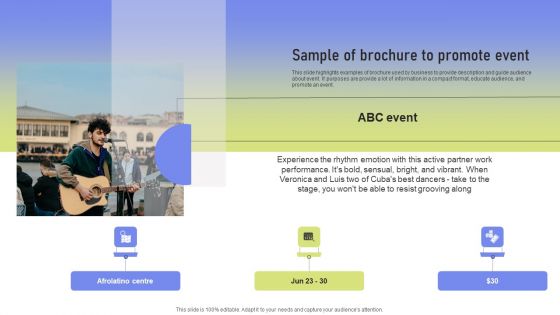
Sample Of Brochure To Promote Event Ppt PowerPoint Presentation Diagram Graph Charts PDF
This slide highlights examples of brochure used by business to provide description and guide audience about event. It purposes are provide a lot of information in a compact format, educate audience, and promote an event. This Sample Of Brochure To Promote Event Ppt PowerPoint Presentation Diagram Graph Charts PDF from Slidegeeks makes it easy to present information on your topic with precision. It provides customization options, so you can make changes to the colors, design, graphics, or any other component to create a unique layout. It is also available for immediate download, so you can begin using it right away. Slidegeeks has done good research to ensure that you have everything you need to make your presentation stand out. Make a name out there for a brilliant performance.
-
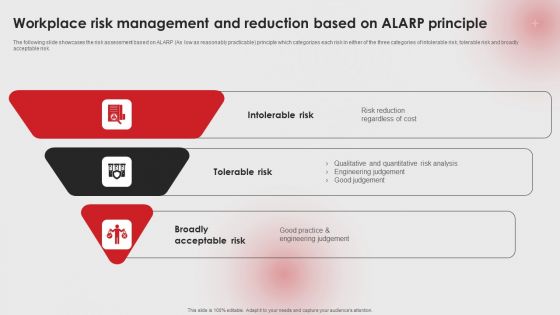
Workplace Risk Management And Reduction Based On ALARP Principle Ppt PowerPoint Presentation Diagram Graph Charts PDF
Whether you have daily or monthly meetings, a brilliant presentation is necessary. Workplace Risk Management And Reduction Based On ALARP Principle Ppt PowerPoint Presentation Diagram Graph Charts PDF can be your best option for delivering a presentation. Represent everything in detail using Workplace Risk Management And Reduction Based On ALARP Principle Ppt PowerPoint Presentation Diagram Graph Charts PDF and make yourself stand out in meetings. The template is versatile and follows a structure that will cater to your requirements. All the templates prepared by Slidegeeks are easy to download and edit. Our research experts have taken care of the corporate themes as well. So, give it a try and see the results.
-
Customer Onboarding Journey Process Timeline Ppt PowerPoint Presentation Diagram Graph Charts PDF
Do you have to make sure that everyone on your team knows about any specific topic I yes, then you should give Customer Onboarding Journey Process Timeline Ppt PowerPoint Presentation Diagram Graph Charts PDF a try. Our experts have put a lot of knowledge and effort into creating this impeccable Customer Onboarding Journey Process Timeline Ppt PowerPoint Presentation Diagram Graph Charts PDF. You can use this template for your upcoming presentations, as the slides are perfect to represent even the tiniest detail. You can download these templates from the Slidegeeks website and these are easy to edit. So grab these today.
-
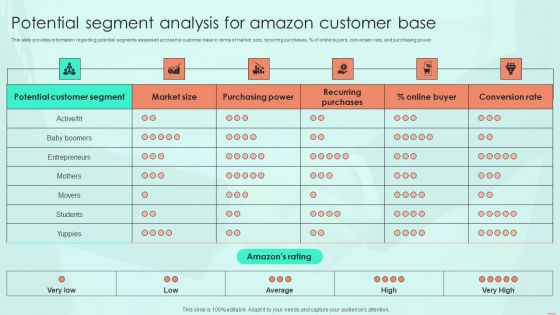
Potential Segment Analysis For Amazon Customer Base Ppt PowerPoint Presentation Diagram Graph Charts PDF
This slide provides information regarding potential segments assessed across the customer base in terms of market size, recurring purchases, percent of online buyers, conversion rate, and purchasing power. Present like a pro with Potential Segment Analysis For Amazon Customer Base Ppt PowerPoint Presentation Diagram Graph Charts PDF Create beautiful presentations together with your team, using our easy to use presentation slides. Share your ideas in real time and make changes on the fly by downloading our templates. So whether you are in the office, on the go, or in a remote location, you can stay in sync with your team and present your ideas with confidence. With Slidegeeks presentation got a whole lot easier. Grab these presentations today.
-
Different Types Of Brand Architecture Ppt PowerPoint Presentation Diagram Graph Charts PDF
This slide showcases different types of brand architecture under which organizations operates. It includes - branded house, house of brands, hybrid brand and endorsed brand architecture. Welcome to our selection of the Different Types Of Brand Architecture Ppt PowerPoint Presentation Diagram Graph Charts PDF. These are designed to help you showcase your creativity and bring your sphere to life. Planning and Innovation are essential for any business that is just starting out. This collection contains the designs that you need for your everyday presentations. All of our PowerPoints are 100 percent editable, so you can customize them to suit your needs. This multi purpose template can be used in various situations. Grab these presentation templates today.
-
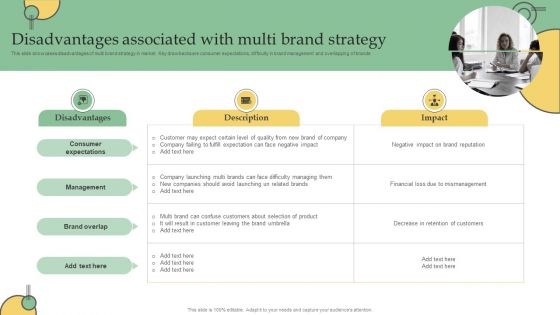
Disadvantages Associated With Multi Brand Strategy Ppt PowerPoint Presentation Diagram Graph Charts PDF
This slide showcases disadvantages of multi brand strategy in market. Key drawbacks are consumer expectations, difficulty in brand management and overlapping of brands. Explore a selection of the finest Disadvantages Associated With Multi Brand Strategy Ppt PowerPoint Presentation Diagram Graph Charts PDF here. With a plethora of professionally designed and pre made slide templates, you can quickly and easily find the right one for your upcoming presentation. You can use our Disadvantages Associated With Multi Brand Strategy Ppt PowerPoint Presentation Diagram Graph Charts PDF to effectively convey your message to a wider audience. Slidegeeks has done a lot of research before preparing these presentation templates. The content can be personalized and the slides are highly editable. Grab templates today from Slidegeeks.
-
Collecting Consumer Qualitative Data For Personalized Marketing Ppt PowerPoint Presentation Diagram Graph Charts PDF
This slide showcases consumer qualitative data that can be collected to formulate personalized marketing campaign. It also shows ways to collect data from different sources Do you have an important presentation coming up Are you looking for something that will make your presentation stand out from the rest Look no further than Collecting Consumer Qualitative Data For Personalized Marketing Ppt PowerPoint Presentation Diagram Graph Charts PDF. With our professional designs, you can trust that your presentation will pop and make delivering it a smooth process. And with Slidegeeks, you can trust that your presentation will be unique and memorable. So why wait Grab Collecting Consumer Qualitative Data For Personalized Marketing Ppt PowerPoint Presentation Diagram Graph Charts PDF today and make your presentation stand out from the rest.
-
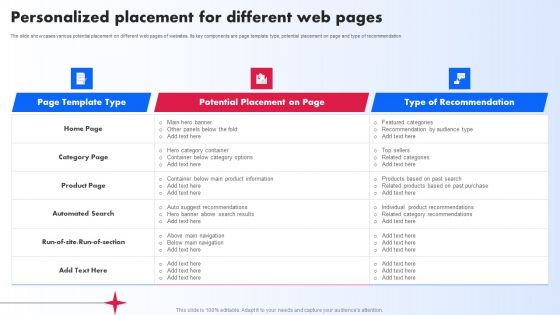
Personalized Placement For Different Web Pages Ppt PowerPoint Presentation Diagram Graph Charts PDF
The slide showcases various potential placement on different web pages of websites. Its key components are page template type, potential placement on page and type of recommendation. Do you know about Slidesgeeks Personalized Placement For Different Web Pages Ppt PowerPoint Presentation Diagram Graph Charts PDF. These are perfect for delivering any kind od presentation. Using it, create PowerPoint presentations that communicate your ideas and engage audiences. Save time and effort by using our pre designed presentation templates that are perfect for a wide range of topic. Our vast selection of designs covers a range of styles, from creative to business, and are all highly customizable and easy to edit. Download as a PowerPoint template or use them as Google Slides themes.
-
Data Center Relocation Benefits To The Company Ppt PowerPoint Presentation Diagram Graph Charts PDF
The following slide shows the benefits of data center relocation to the company such as increase in overall data center efficiency, reduction in data center expenses and increase in overall data security. Slidegeeks is here to make your presentations a breeze with Data Center Relocation Benefits To The Company Ppt PowerPoint Presentation Diagram Graph Charts PDF With our easy to use and customizable templates, you can focus on delivering your ideas rather than worrying about formatting. With a variety of designs to choose from, you are sure to find one that suits your needs. And with animations and unique photos, illustrations, and fonts, you can make your presentation pop. So whether you are giving a sales pitch or presenting to the board, make sure to check out Slidegeeks first.
-
Agenda SDN Security Architecture Ppt PowerPoint Presentation Diagram Graph Charts PDF
Do you have an important presentation coming up Are you looking for something that will make your presentation stand out from the rest Look no further than Agenda SDN Security Architecture Ppt PowerPoint Presentation Diagram Graph Charts PDF. With our professional designs, you can trust that your presentation will pop and make delivering it a smooth process. And with Slidegeeks, you can trust that your presentation will be unique and memorable. So why wait Grab Agenda SDN Security Architecture Ppt PowerPoint Presentation Diagram Graph Charts PDF today and make your presentation stand out from the rest
-
Intelligent Manufacturing Timeline Ppt PowerPoint Presentation Diagram Graph Charts PDF
Do you know about Slidesgeeks Intelligent Manufacturing Timeline Ppt PowerPoint Presentation Diagram Graph Charts PDF. These are perfect for delivering any kind od presentation. Using it, create PowerPoint presentations that communicate your ideas and engage audiences. Save time and effort by using our pre designed presentation templates that are perfect for a wide range of topic. Our vast selection of designs covers a range of styles, from creative to business, and are all highly customizable and easy to edit. Download as a PowerPoint template or use them as Google Slides themes.
-
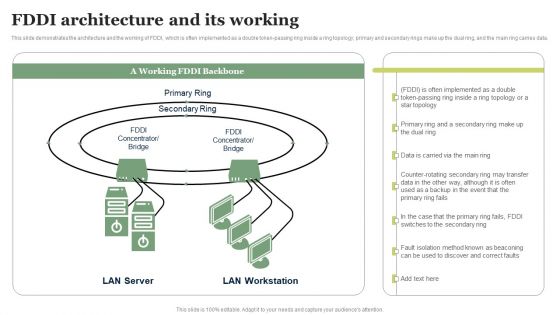
FDDI Architecture And Its Working Ppt PowerPoint Presentation Diagram Graph Charts PDF
This slide demonstrates the architecture and the working of FDDI, which is often implemented as a double token-passing ring inside a ring topology primary and secondary rings make up the dual ring, and the main ring carries data. Here you can discover an assortment of the finest PowerPoint and Google Slides templates. With these templates, you can create presentations for a variety of purposes while simultaneously providing your audience with an eye catching visual experience. Download FDDI Architecture And Its Working Ppt PowerPoint Presentation Diagram Graph Charts PDF to deliver an impeccable presentation. These templates will make your job of preparing presentations much quicker, yet still, maintain a high level of quality. Slidegeeks has experienced researchers who prepare these templates and write high quality content for you. Later on, you can personalize the content by editing the FDDI Architecture And Its Working Ppt PowerPoint Presentation Diagram Graph Charts PDF.
-
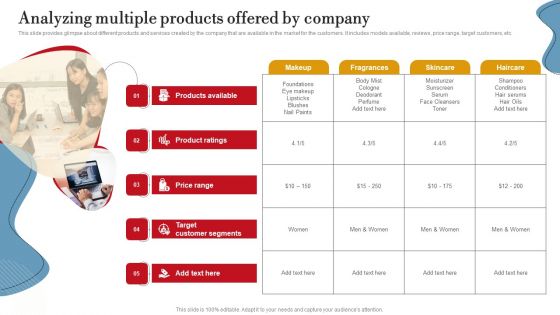
Analyzing Multiple Products Offered By Company Ppt PowerPoint Presentation Diagram Graph Charts PDF
This slide provides glimpse about different products and services created by the company that are available in the market for the customers. It includes models available, reviews, price range, target customers, etc. Find a pre designed and impeccable Analyzing Multiple Products Offered By Company Ppt PowerPoint Presentation Diagram Graph Charts PDF. The templates can ace your presentation without additional effort. You can download these easy to edit presentation templates to make your presentation stand out from others. So, what are you waiting for Download the template from Slidegeeks today and give a unique touch to your presentation.
-
Comprehensive Business Overview With Mission And Core Values Ppt PowerPoint Presentation Diagram Graph Charts PDF
This slide provides glimpse about comprehensive summary of cosmetics and skin care company to provide current and background information. It includes overview, partners, core values, key facts, etc. Want to ace your presentation in front of a live audience Our Comprehensive Business Overview With Mission And Core Values Ppt PowerPoint Presentation Diagram Graph Charts PDF can help you do that by engaging all the users towards you. Slidegeeks experts have put their efforts and expertise into creating these impeccable powerpoint presentations so that you can communicate your ideas clearly. Moreover, all the templates are customizable, and easy to edit and downloadable. Use these for both personal and commercial use.
-
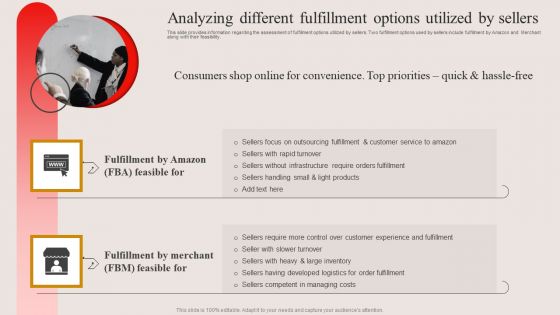
Analyzing Different Fulfillment Options Utilized By Sellers Ppt PowerPoint Presentation Diagram Graph Charts PDF
This slide provides information regarding the assessment of fulfillment options utilized by sellers. Two fulfillment options used by sellers include fulfillment by Amazon and Merchant along with their feasibility. Slidegeeks is one of the best resources for PowerPoint templates. You can download easily and regulate Analyzing Different Fulfillment Options Utilized By Sellers Ppt PowerPoint Presentation Diagram Graph Charts PDF for your personal presentations from our wonderful collection. A few clicks is all it takes to discover and get the most relevant and appropriate templates. Use our Templates to add a unique zing and appeal to your presentation and meetings. All the slides are easy to edit and you can use them even for advertisement purposes.
-
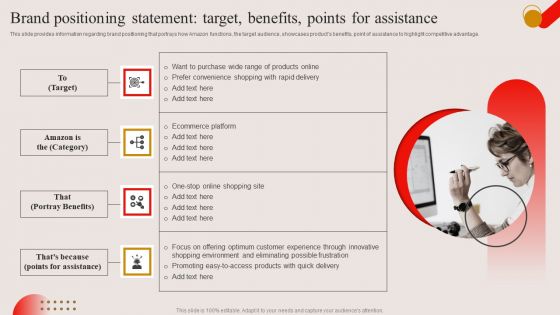
Brand Positioning Statement Target Benefits Points For Assistance Ppt PowerPoint Presentation Diagram Graph Charts PDF
This slide provides information regarding brand positioning that portrays how Amazon functions, the target audience, showcases products benefits, point of assistance to highlight competitive advantage. Get a simple yet stunning designed Brand Positioning Statement Target Benefits Points For Assistance Ppt PowerPoint Presentation Diagram Graph Charts PDF. It is the best one to establish the tone in your meetings. It is an excellent way to make your presentations highly effective. So, download this PPT today from Slidegeeks and see the positive impacts. Our easy to edit Brand Positioning Statement Target Benefits Points For Assistance Ppt PowerPoint Presentation Diagram Graph Charts PDF can be your go to option for all upcoming conferences and meetings. So, what are you waiting for Grab this template today.
-
Marketing Mix Approach To Attain Consumers Price Ppt PowerPoint Presentation Diagram Graph Charts PDF
This slide provides information regarding the marketing mix utilized by Amazon to enable competitiveness and international growth. The firm focuses on price levels and pricing strategies utilized for product sales in terms of market-oriented pricing strategy, price discrimination strategy, etc. This Marketing Mix Approach To Attain Consumers Price Ppt PowerPoint Presentation Diagram Graph Charts PDF from Slidegeeks makes it easy to present information on your topic with precision. It provides customization options, so you can make changes to the colors, design, graphics, or any other component to create a unique layout. It is also available for immediate download, so you can begin using it right away. Slidegeeks has done good research to ensure that you have everything you need to make your presentation stand out. Make a name out there for a brilliant performance.
-
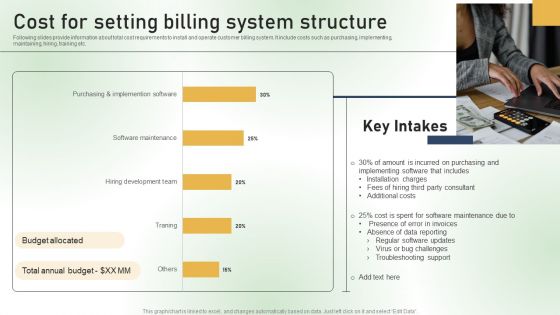
Cost For Setting Billing System Structure Ppt PowerPoint Presentation Diagram Graph Charts PDF
Following slides provide information about total cost requirements to install and operate customer billing system. It include costs such as purchasing, implementing, maintaining, hiring, training etc. Crafting an eye catching presentation has never been more straightforward. Let your presentation shine with this tasteful yet straightforward Cost For Setting Billing System Structure Ppt PowerPoint Presentation Diagram Graph Charts PDF template. It offers a minimalistic and classy look that is great for making a statement. The colors have been employed intelligently to add a bit of playfulness while still remaining professional. Construct the ideal Cost For Setting Billing System Structure Ppt PowerPoint Presentation Diagram Graph Charts PDF that effortlessly grabs the attention of your audience. Begin now and be certain to wow your customers.
-
Determining Essential Functionalities For Company Services Ppt PowerPoint Presentation Diagram Graph Charts PDF
Following slide exhibits core functionalities required to operate various company services. It includes services such as catalog, entitlement, invoice, payment and overdue system. This modern and well arranged Determining Essential Functionalities For Company Services Ppt PowerPoint Presentation Diagram Graph Charts PDF provides lots of creative possibilities. It is very simple to customize and edit with the Powerpoint Software. Just drag and drop your pictures into the shapes. All facets of this template can be edited with Powerpoint no extra software is necessary. Add your own material, put your images in the places assigned for them, adjust the colors, and then you can show your slides to the world, with an animated slide included.
-
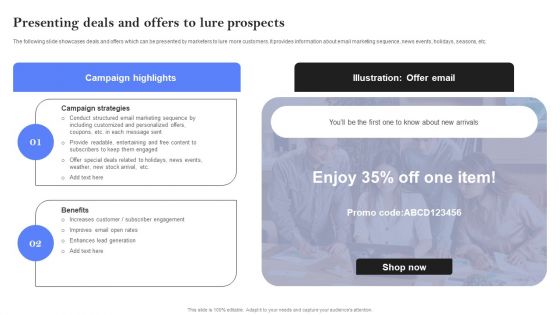
Presenting Deals And Offers To Lure Prospects Ppt PowerPoint Presentation Diagram Graph Charts PDF
The following slide showcases deals and offers which can be presented by marketers to lure more customers. It provides information about email marketing sequence, news events, holidays, seasons, etc. Slidegeeks is here to make your presentations a breeze with Presenting Deals And Offers To Lure Prospects Ppt PowerPoint Presentation Diagram Graph Charts PDF With our easy to use and customizable templates, you can focus on delivering your ideas rather than worrying about formatting. With a variety of designs to choose from, you are sure to find one that suits your needs. And with animations and unique photos, illustrations, and fonts, you can make your presentation pop. So whether you are giving a sales pitch or presenting to the board, make sure to check out Slidegeeks first.
-
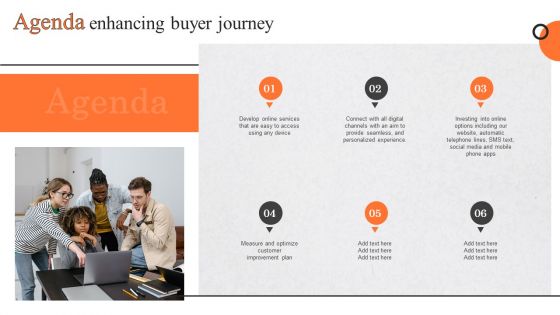
Agenda Enhancing Buyer Journey Ppt PowerPoint Presentation Diagram Graph Charts PDF
If you are looking for a format to display your unique thoughts, then the professionally designed Agenda Enhancing Buyer Journey Ppt PowerPoint Presentation Diagram Graph Charts PDF is the one for you. You can use it as a Google Slides template or a PowerPoint template. Incorporate impressive visuals, symbols, images, and other charts. Modify or reorganize the text boxes as you desire. Experiment with shade schemes and font pairings. Alter, share or cooperate with other people on your work. Download Agenda Enhancing Buyer Journey Ppt PowerPoint Presentation Diagram Graph Charts PDF and find out how to give a successful presentation. Present a perfect display to your team and make your presentation unforgettable.
-
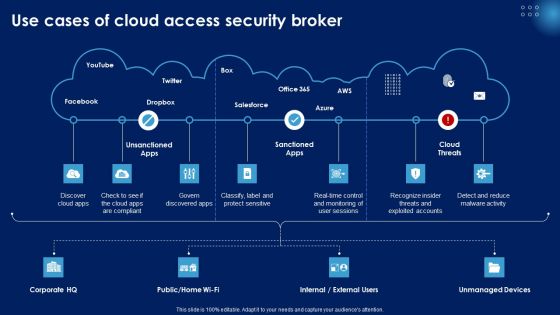
Use Cases Of Cloud Access Security Broker Ppt PowerPoint Presentation Diagram Graph Charts PDF
Find highly impressive Use Cases Of Cloud Access Security Broker Ppt PowerPoint Presentation Diagram Graph Charts PDF on Slidegeeks to deliver a meaningful presentation. You can save an ample amount of time using these presentation templates. No need to worry to prepare everything from scratch because Slidegeeks experts have already done a huge research and work for you. You need to download Use Cases Of Cloud Access Security Broker Ppt PowerPoint Presentation Diagram Graph Charts PDF for your upcoming presentation. All the presentation templates are 100 percent editable and you can change the color and personalize the content accordingly. Download now.
-
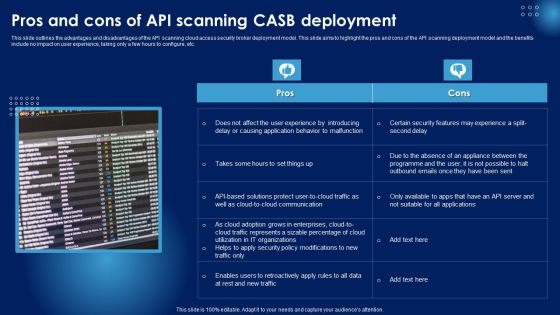
Pros And Cons Of API Scanning CASB Deployment Ppt PowerPoint Presentation Diagram Graph Charts PDF
This slide outlines the advantages and disadvantages of the API scanning cloud access security broker deployment model. This slide aims to highlight the pros and cons of the API scanning deployment model and the benefits include no impact on user experience, taking only a few hours to configure, etc. Whether you have daily or monthly meetings, a brilliant presentation is necessary. Pros And Cons Of API Scanning CASB Deployment Ppt PowerPoint Presentation Diagram Graph Charts PDF can be your best option for delivering a presentation. Represent everything in detail using Pros And Cons Of API Scanning CASB Deployment Ppt PowerPoint Presentation Diagram Graph Charts PDF and make yourself stand out in meetings. The template is versatile and follows a structure that will cater to your requirements. All the templates prepared by Slidegeeks are easy to download and edit. Our research experts have taken care of the corporate themes as well. So, give it a try and see the results.
-
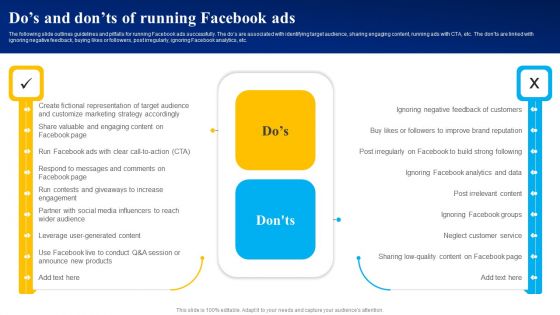
Dos And Donts Of Running Facebook Ads Ppt PowerPoint Presentation Diagram Graph Charts PDF
The following slide outlines guidelines and pitfalls for running Facebook ads successfully. The dos are associated with identifying target audience, sharing engaging content, running ads with CTA, etc. The donts are linked with ignoring negative feedback, buying likes or followers, post irregularly, ignoring Facebook analytics, etc. Formulating a presentation can take up a lot of effort and time, so the content and message should always be the primary focus. The visuals of the PowerPoint can enhance the presenters message, so our Dos And Donts Of Running Facebook Ads Ppt PowerPoint Presentation Diagram Graph Charts PDF was created to help save time. Instead of worrying about the design, the presenter can concentrate on the message while our designers work on creating the ideal templates for whatever situation is needed. Slidegeeks has experts for everything from amazing designs to valuable content, we have put everything into Dos And Donts Of Running Facebook Ads Ppt PowerPoint Presentation Diagram Graph Charts PDF.
-
Key Texting And SMS Marketing Statistics Ppt PowerPoint Presentation Diagram Graph Charts PDF
This slide represents the statistical data to help marketers analyze the benefits and importance of SMS marketing for business growth and development. It includes key SMS marketing statistics such as click through rates, opt-ins etc. Get a simple yet stunning designed Key Texting And SMS Marketing Statistics Ppt PowerPoint Presentation Diagram Graph Charts PDF. It is the best one to establish the tone in your meetings. It is an excellent way to make your presentations highly effective. So, download this PPT today from Slidegeeks and see the positive impacts. Our easy to edit Key Texting And SMS Marketing Statistics Ppt PowerPoint Presentation Diagram Graph Charts PDF can be your go to option for all upcoming conferences and meetings. So, what are you waiting for Grab this template today.
-
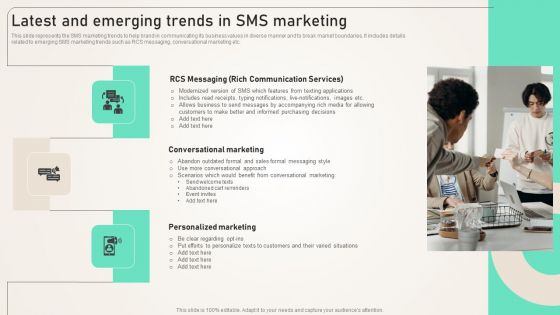
Latest And Emerging Trends In SMS Marketing Ppt PowerPoint Presentation Diagram Graph Charts PDF
This slide represents the SMS marketing trends to help brand in communicating its business values in diverse manner and to break market boundaries. It includes details related to emerging SMS marketing trends such as RCS messaging, conversational marketing etc. Present like a pro with Latest And Emerging Trends In SMS Marketing Ppt PowerPoint Presentation Diagram Graph Charts PDF Create beautiful presentations together with your team, using our easy to use presentation slides. Share your ideas in real time and make changes on the fly by downloading our templates. So whether you are in the office, on the go, or in a remote location, you can stay in sync with your team and present your ideas with confidence. With Slidegeeks presentation got a whole lot easier. Grab these presentations today.
-
Steps For Sales Risk Management Process Ppt Diagram Graph Charts PDF
The following slide illustrates some steps to optimize sales risk administration process improving organizations overall financial performance. It includes activities such as identifying , assessing, prioritizing, treating and monitoring issues etc. The Steps For Sales Risk Management Process Ppt Diagram Graph Charts PDF is a compilation of the most recent design trends as a series of slides. It is suitable for any subject or industry presentation, containing attractive visuals and photo spots for businesses to clearly express their messages. This template contains a variety of slides for the user to input data, such as structures to contrast two elements, bullet points, and slides for written information. Slidegeeks is prepared to create an impression.
-
Cyber Security Event And Incident Management Ppt Powerpoint Presentation Diagram Graph Charts Pdf
This slide represents the architecture showing the procedure of managing cyber security incidents in order to minimize its impact on business operations. It starts with detection of cyber security incident and ends with response to crisis situation. Are you in need of a template that can accommodate all of your creative concepts This one is crafted professionally and can be altered to fit any style. Use it with Google Slides or PowerPoint. Include striking photographs, symbols, depictions, and other visuals. Fill, move around, or remove text boxes as desired. Test out color palettes and font mixtures. Edit and save your work, or work with colleagues. Download Cyber Security Event And Incident Management Ppt Powerpoint Presentation Diagram Graph Charts Pdf and observe how to make your presentation outstanding. Give an impeccable presentation to your group and make your presentation unforgettable.
-
Agenda For Fibers Ppt Diagram Graph Charts
Find a pre-designed and impeccable Agenda For Fibers Ppt Diagram Graph Charts. The templates can ace your presentation without additional effort. You can download these easy-to-edit presentation templates to make your presentation stand out from others. So, what are you waiting for Download the template from Slidegeeks today and give a unique touch to your presentation.
-
Icons Slide For Fibers Ppt Diagram Graph Charts
Introducing our well designed Icons Slide For Fibers Ppt Diagram Graph Charts set of slides. The slide displays editable icons to enhance your visual presentation. The icons can be edited easily. So customize according to your business to achieve a creative edge. Download and share it with your audience.
-
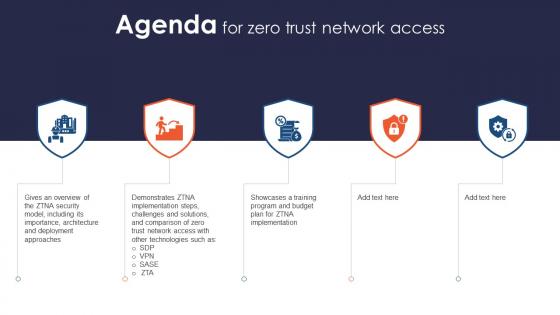
Agenda For Zero Trust Network Access Ppt Diagram Graph Charts
Do you have to make sure that everyone on your team knows about any specific topic I yes, then you should give Agenda For Zero Trust Network Access Ppt Diagram Graph Charts a try. Our experts have put a lot of knowledge and effort into creating this impeccable Agenda For Zero Trust Network Access Ppt Diagram Graph Charts. You can use this template for your upcoming presentations, as the slides are perfect to represent even the tiniest detail. You can download these templates from the Slidegeeks website and these are easy to edit. So grab these today
-
Agenda CASB 2 0 IT Ppt Diagram Graph Charts
Find a pre-designed and impeccable Agenda CASB 2 0 IT Ppt Diagram Graph Charts. The templates can ace your presentation without additional effort. You can download these easy-to-edit presentation templates to make your presentation stand out from others. So, what are you waiting for Download the template from Slidegeeks today and give a unique touch to your presentation.
-
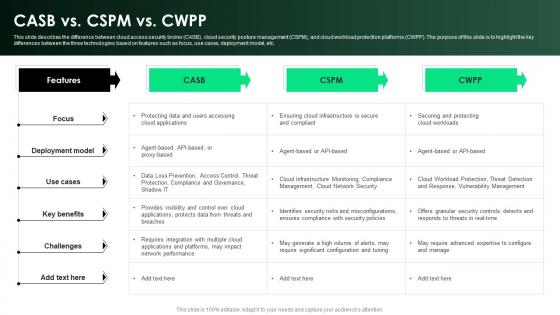
CASB 2 0 IT CASB Vs CSPM Vs CWPP Ppt Diagram Graph Charts
This slide describes the difference between cloud access security broker CASB , cloud security posture management CSPM , and cloud workload protection platforms CWPP . The purpose of this slide is to highlight the key differences between the three technologies based on features such as focus, use cases, deployment model, etc. Are you in need of a template that can accommodate all of your creative concepts This one is crafted professionally and can be altered to fit any style. Use it with Google Slides or PowerPoint. Include striking photographs, symbols, depictions, and other visuals. Fill, move around, or remove text boxes as desired. Test out color palettes and font mixtures. Edit and save your work, or work with colleagues. Download CASB 2 0 IT CASB Vs CSPM Vs CWPP Ppt Diagram Graph Charts and observe how to make your presentation outstanding. Give an impeccable presentation to your group and make your presentation unforgettable.
-
Icons Slide CASB 2 0 IT Ppt Diagram Graph Charts
Welcome to our selection of the Icons Slide CASB 2 0 IT Ppt Diagram Graph Charts. These are designed to help you showcase your creativity and bring your sphere to life. Planning and Innovation are essential for any business that is just starting out. This collection contains the designs that you need for your everyday presentations. All of our PowerPoints are 100Percent editable, so you can customize them to suit your needs. This multi-purpose template can be used in various situations. Grab these presentation templates today.
-
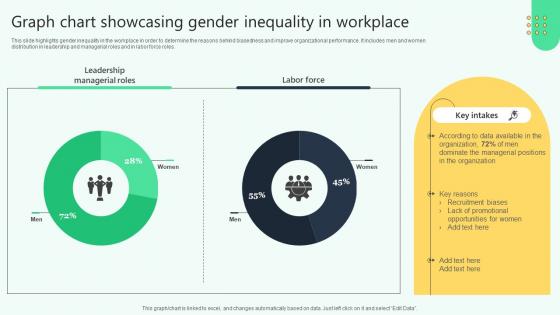
Graph Chart Showcasing Gender Inequality In Workplace Analysing Hr Data For Effective Decision Making
This slide highlights gender inequality in the workplace in order to determine the reasons behind biasedness and improve organizational performance. It includes men and women distribution in leadership and managerial roles and in labor force roles. This Graph Chart Showcasing Gender Inequality In Workplace Analysing Hr Data For Effective Decision Making is perfect for any presentation, be it in front of clients or colleagues. It is a versatile and stylish solution for organizing your meetings. The Graph Chart Showcasing Gender Inequality In Workplace Analysing Hr Data For Effective Decision Making features a modern design for your presentation meetings. The adjustable and customizable slides provide unlimited possibilities for acing up your presentation. Slidegeeks has done all the homework before launching the product for you. So, do not wait, grab the presentation templates today
-
About Me Personal Profile I30 Ppt Powerpoint Presentation Diagram Graph Charts
Boost your pitch with our creative About Me Personal Profile I30 Ppt Powerpoint Presentation Diagram Graph Charts. Deliver an awe-inspiring pitch that will mesmerize everyone. Using these presentation templates you will surely catch everyones attention. You can browse the ppts collection on our website. We have researchers who are experts at creating the right content for the templates. So you do not have to invest time in any additional work. Just grab the template now and use them.


