Graph business PowerPoint Presentation Templates and Google Slides
-
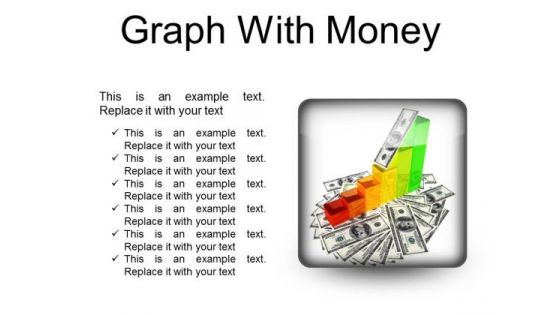
Graph With Money Business PowerPoint Presentation Slides S
Microsoft Powerpoint Slides and Backgrounds with graph with dollar
-
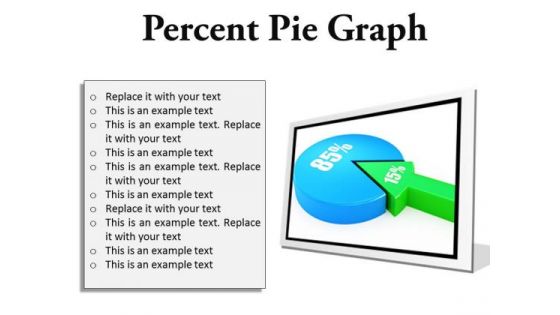
Percent Pie Graph Business PowerPoint Presentation Slides C
Microsoft PowerPoint Slides and Backgrounds with fifteen and eighty five percent proportion pie chart
-
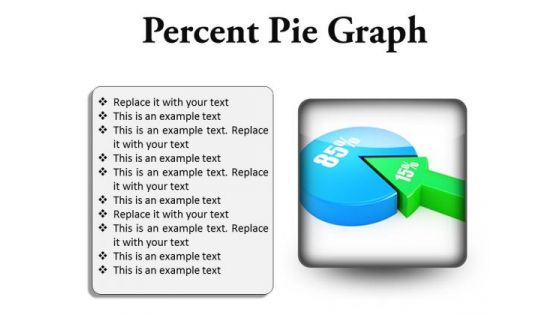
Percent Pie Graph Business PowerPoint Presentation Slides Cc
Microsoft PowerPoint Slides and Backgrounds with fifteen and eighty five percent proportion pie chart
-
Percent Pie Graph Business PowerPoint Presentation Slides F
Microsoft PowerPoint Slides and Backgrounds with fifteen and eighty five percent proportion pie chart
-
Percent Pie Graph Business PowerPoint Presentation Slides R
Microsoft PowerPoint Slides and Backgrounds with fifteen and eighty five percent proportion pie chart
-
Percent Pie Graph Business PowerPoint Presentation Slides S
Microsoft PowerPoint Slides and Backgrounds with fifteen and eighty five percent proportion pie chart
-
Business Data Graph PowerPoint Icon C
Increasing Bar Chart - Business Data Graph With World Map
-
Business Data Graph PowerPoint Icon Cc
Increasing Bar Chart - Business Data Graph With World Map
-
Business Data Graph PowerPoint Icon S
Increasing Bar Chart - Business Data Graph With World Map
-
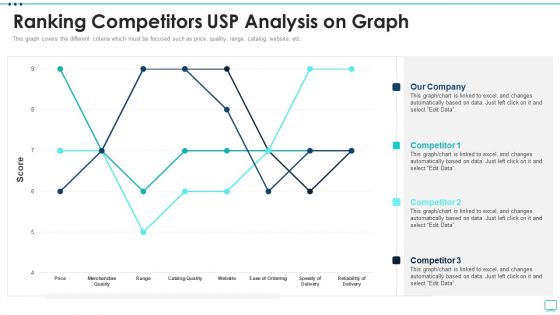
Strategic Business Plan Effective Tools Ranking Competitors USP Analysis On Graph Designs PDF
This graph covers the different criteria which must be focused such as price, quality, range, catalog, website, etc. Deliver and pitch your topic in the best possible manner with this strategic business plan effective tools ranking competitors usp analysis on graph designs pdf. Use them to share invaluable insights on price, merchandise quality, catalog quality, speedy delivery and impress your audience. This template can be altered and modified as per your expectations. So, grab it now.
-
Business Growth Action Plan Framework Icon With Graph Ppt Infographics Background PDF
Persuade your audience using this Business Growth Action Plan Framework Icon With Graph Ppt Infographics Background PDF. This PPT design covers three stages, thus making it a great tool to use. It also caters to a variety of topics including Business Growth, Action Plan ,Framework Icon Graph. Download this PPT design now to present a convincing pitch that not only emphasizes the topic but also showcases your presentation skills.
-
Phases Of Business Partner Lifecycle With Graph Information PDF
The following slide highlights the phases of partner lifecycle with graph illustrating key headings which includes lifecycle phases, activity and comments, where lifecycle phases depicts initiation, formation, growth, maturity and final. Pitch your topic with ease and precision using this Phases Of Business Partner Lifecycle With Graph Information PDF. This layout presents information on Growth, Maturity, Targets. It is also available for immediate download and adjustment. So, changes can be made in the color, design, graphics or any other component to create a unique layout.
-
Business Plan Sprint Review Icon With Graph Themes PDF
Presenting Business Plan Sprint Review Icon With Graph Themes PDF to dispense important information. This template comprises four stages. It also presents valuable insights into the topics including Review Icon With Graph, Business Plan Sprint. This is a completely customizable PowerPoint theme that can be put to use immediately. So, download it and address the topic impactfully.
-
Management Analyst Icon With Business Growth Graph Ppt Professional Themes PDF
Persuade your audience using this Management Analyst Icon With Business Growth Graph Ppt Professional Themes PDF. This PPT design covers four stages, thus making it a great tool to use. It also caters to a variety of topics including Management Analyst Icon, Business Growth Graph. Download this PPT design now to present a convincing pitch that not only emphasizes the topic but also showcases your presentation skills.
-
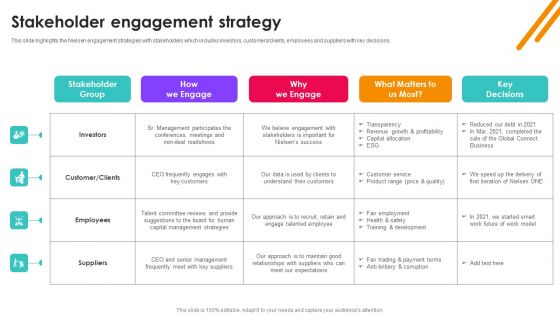
Nielsen Business Profile Stakeholder Engagement Strategy Ppt PowerPoint Presentation Diagram Graph Charts PDF
This slide highlights the Nielsen engagement strategies with stakeholders which includes investors, customers or clients, employees and suppliers with key decisions. The Nielsen Business Profile Stakeholder Engagement Strategy Ppt PowerPoint Presentation Diagram Graph Charts PDF is a compilation of the most recent design trends as a series of slides. It is suitable for any subject or industry presentation, containing attractive visuals and photo spots for businesses to clearly express their messages. This template contains a variety of slides for the user to input data, such as structures to contrast two elements, bullet points, and slides for written information. Slidegeeks is prepared to create an impression.
-
Semantic Web Business Framework Advantages IT Knowledge Graphs The Next Reincarnation Themes PDF
This slide depicts the overview of knowledge graphs which are the next level of the semantic web, and they bring semantic web prototype to the workplace. It also includes that ontologies are used in business knowledge graphs for creating diverse conceptual models. Explore a selection of the finest Semantic Web Business Framework Advantages IT Knowledge Graphs The Next Reincarnation Themes PDF here. With a plethora of professionally designed and pre-made slide templates, you can quickly and easily find the right one for your upcoming presentation. You can use our Semantic Web Business Framework Advantages IT Knowledge Graphs The Next Reincarnation Themes PDF to effectively convey your message to a wider audience. Slidegeeks has done a lot of research before preparing these presentation templates. The content can be personalized and the slides are highly editable. Grab templates today from Slidegeeks.
-
Investment Information Pitchbook Icon With Businessmen Explaining Company Graphs Infographics PDF
Persuade your audience using this Investment Information Pitchbook Icon With Businessmen Explaining Company Graphs Infographics PDF. This PPT design covers Three stages, thus making it a great tool to use. It also caters to a variety of topics including Businessmen, Explaining Company Graphs. Download this PPT design now to present a convincing pitch that not only emphasizes the topic but also showcases your presentation skills.
-
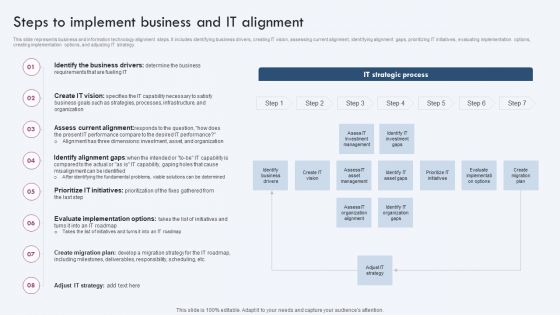
Steps To Implement Business And IT Alignment Ppt PowerPoint Presentation Diagram Graph Charts PDF
This slide represents business and information technology alignment steps. It includes identifying business drivers, creating IT vision, assessing current alignment, identifying alignment gaps, prioritizing IT initiatives, evaluating implementation options, creating implementation options, and adjusting IT strategy. Crafting an eye catching presentation has never been more straightforward. Let your presentation shine with this tasteful yet straightforward Steps To Implement Business And IT Alignment Ppt PowerPoint Presentation Diagram Graph Charts PDF template. It offers a minimalistic and classy look that is great for making a statement. The colors have been employed intelligently to add a bit of playfulness while still remaining professional. Construct the ideal Steps To Implement Business And IT Alignment Ppt PowerPoint Presentation Diagram Graph Charts PDF that effortlessly grabs the attention of your audience Begin now and be certain to wow your customers.
-
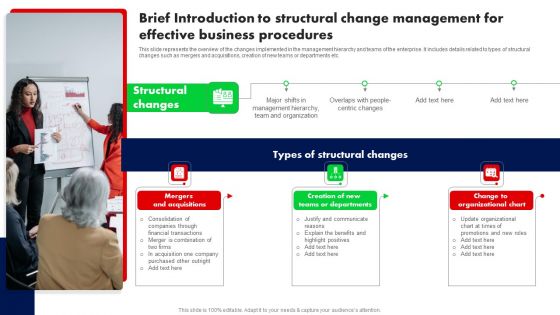
Brief Introduction To Structural Change Management For Effective Business Procedures Ppt PowerPoint Presentation Diagram Graph Charts PDF
This slide represents the overview of the changes implemented in the management hierarchy and teams of the enterprise. It includes details related to types of structural changes such as mergers and acquisitions, creation of new teams or departments etc. Want to ace your presentation in front of a live audience Our Brief Introduction To Structural Change Management For Effective Business Procedures Ppt PowerPoint Presentation Diagram Graph Charts PDF can help you do that by engaging all the users towards you. Slidegeeks experts have put their efforts and expertise into creating these impeccable powerpoint presentations so that you can communicate your ideas clearly. Moreover, all the templates are customizable, and easy to edit and downloadable. Use these for both personal and commercial use.
-
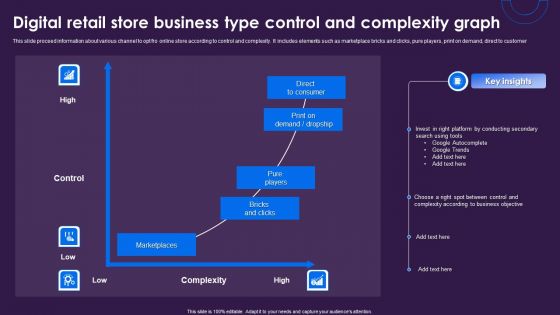
Digital Retail Store Business Type Control And Complexity Graph Sample PDF
This slide proceed information about various channel to opt fro online store according to control and complexity. It includes elements such as marketplace bricks and clicks, pure players, print on demand, direct to customer. Showcasing this set of slides titled Digital Retail Store Business Type Control And Complexity Graph Sample PDF. The topics addressed in these templates are Google Autocomplete, Google Trends, Conducting Secondary. All the content presented in this PPT design is completely editable. Download it and make adjustments in color, background, font etc. as per your unique business setting.
-
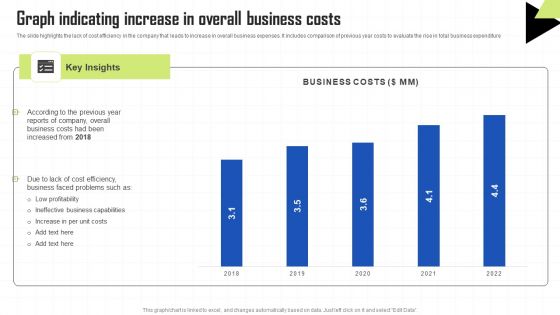
Key Techniques To Enhance Cost Efficiency Graph Indicating Increase In Overall Business Costs Structure PDF
The slide highlights the lack of cost efficiency in the company that leads to increase in overall business expenses. It includes comparison of previous year costs to evaluate the rise in total business expenditure Welcome to our selection of the Key Techniques To Enhance Cost Efficiency Graph Indicating Increase In Overall Business Costs Structure PDF. These are designed to help you showcase your creativity and bring your sphere to life. Planning and Innovation are essential for any business that is just starting out. This collection contains the designs that you need for your everyday presentations. All of our PowerPoints are 100 percent editable, so you can customize them to suit your needs. This multi purpose template can be used in various situations. Grab these presentation templates today.
-
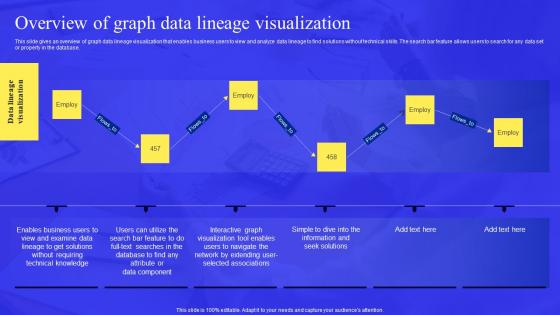
Business Process Data Lineage Overview Of Graph Data Lineage Visualization Microsoft Pdf
This slide gives an overview of graph data lineage visualization that enables business users to view and analyze data lineage to find solutions without technical skills. The search bar feature allows users to search for any data set or property in the database. There are so many reasons you need a Business Process Data Lineage Overview Of Graph Data Lineage Visualization Microsoft Pdf. The first reason is you can not spend time making everything from scratch, Thus, Slidegeeks has made presentation templates for you too. You can easily download these templates from our website easily.
-
Dough Nut Graph Operational Operations Strategy Improve Business Productivity Structure Pdf
If your project calls for a presentation, then Slidegeeks is your go to partner because we have professionally designed, easy to edit templates that are perfect for any presentation. After downloading, you can easily edit Dough Nut Graph Operational Operations Strategy Improve Business Productivity Structure Pdf and make the changes accordingly. You can rearrange slides or fill them with different images. Check out all the handy templates
-
Dough Nut Graph For Operational Business Performance Optimization New Operations Strategy Brochure Pdf
If you are looking for a format to display your unique thoughts, then the professionally designed Dough Nut Graph For Operational Business Performance Optimization New Operations Strategy Brochure Pdf is the one for you. You can use it as a Google Slides template or a PowerPoint template. Incorporate impressive visuals, symbols, images, and other charts. Modify or reorganize the text boxes as you desire. Experiment with shade schemes and font pairings. Alter, share or cooperate with other people on your work. Download Dough Nut Graph For Operational Business Performance Optimization New Operations Strategy Brochure Pdf and find out how to give a successful presentation. Present a perfect display to your team and make your presentation unforgettable.
-
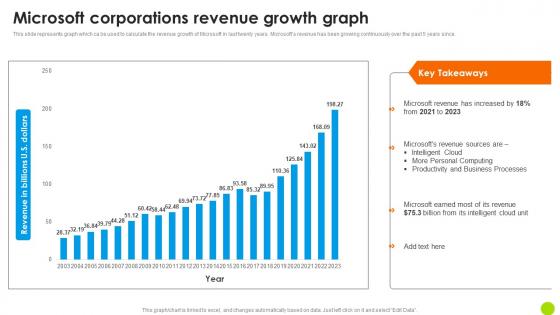
Microsoft Corporations Revenue Growth Graph Microsoft Long Term Business Professional PDF
This slide represents graph which ca be used to calculate the revenue growth of Microsoft in last twenty years. Microsofts revenue has been growing continuously over the past 5 years since. Presenting this PowerPoint presentation, titled Microsoft Corporations Revenue Growth Graph Microsoft Long Term Business Professional PDF, with topics curated by our researchers after extensive research. This editable presentation is available for immediate download and provides attractive features when used. Download now and captivate your audience. Presenting this Microsoft Corporations Revenue Growth Graph Microsoft Long Term Business Professional PDF. Our researchers have carefully researched and created these slides with all aspects taken into consideration. This is a completely customizable Microsoft Corporations Revenue Growth Graph Microsoft Long Term Business Professional PDF that is available for immediate downloading. Download now and make an impact on your audience. Highlight the attractive features available with our PPTs.


