Graph bar PowerPoint Presentation Templates and Google Slides
-
Bar Graph Ppt PowerPoint Presentation Inspiration Microsoft
This is a bar graph ppt powerpoint presentation inspiration microsoft. This is a five stage process. The stages in this process are business, marketing, graph, management, growth.
-
Bar Graph Ppt PowerPoint Presentation Visual Aids Styles
This is a bar graph ppt powerpoint presentation visual aids styles. This is a five stage process. The stages in this process are finance, analysis, planning, business, process.
-
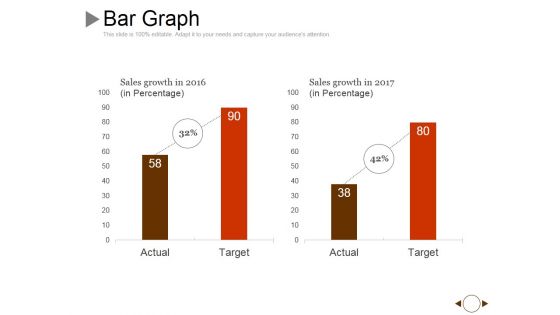
Bar Graph Ppt PowerPoint Presentation Pictures Graphic Images
This is a bar graph ppt powerpoint presentation pictures graphic images. This is a two stage process. The stages in this process are actual, target, growth, success.
-
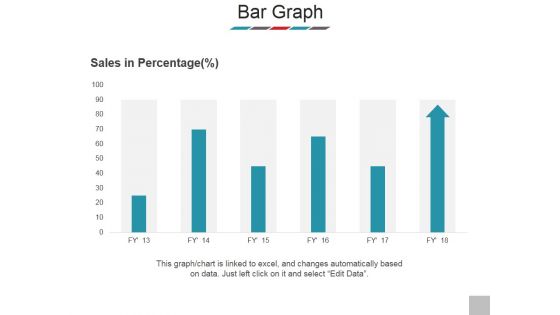
Bar Graph Ppt PowerPoint Presentation Model Clipart
This is a bar graph ppt powerpoint presentation model clipart. This is a six stage process. The stages in this process are sales in percentage, product, bar graph, business, marketing.
-
Bar Graph Ppt PowerPoint Presentation Layouts Layouts
This is a bar graph ppt powerpoint presentation layouts layouts. This is a five stage process. The stages in this process are product, financial years, business, graph, marketing.
-
Growing Arrow On Bar Graph Vector Icon Ppt PowerPoint Presentation Designs Cpb
This is a growing arrow on bar graph vector icon ppt powerpoint presentation designs cpb . This is a three stage process. The stages in this process are bar chart icon, bar graph icon, data chart icon.
-
Growth Arrow On Bar Graph Vector Ppt Powerpoint Presentation Layouts Master Slide
This is a growth arrow on bar graph vector ppt powerpoint presentation layouts master slide. This is a three stage process. The stages in this process are increasing arrows, improving arrows, growing arrows.
-
Red Upward Arrow On Bar Graph Ppt Powerpoint Presentation Infographics
This is a red upward arrow on bar graph ppt powerpoint presentation infographics. This is a four stage process. The stages in this process are increasing arrows, improving arrows, growing arrows.
-
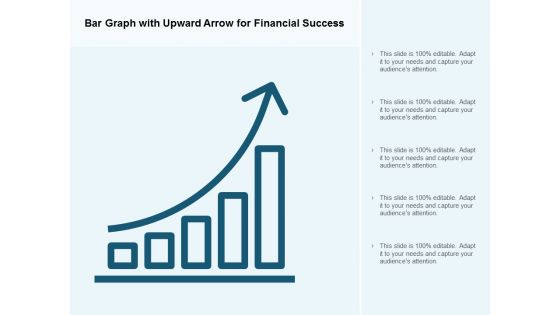
Bar Graph With Upward Arrow For Financial Success Ppt PowerPoint Presentation Infographic Template Model
This is a bar graph with upward arrow for financial success ppt powerpoint presentation infographic template model. This is a five stage process. The stages in this process are rising arrow, growing arrow, increasing arrow.
-
Bar Graph With Star For Business Achievements Ppt Powerpoint Presentation Icon Graphics Template
This is a bar graph with star for business achievements ppt powerpoint presentation icon graphics template. The topics discussed in this diagram are annual goal, yearly goal, annual target. This is a completely editable PowerPoint presentation, and is available for immediate download.
-
Business Outcomes Vector Icons Showing Pie And Bar Graph Ppt PowerPoint Presentation File Vector
Presenting this set of slides with name business outcomes vector icons showing pie and bar graph ppt powerpoint presentation file vector. This is a three stage process. The stages in this process are business outcomes, business results, business output. This is a completely editable PowerPoint presentation and is available for immediate download. Download now and impress your audience.
-
Horizontal Bar Graph Vector Icon Ppt PowerPoint Presentation File Template
Presenting this set of slides with name horizontal bar graph vector icon ppt powerpoint presentation file template. The topics discussed in these slides are data icon, status icon, status symbol icon. This is a completely editable PowerPoint presentation and is available for immediate download. Download now and impress your audience.
-
Bar Graph Icon For Research Analysis Ppt PowerPoint Presentation Summary Portfolio
Presenting this set of slides with name bar graph icon for research analysis ppt powerpoint presentation summary portfolio. This is a three stage process. The stages in this process are data visualization icon, research analysis, business focus. This is a completely editable PowerPoint presentation and is available for immediate download. Download now and impress your audience.
-
Performance Monitoring Vector Icon Bar Graph In Magnifying Glass Ppt PowerPoint Presentation Summary Gallery
Presenting this set of slides with name performance monitoring vector icon bar graph in magnifying glass ppt powerpoint presentation summary gallery. This is a one stage process. The stages in this process are growth, improvement, enhancement. This is a completely editable PowerPoint presentation and is available for immediate download. Download now and impress your audience.
-
Water Drops With Bar Graph Vector Icon Ppt PowerPoint Presentation Slides Clipart Images
Presenting this set of slides with name water drops with bar graph vector icon ppt powerpoint presentation slides clipart images. The topics discussed in these slides are water drops, rainfall, window glass. This is a completely editable PowerPoint presentation and is available for immediate download. Download now and impress your audience.
-
Gantt Chart Bar Graph Ppt PowerPoint Presentation Summary Rules
Presenting this set of slides with name gantt chart bar graph ppt powerpoint presentation summary rules. The topics discussed in these slides are marketing, business, management, planning, strategy. This is a completely editable PowerPoint presentation and is available for immediate download. Download now and impress your audience.
-
Bar Graph For Business Growth Steps Powerpoint Slides
This PowerPoint template contains design of bar graph with icons. You may download this slide to display strategy steps for business growth. You can easily customize this template to make it more unique as per your need.
-
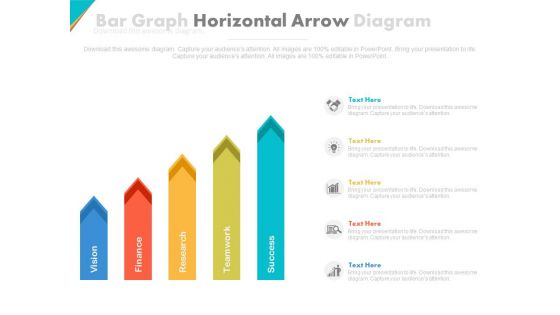
Five Horizontal Arrows Bar Graph Powerpoint Slides
This PowerPoint template contains five horizontal arrows bra graph. You may download this PPT slide design to display steps of strategic planning. You can easily customize this template to make it more unique as per your need.
-
Bar Graph Displaying Profit Growth Powerpoint Slides
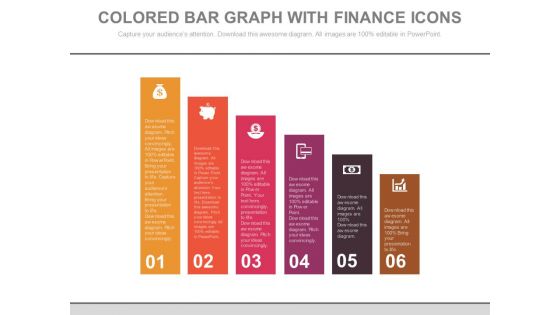
This PowerPoint template has been designed with six point?s bar graph with icons. This PPT slide can be used to prepare presentations for marketing reports and also for financial data analysis. You can download finance PowerPoint template to prepare awesome presentations.
-
Bar Graph For Marketing Research Data Powerpoint Slides
This PowerPoint template has been designed with diagram of bar graph. This PPT slide can be used to prepare presentations for profit growth report and also for financial data analysis. You can download finance PowerPoint template to prepare awesome presentations.
-
Bar Graph For Marketing Research Process Powerpoint Slides
This PowerPoint template has been designed with diagram of bar graph. This PPT slide can be used to prepare presentations for profit growth report and also for financial data analysis. You can download finance PowerPoint template to prepare awesome presentations.
-
Bar Graph With Line Chart For Analysis Powerpoint Slides
This PowerPoint template contains design of bar graph with line chart. You may download this slide to display strategy steps for business growth. You can easily customize this template to make it more unique as per your need.
-
Bar Graph With Yearly Statistical Analysis Powerpoint Slides
This PowerPoint template contains diagram of bar graph with yearly percentage ratios. You may download this slide to display statistical analysis. You can easily customize this template to make it more unique as per your need.
-
Bar Graph For Statistical Analysis Powerpoint Slides
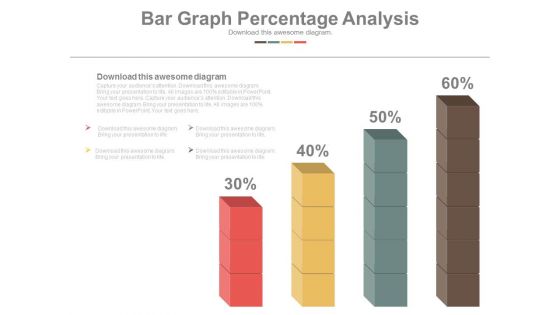
This PowerPoint template has been designed with bar chart and percentage values. You may download this PPT slide to depict statistical analysis. Add this slide to your presentation and impress your superiors.
-
Bar Graph To Compare Business Data PowerPoint Slides
This is the slide which can solve many purposes of yours. Be it growth in your company, need to show your company?s status in the market as compared to others, or how your business has improved so far. An ideal PowerPoint template to display all of these. You can easily use this graph to show the growth of your company using the percentage icons. You can use this visual to show the status of your company in the market in comparison with others. You can edit the icons and replace them with the logo of your company and the others. You can also show it to your colleagues how your company has built its image in the market or how it has improved over the time. A perfect bar graph image which needs to be included in your business PPT presentations.
-
Bar Graph For Year Based Analysis Powerpoint Slides
This PowerPoint template has been designed with year based bar graph. This diagram may be used to display yearly statistical analysis. Use this PPT slide design to make impressive presentations.
-
Bar Graph With Five Icons Powerpoint Slides
This PowerPoint slide contains diagram bar graph with icons. This PPT slide helps to exhibit concepts of financial deal and planning. Use this business slide to make impressive presentations.
-
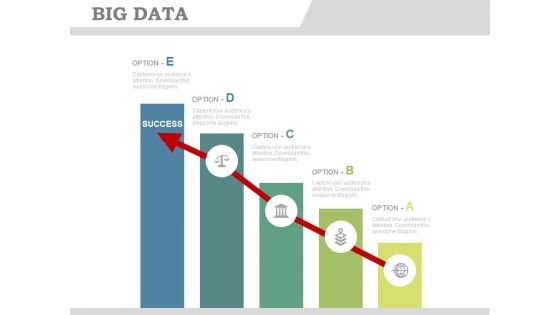
Bar Graph Infographics With Success Arrow Powerpoint Slides
This PowerPoint template has been designed with bar graph with success arrow. You may use this PPT slide to display goal achievement and planning. Impress your audiences by using this PPT slide.
-
Bar Graph For Profit Growth Analysis Powerpoint Slides
This PowerPoint template has been designed with bar graph with percentage values. This diagram is useful to exhibit profit growth analysis. This diagram slide can be used to make impressive presentations.
-
Five Steps Bar Graph For Financial Management Powerpoint Slides
This PowerPoint template has been designed with five steps bar graph and icons. This diagram is useful to exhibit financial management. This diagram slide can be used to make impressive presentations.
-
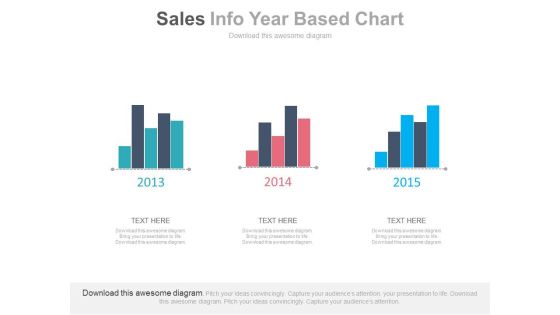
Three Years Sales Data Bar Graph Powerpoint Slides
This PowerPoint template has been designed with bar charts. This business slide may be used to display three years sales data for comparison. Present your views and ideas with this impressive design.
-
Map Diagram With Bar Graph And Icons Powerpoint Slides
This PowerPoint template displays graphics of map diagram with bar graph and icons. This Map template can be used in business presentations to depict economic analysis. This slide can also be used by school students for educational projects.
-
World Map With Bar Graph And Higher Population Areas Powerpoint Slides
This professionally designed PowerPoint template is as an effective tool to display high population areas on world. You can download this diagram to visually support your content. Above PPT slide is suitable for business presentation.
-
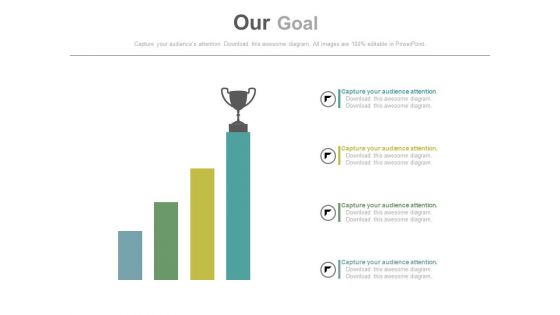
Growth Bar Graph With Trophy On Top Powerpoint Slides
This PowerPoint template has been designed with growth bar graph and trophy onto of it. Download this PPT slide to define and achieve goals with more success. This diagram may be used for goal planning related topics.
-
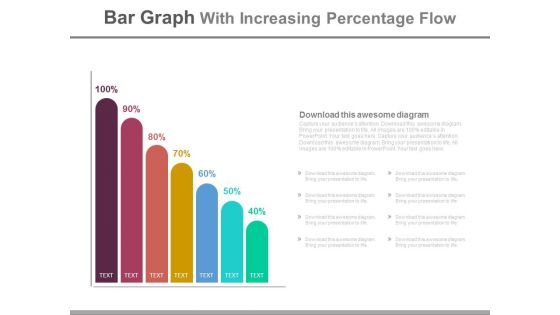
Bar Graph With Increasing Percentage Flow Powerpoint Slides
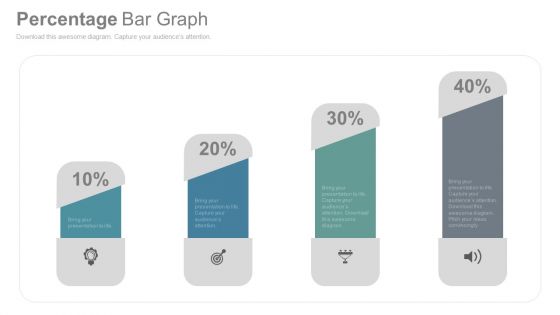
This PowerPoint slide has been designed with bar graph and increasing percentage values. This diagram slide may be used to display profit growth. Prove the viability of your ideas with this professional slide.
-
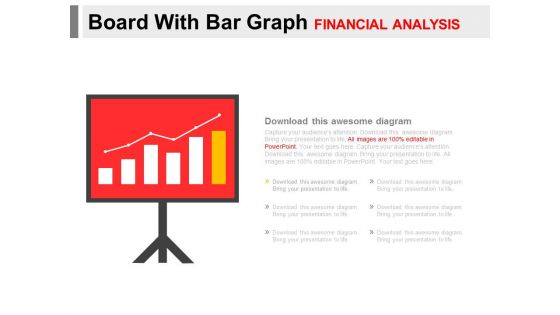
Board With Bar Graph For Financial Analysis Powerpoint Slides
You can download this PowerPoint template to display statistical data and analysis. This PPT slide contains display board with bar graph. Draw an innovative business idea using this professional diagram.
-
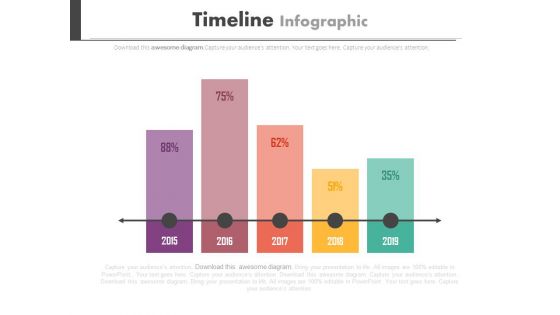
Timeline Bar Graph For Yearly Planning Powerpoint Slides
This PowerPoint template has been designed with timeline bar graph. You may download this timeline diagram slide to display long term planning for business. Chart the course you intend to take with this slide.
-
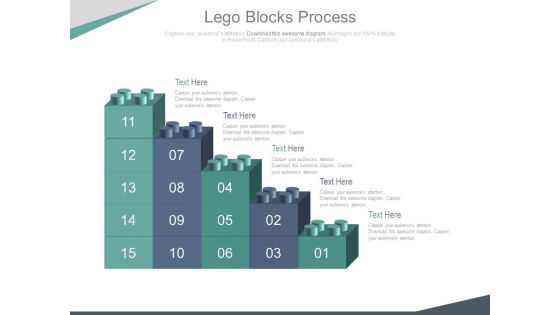
Bar Graph Of Lego Blocks For Data Analysis Powerpoint Slides
This PowerPoint template contains bar graph made of Lego blocks. You may use this slide to display growth process. This diagram provides an effective way of displaying information you can edit text, color, shade and style as per you need.
-
Bar Graph With Financial Ratio And Icons Powerpoint Template
Visually support your presentation with our above template containing bar graph with icons. This diagram slide helps to exhibit financial ratio analysis. Etch your views in the brains of your audience with this diagram slide.
-
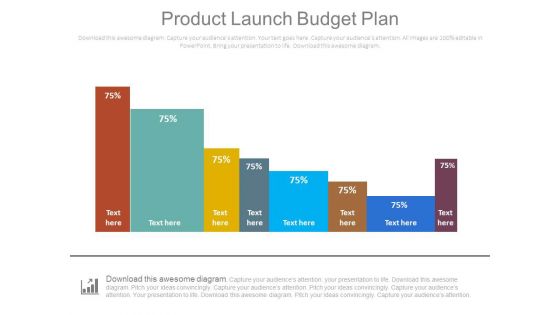
Product Launch Budget Plan Bar Graph Ppt Slides
This is a product launch budget plan bar graph ppt slides. This is a eight stage process. The stages in this process are business, finance, marketing.
-
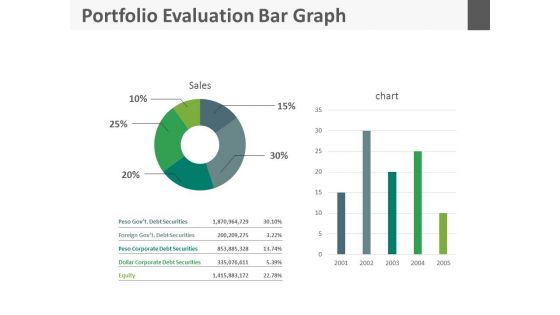
Portfolio Evaluation Bar Graph Ppt Slides
This is a portfolio evaluation bar graph ppt slides. This is a five stage process. The stages in this process are business, finance, marketing.
-
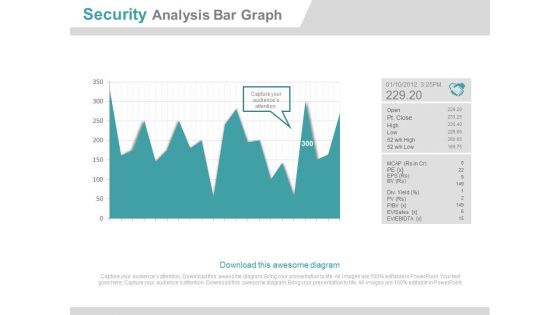
Security Analysis Bar Graph Ppt Slides
This is a security analysis bar chart ppt slides. This is a one stage process. The stages in this process are business, finance, marketing.
-
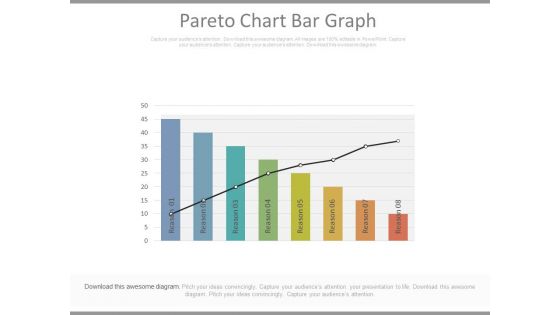
Pareto Chart Bar Graph Ppt Slides
This is a pareto chart bar graph ppt slides. This is a eight stage process. The stages in this process are business, marketing, success.\n
-
Last 90 Days Results Bar Graph Ppt Slides
This is a last 90 days results bar graph ppt slides. This is a three stage process. The stages in this process are arrows, business, marketing.
-
Profit Growth Bar Graph Over The Years Powerpoint Slide Graphics
This is a profit growth bar graph over the years powerpoint slide graphics. This is a four stage process. The stages in this process are bar graph, arrows, years, business, growth, marketing.
-
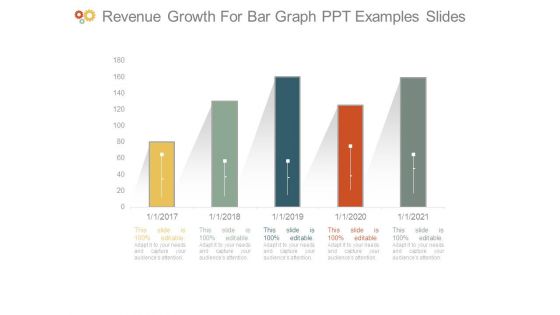
Revenue Growth For Bar Graph Ppt Examples Slides
This is a revenue growth for bar graph ppt examples slides. This is a five stage process. The stages in this process are bar graph, years, business, growth, marketing.
-
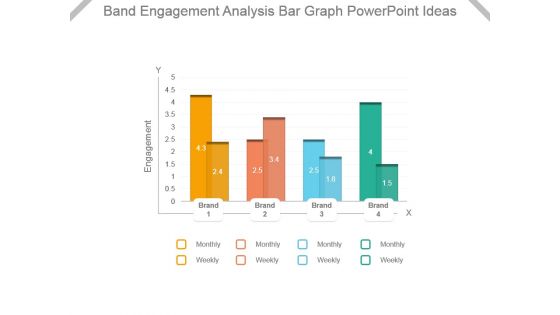
Band Engagement Analysis Bar Graph Powerpoint Ideas
This is a band engagement analysis bar graph powerpoint ideas. This is a four stage process. The stages in this process are engagement, brand, monthly, weekly.
-
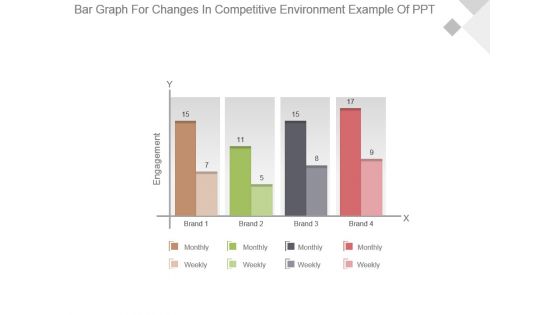
Bar Graph For Changes In Competitive Environment Example Of Ppt
This is a bar graph for changes in competitive environment example of ppt. This is a four stage process. The stages in this process are engagement, brand, monthly, weekly.
-
Bar Graph With Total Profit Analysis Ppt Images
This is a bar graph with total profit analysis ppt images. This is a nine stage process. The stages in this process are bar graph, business, marketing, growth, success.
-
Competitive Environment Analysis Bar Graph Ppt Slide Templates
This is a competitive environment analysis bar graph ppt slide templates. This is a one stage process. The stages in this process are engagement, brand, monthly, weekly.
-
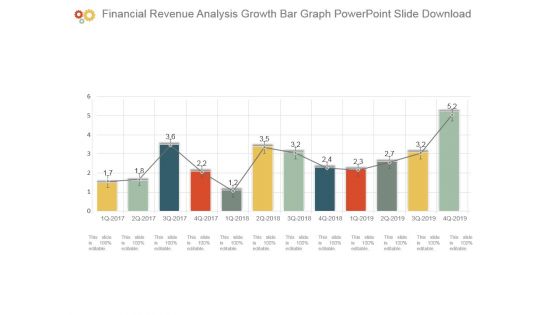
Financial Revenue Analysis Growth Bar Graph Powerpoint Slide Download
This is a financial revenue analysis growth bar graph powerpoint slide download. This is a twelve stage process. The stages in this process are bar graph, business, marketing, growth, success.
-
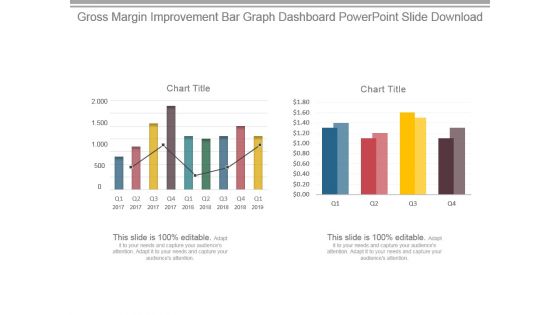
Gross Margin Improvement Bar Graph Dashboard Powerpoint Slide Download
This is a gross margin improvement bar graph dashboard powerpoint slide download. This is a two stage process. The stages in this process are chart title.
-
Hiring Plan Bar Graph Ppt Infographics
This is a hiring plan bar graph ppt infographics. This is a five stage process. The stages in this process are finance, support, product, marketing, sales, engineering.
-
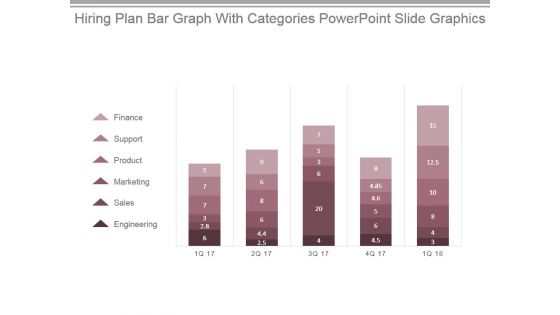
Hiring Plan Bar Graph With Categories Powerpoint Slide Graphics
This is a hiring plan bar graph with categories powerpoint slide graphics. This is a five stage process. The stages in this process are finance, support, product, marketing, sales, engineering.
-
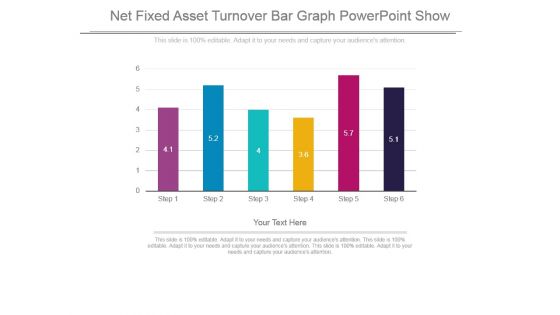
Net Fixed Asset Turnover Bar Graph Powerpoint Show
This is a net fixed asset turnover bar graph powerpoint show. This is a six stage process. The stages in this process are bar graph, presentation, strategy, business, management.
-
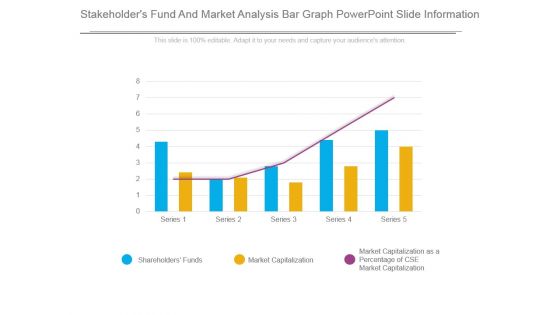
Stakeholders Fund And Market Analysis Bar Graph Powerpoint Slide Information
This is a stakeholders fund and market analysis bar graph powerpoint slide information. This is a five stage process. The stages in this process are shareholders funds, market capitalization, market capitalization as a percentage of cse market capitalization.
-
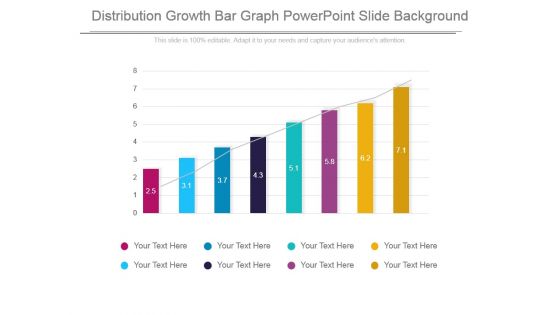
Distribution Growth Bar Graph Powerpoint Slide Background
This is a distribution growth bar graph powerpoint slide background. This is a eight stage process. The stages in this process are growth, bar graph, business, marketing, success.
-
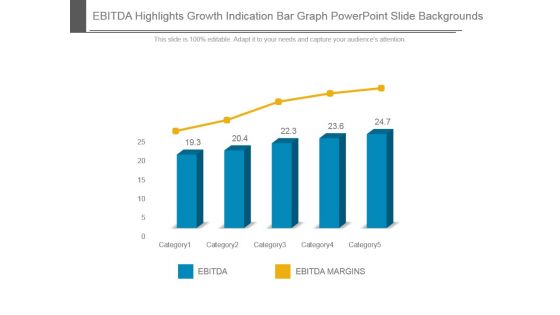
Ebitda Highlights Growth Indication Bar Graph Powerpoint Slide Backgrounds
This is a ebitda highlights growth indication bar graph powerpoint slide backgrounds. This is a five stage process. The stages in this process are ebitda, ebitda margins, category.
-
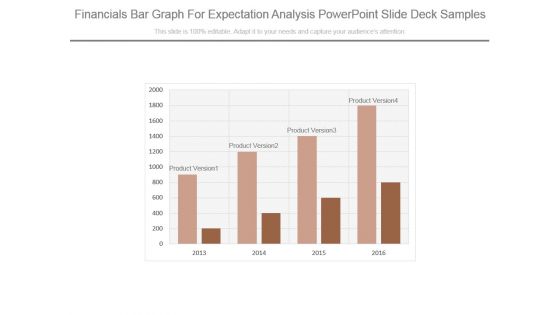
Financials Bar Graph For Expectation Analysis Powerpoint Slide Deck Samples
This is a financials bar graph for expectation analysis powerpoint slide deck samples. This is a four stage process. The stages in this process are product version.
-
Inflation Rate Analysis Bar Graph Powerpoint Slide Backgrounds
This is a inflation rate analysis bar graph powerpoint slide backgrounds. This is a twelve stage process. The stages in this process are jan, feb, mar, apr, may, jun, jul, aug, sep, oct, nov, dec.


