Graph bar PowerPoint Presentation Templates and Google Slides
-
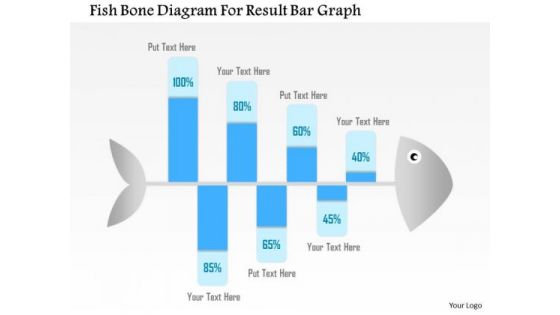
Business Diagram Fish Bone Diagram For Result Bar Graph Presentation Template
Graphic of fish bone has been used to design this Power Point template slide. This PPT slide contains the concept of problem analysis and root cause analysis. Use this PPT slide and display process of root cause analysis for any field. This PPT slide is very well designed for business and production related problem analysis.
-
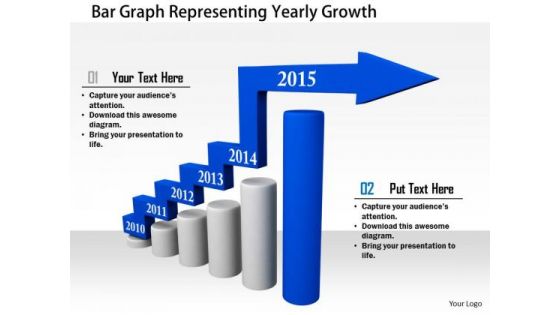
Stock Photo Bar Graph Representing Yearly Growth PowerPoint Slide
This Power Point image template slide has been crafted with graphic of bar graph and arrow. This image slide template contains the concept of yearly growth. Use this image slide and build exclusive presentation for your viewers.
-
Stock Photo Pie And Bar Graph With 2015 PowerPoint Slide
This Power Point image template slide has been crafted with graphic of pie and bar graph and 2015 year text. This PPT slide contains the concept of business and financial analysis. Use this image slide and build quality presentation for your viewers.
-
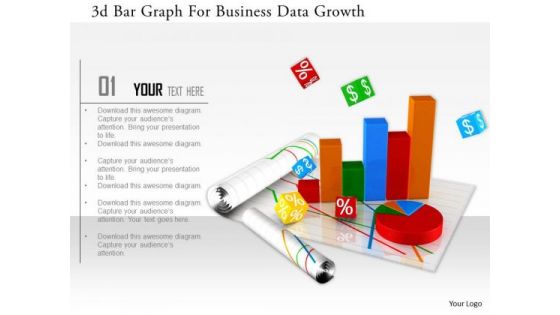
Stock Photo 3d Bar Graph For Business Data Growth Image Graphics For PowerPoint Slide
This image slide has graphics of financial charts and reports. This contains bar graph and pie chart to present business reports. Build an innovative presentations using this professional image slide.
-
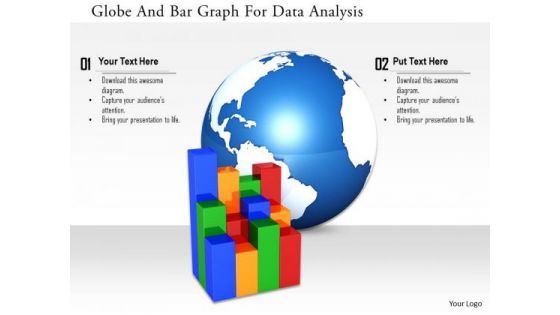
Stock Photo Globe And Bar Graph For Data Analysis Image Graphics For PowerPoint Slide
This image slide has been designed with business graph with globe in background. This image slide represents topics like global business, economic growth. This image will enhance the quality of your presentations.
-
Stock Photo World Map On Bar Graph For Data Growth Image Graphics For PowerPoint Slide
This image is designed with blue graph with world map printed on it. This conceptual image portrays the concepts of global business and global economy. This image slide will help you express your views to target audience.
-
Business Diagram 3d Graphic Colored Bar Graph For Business Result Analysis Presentation Template
This Power Point template has been designed with graphic of 3d graphic and colored bar graph. Use this slide to represent six steps of any business process. Use this diagram for your business presentations and get exclusive comments on your efforts.
-
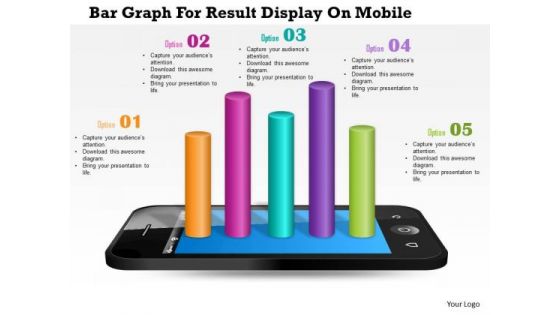
Business Diagram Bar Graph For Result Display On Mobile Presentation Template
This Power Point template has been designed with graphic of bar graph on mobile phone. This business diagram can be used to make business reports. Download this Power Point slide to build quality presentation for your viewers.
-
Business Diagram Bar Graph With Text Boxes For Data Display Presentation Template
Our above business diagram displays bar graph. It contains four steps on bar graph with icons. Use this diagram to display four stages of business growth. Download this Power Point slide to build quality presentation for your viewers.
-
Business Diagram Business Bar Graph For Data Analysis Presentation Template
This business slide displays pie charts with percentage ratios. This diagram is a data visualization tool that gives you a simple way to present statistical information. This slide helps your audience examines and interprets the data you present.
-
Stock Photo Bar Graph With Percentage For Finance PowerPoint Slide
This Power Point template has been designed with graphic of bar graph and percentage value. This image slide contains the concept of finance and accounting. Use this editable diagram for your business and finance related presentations.
-
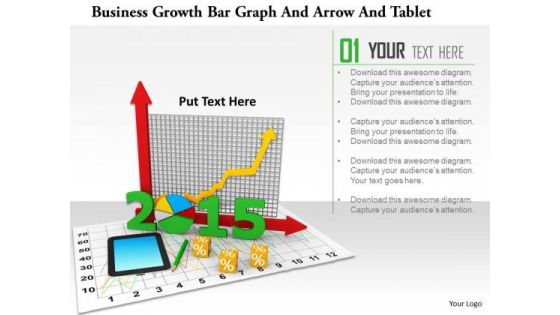
Stock Photo Business Growth Bar Graph And Arrow And Tablet PowerPoint Slide
This PowerPoint template has been designed with graphic of bar graph and arrow with tablet. This unique image slide depicts the concept of business growth and success. Use this image slide to build exclusive presentation for your viewers.
-
3d Man Running On Blue Growth And Bar Graph
This image slide has been designed with graphic of 3d man on blue arrow moving towards bar graph. This professional slide contains the concept of growth and success. Use this editable slide to depict business growth.
-
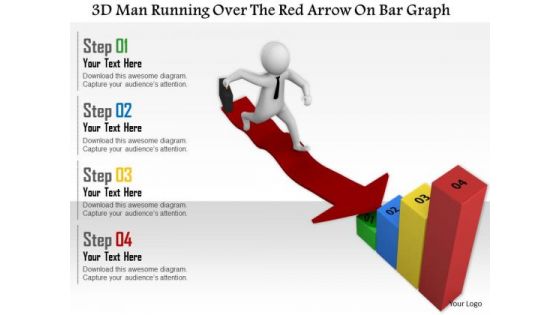
3d Man Running Over The Red Arrow On Bar Graph
This image slide has been designed with graphic of 3d man on red arrow moving towards bar graph. This professional slide contains the concept of growth and success. Use this editable slide to depict business growth.
-
Bar Graph With Growth Arrow And 3d Man
This image slide has been crafted with graphic of bar graph and arrow. In this slide arrow is representing the concept of growth. Use this editable slide to display business growth.
-
Green Growth Arrow 3d Man With Bar Graph
Our above image slide displays 3d man climbing on growth arrow. This conceptual image contains the concept of growth. We have also used graphic of bar graph which can be used to display business progress. Build an innovative presentation using this professional image slide.
-
3d Man With Blue Bar Graph And Red Growth Arrow
This Power Point diagram has been designed with graphic of 3d man and business graphs. This conceptual image can be used to displays business progress and growth. Use this editable slide for business and sales growth related presentations.
-
Business Diagram Bar Graph Cube Bars Icons Presentation Template
This diagram displays four staged bar graph with icons. It contains bar graph to present four stages of any business process. Use this professional and customized business diagram in your PowerPoint presentations.
-
Business Diagram Bar Graph In Descending Order Presentation Template
This diagram displays bar graph in descending order. It contains bar graph with icons depicting decline in business profit. Download this diagram as a tool for business presentations.
-
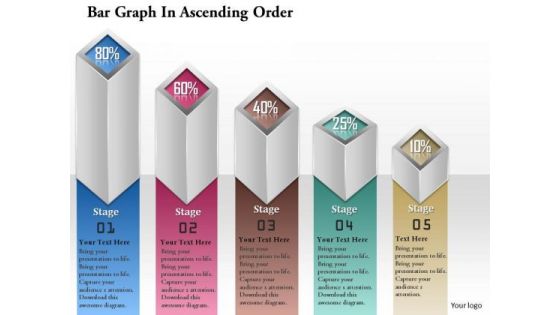
Business Diagram Bar Graph With Ascending Order Presentation Template
Our above diagram displays bar graph in ascending order. It contains bar graph with business icons. Use this amazing diagram for business communication or to present business reports. Download this diagram as a tool for business presentations.
-
Linear Bar Graph Made With Puzzle Pieces For Result Analysis Presentation Template
This Power Point template has been used to show concept of result analysis. This PPT contains the graphic of linear bar graph made with puzzle. Use this PPT for business and sales presentations.
-
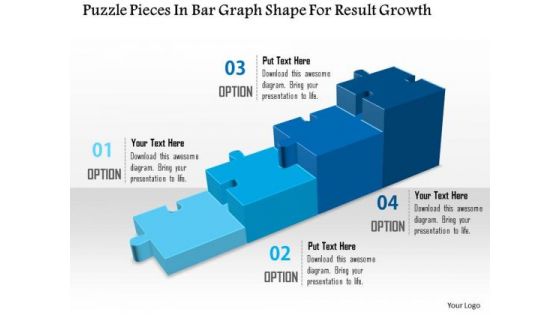
Puzzle Pieces In Bar Graph Shape For Result Growth Presentation Template
Define the growth factor for any business and sales activity with this unique PPT. this PPT has been crafted with graphic of bar graph made with puzzle pieces. Use this PPT for your business and sales presentations.
-
Stock Photo Dollar Symbol Bar Graph With Cubes PowerPoint Slide
This image slide contains bar graph of cubes with dollar symbol. This image is designed with dollar growth graph. Use this slide to display growth of profit in business presentations. Make an impressive presentation by using this image.
-
Stock Photo Chairs Around Table With Bar Graph PowerPoint Slide
The above image shows unique design of chairs around table with bar graph. This professional image of designed to portray concept of business meeting on facts and figures. Employ the right colors for your brilliant ideas. Help your viewers automatically empathize with your thoughts.
-
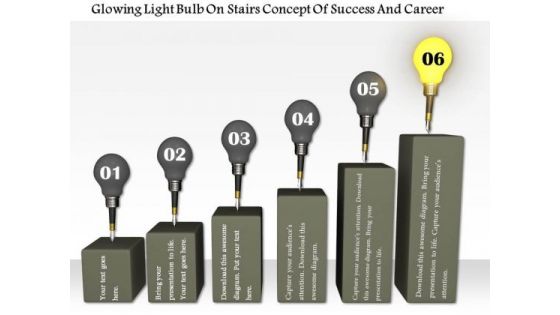
Stock Photo Glowing Bulb On Top Of Bar Graph PowerPoint Slide
This conceptual image slide displays bulbs on bar graph. This image slide has been crafted with graphic of bar graph and bulbs and individual glowing bulb. This image slide depicts success and carrier. Use this image slide to express views on leadership, teamwork, success, achievements and growth in your presentations. This image slide may also be used to represent different business strategies. Create beautiful presentations using this image slide.
-
Stock Photo Bar Graph On Circular Web PowerPoint Slide
This image slide displays bar garph on circular web. This image slide helps you to make business and sales related presenations. Deliver amazing presentations to mesmerize your audience.
-
Stock Photo Business Graph With Colorful Bars PowerPoint Slide
This image is designed with business graph with colorful bars. Use this image slide in presentations related to business success, strategy planning etc. This template is innovatively designed to highlight your worthy views.
-
Stock Photo Pie Chart And Bar Graph On Web PowerPoint Slide
This image is designed with pie chart and bar graph on web. Use this diagram to explain your strategy to co-ordinate activities. Deliver amazing presentations to mesmerize your audience.
-
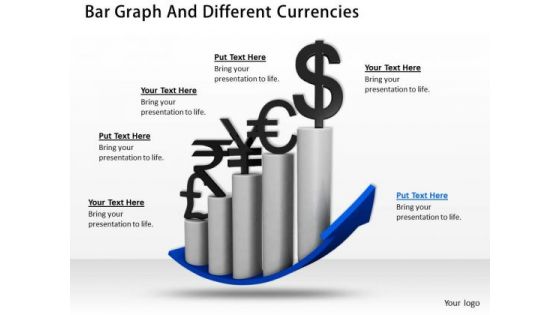
Stock Photo Bar Graph And Different Currencies PowerPoint Slide
This image slide displays bar graph with different currencies symbols. This image has been designed with graphic of bar graph, blue colored growth arrow and symbols of different currencies. Use this image slide, in your presentations to express views on finance, growth and achievements. This image slide may also be used to exhibit finance accounts in your presentations. This image slide will enhance the quality of your presentations.
-
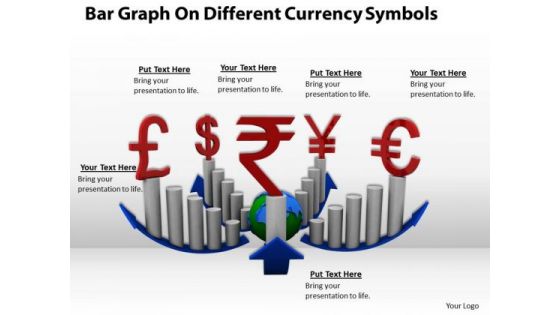
Stock Photo Bar Graph For Currency And Finance PowerPoint Slide
This image slide displays bar graphs with different currency symbols. This image has been designed with graphic of bar graphs, blue colored growth arrow and symbols of different currencies. Use this image slide, in your presentations to express views on finance, growth and achievements. This image slide may also be used to exhibit finance accounts in your presentations. This image slide will enhance the quality of your presentations.
-
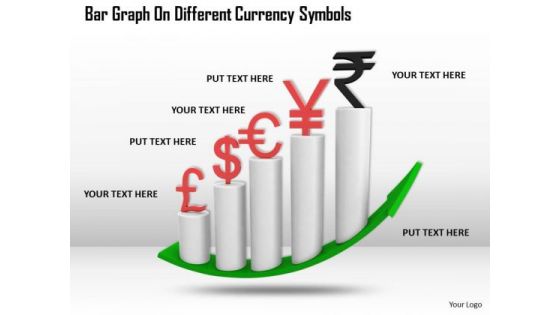
Stock Photo Bar Graph On Different Currency Symbols PowerPoint Slide
This image slide displays bar graph with different currency symbols. This image has been designed with graphic of bar graph, green colored growth arrow and symbols of different currencies. Use this image slide, in your presentations to express views on finance, monetary growth and achievements. This image slide may also be used to exhibit finance accounts in your presentations. This image slide will enhance the quality of your presentations.
-
Stock Photo Bar Graph With Dollar Currency Symbol PowerPoint Slide
This image slide displays bar graph with dollar currency symbol. This image has been designed with graphic of bar graph, red colored growth arrow and symbols of dollar currency. Use this image slide, in your presentations to express views on finance, growth and achievements. This image slide may also be used to exhibit finance accounts in your presentations. This image slide will enhance the quality of your presentations.
-
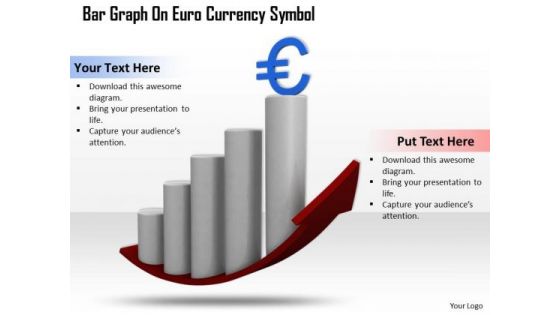
Stock Photo Bar Graph With Euro Currency Symbol PowerPoint Slide
This image slide displays bar graph with euro currency symbol. This image has been designed with graphic of bar graph, red colored growth arrow and symbols of euro currency. Use this image slide, in your presentations to express views on finance, growth and achievements. This image slide may also be used to exhibit finance accounts in your presentations. This image slide will enhance the quality of your presentations.
-
Stock Photo Bar Graph With Grid PowerPoint Slide
This image slide displays bar graph with grid. This image has been designed with graphic of 3d multicolor bar graph. Use this image slide, in your presentations to express views on finance, growth and success. This image slide may also be used to exhibit any information which requires visual presentation in your presentations. This image slide will enhance the quality of your presentations.
-
Stock Photo Bar Graph With Pound Currency Symbol PowerPoint Slide
This image slide displays bar graph with pound currency symbol. This image has been designed with graphic of bar graph, red colored growth arrow and symbols of pound currency. Use this image slide, in your presentations to express views on finance, growth and achievements. This image slide may also be used to exhibit finance accounts in your presentations. This image slide will enhance the quality of your presentations.
-
Stock Photo Bar Graph With Yen Currency Symbol PowerPoint Slide
This image slide displays bar graph with yen currency symbol. This image has been designed with graphic of bar graph, black colored growth arrow and symbols of pound currency. Use this image slide, in your presentations to express views on finance, growth and achievements. This image slide may also be used to exhibit finance accounts in your presentations. This image slide will enhance the quality of your presentations.
-
Stock Photo Blue Bar Graph With Growth Arrow For Business PowerPoint Slide
This image slide displays bar graph with growth arrow. This image has been designed with graphic of blue colored bar graph embedded with growth arrow . Use this image slide, in your presentations to express views on finance, growth and achievements. This image slide may also be used to exhibit any information which requires visual presentation in your presentations. This image slide will enhance the quality of your presentations.
-
Stock Photo Colorful Bar Graph For Business Result Display PowerPoint Slide
This image slide displays bar graph. This image has been designed with graphic of 3d multicolor bar graph of solid cylinder shape. Use this image slide, in your presentations to express views on finance, growth and success. This image slide may also be used to exhibit any information which requires visual presentation in your presentations. This image slide will enhance the quality of your presentations.
-
Stock Photo Globe With Bar Graph For Business PowerPoint Slide
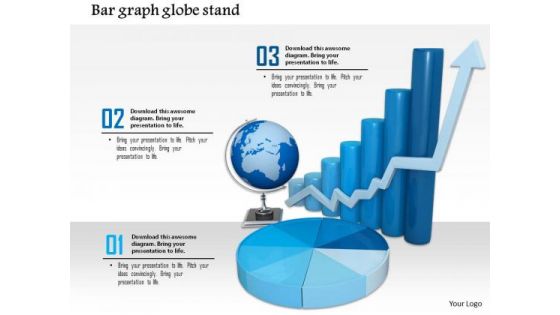
This image slide displays globe with bar graph. This image has been designed with graphic of bar graph, pie char, globe and growth arrow. Use this image slide, in your presentations to express views on finance, global growth and success. This image slide may also be used to exhibit any information which requires visual presentation in your presentations. This image slide will enhance the quality of your presentations.
-
Stock Photo Red Growth Arrow On Bar Graph PowerPoint Slide
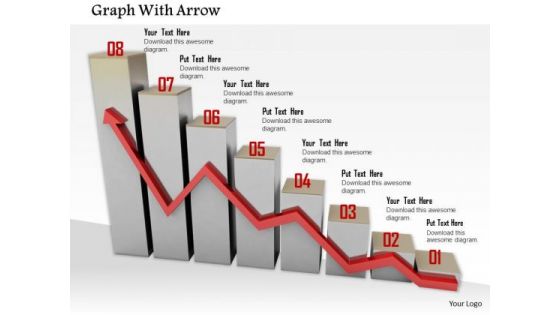
Explain the concepts of business growth with this unique image. This image has been designed with red growth arrow on bar graph. Use this image in business and finance related topics
-
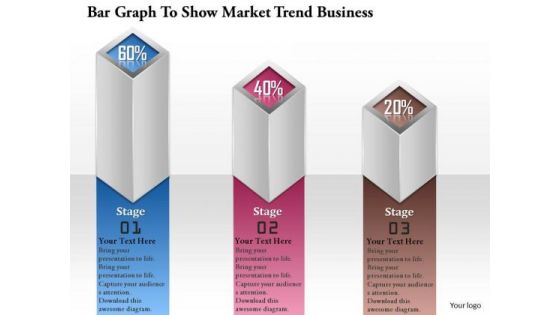
Consulting Slides Bar Graph To Show Market Trend Business Presentation
This bar graph can be very useful in presentations where you need to market trend. This can be used as a visualization tool because the audience can get a better view about what you want to show.
-
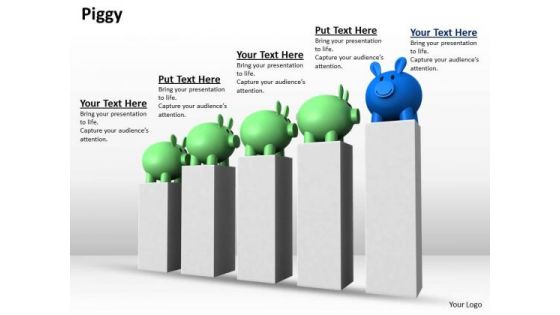
Stock Photo Piggy Banks Of Bar Graph PowerPoint Slide
This image is designed with piggy banks on bar graph. This image portrays the concepts of saving and investment. You may use this image to make outstanding presentations.
-
Stock Photo Arrow Growth Bar Graph On Phone Pwerpoint Slide
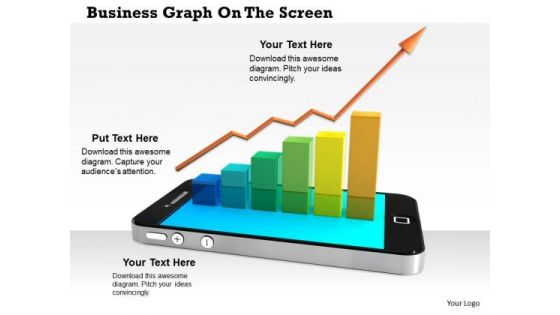
This graphic image has been designed with graphic of smart phone with growth bar graph. This image contains the concept of business growth analysis. Use this image for business and marketing related analysis presentations. Display finance growth analysis in an graphical way with this exclusive image.
-
Five Options Bar Graph With Icons Powerpoint Template
This PowerPoint slide has been designed with five options bar graph and icons. This slide of bar graph is suitable for statistical analysis. This professional slide helps in making an instant impact on viewers.
-
Bar Graph For Future Planning Powerpoint Template
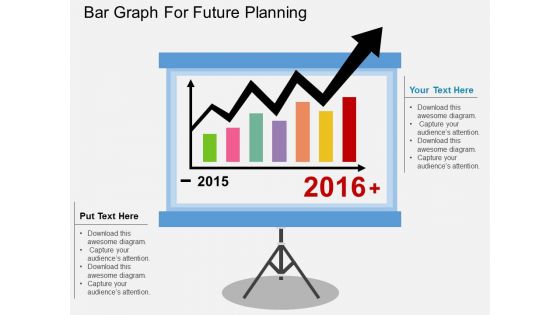
This business diagram display bar graph for years 2015 and 2016. You may use this slide to display statistical analysis. This diagram provides an effective way of displaying information you can edit text, color, shade and style as per you need.
-
Growth Arrow On Bar Graph Infographics Powerpoint Template
This PowerPoint template has been designed with growth arrow on bar graph. You may download this diagram slide to display growth and progress concepts. Illustrate your plans to your listeners with this impressive template.
-
Man On Bar Graph With Ladders For Success Powerpoint Template
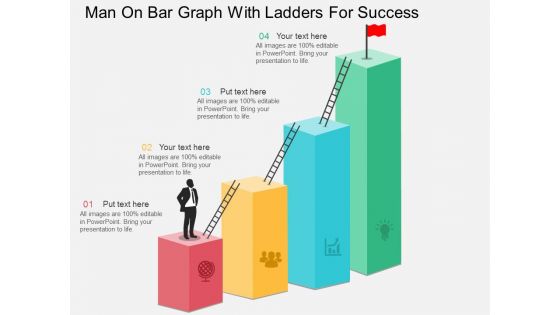
This business slide has been designed with graphics of man on bar graph with ladder. You may download this diagram to display concepts like strategy, management and success. Download this diagram slide to make impressive presentations.
-
Banner Bar Graph For Success Concept Powerpoint Template
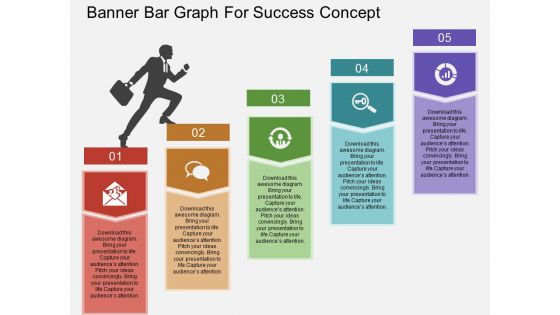
Concepts of success and progress have been displayed in this power point template diagram. This PPT diagram contains the graphic of business man on bar graph. Use this PPT diagram for business and success related presentations.
-
Four Pencils Bar Graph And Icons Powerpoint Template
Develop competitive advantage with our above template which contains a diagram of five pencils bar graph. This diagram provides an effective way of displaying business information. You can edit text, color, shade and style as per you need.
-
Dollar Coins Money Growth Bar Graph Powerpoint Template
Use this PowerPoint template, in your corporate presentations. It contains bar graph of dollar coins. This business slide may be used to exhibit money growth. Make wonderful presentations using this diagram.
-
Dollar Mobile Bar Graph And Monitor Icons In Circles Powerpoint Templates
Our above slide has been designed with dollar, mobile, bar graph and monitor icons. This infographic slide is best to describe text information. You can provide a fantastic explanation of the topic with this slide.
-
Four Banners With Idea Generation Bar Graph Gears Icons Powerpoint Templates
This PPT slide has been designed with four banners. This professional template contains concept of idea generation and analysis. Blend your views with this professional slide.
-
Tablet With Bar Graph And Pie Chart Powerpoint Templates
This business slide has been designed with business graphs on computer tablet. You may download this PPT slide to display statistical analysis. This slide will help you to sequence your thoughts.
-
Bar Graph With Plant For Growth Powerpoint Template
This PowerPoint template has been designed with diagram of bar graph with plant. This infographic template may be used to display growth and progress. Accelerate the impact of your ideas using this template.
-
Infographics With News Mail Microscope Bar Graph Icons Powerpoint Templates
This PowerPoint template has been designed with infographic square. Download this PPT slide to display information in visual manner. Use this diagram to build an exclusive presentation.
-
Bar Graph Infographics For Business Analysis Powerpoint Template
This PowerPoint template contains bar graph with icons. This PPT slide helps to exhibit concepts like strategy, direction and success. Use this business slide to make impressive presentations.
-
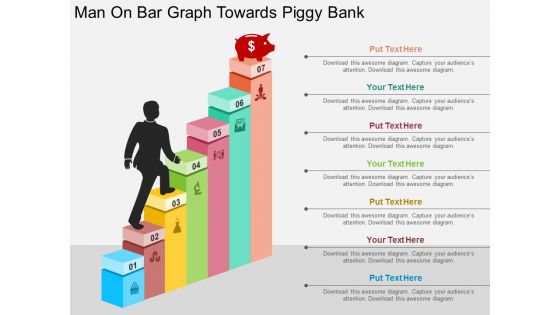
Man On Bar Graph Towards Piggy Bank Powerpoint Templates
Our above business slide contains graphics of man on bar graph towards piggy bank. This slide may be used to exhibit finance planning and saving. Capture the attention of your audience with this slide.
-
Bar Graph For Yearly Statistical Analysis Powerpoint Slides
This PowerPoint template has been designed with bar graph. This PowerPoint diagram is useful to exhibit yearly statistical analysis. This diagram slide can be used to make impressive presentations.
-
Bar Graph On Blackboard For Growth Analysis Powerpoint Template
Visually support your presentation with our above template containing bar graph on blackboard. This PowerPoint template helps to display growth analysis. Etch your views in the brains of your audience with this diagram slide.
-
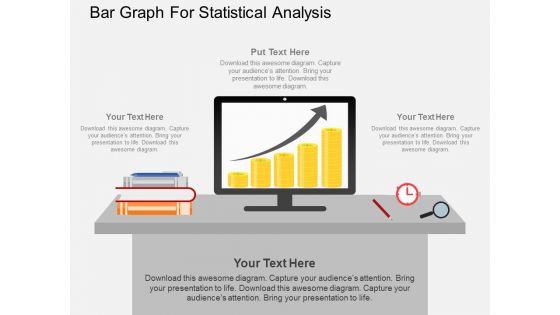
Bar Graph For Statistical Analysis Powerpoint Template
Our above PPT slide contains computer screen on a desk displaying bar graph. This PowerPoint template may be used to display statistical analysis. This template is designed to attract the attention of your audience.


