Graph analysis PowerPoint Presentation Templates and Google Slides
-
Bouncing Regression And Analysis Graph Ppt PowerPoint Presentation File Styles PDF
Presenting this set of slides with name bouncing regression and analysis graph ppt powerpoint presentation file styles pdf. The topics discussed in these slide is bouncing regression and analysis graph. This is a completely editable PowerPoint presentation and is available for immediate download. Download now and impress your audience.
-
Financial Graph Showing Profit Volume Analysis Ppt PowerPoint Presentation Model Master Slide PDF
Presenting this set of slides with name financial graph showing profit volume analysis ppt powerpoint presentation model master slide pdf. The topics discussed in these slides are high cost and competition, low cost and risk, head, the long tail, high profitability of conversion, low profitability of conversion. This is a completely editable PowerPoint presentation and is available for immediate download. Download now and impress your audience.
-
Economic Outlook Graph With Percentage Analysis Ppt PowerPoint Presentation Show Demonstration PDF
Presenting this set of slides with name economic outlook graph with percentage analysis ppt powerpoint presentation show demonstration pdf. The topics discussed in these slide is economic outlook graph with percentage analysis. This is a completely editable PowerPoint presentation and is available for immediate download. Download now and impress your audience.
-
Monitoring Showing Stock Trading And Analysis Graph Ppt PowerPoint Presentation Ideas Slideshow PDF
Presenting this set of slides with name monitoring showing stock trading and analysis graph ppt powerpoint presentation ideas slideshow pdf. This is a one stage process. The stage in this process is monitoring showing stock trading and analysis graph. This is a completely editable PowerPoint presentation and is available for immediate download. Download now and impress your audience.
-
Quarterly Product Sales Analysis Graph Ppt PowerPoint Presentation Portfolio Slide Download PDF
Presenting this set of slides with name quarterly product sales analysis graph ppt powerpoint presentation portfolio slide download pdf. The topics discussed in these slides are product sales, market segment, total sales, number of products sold, year 2020. This is a completely editable PowerPoint presentation and is available for immediate download. Download now and impress your audience.
-
Bar Graph For Business Data Analysis Ppt PowerPoint Presentation File Graphics Template PDF
Presenting this set of slides with name bar graph for business data analysis ppt powerpoint presentation file graphics template pdf. The topics discussed in these slide is bar graph for business data analysis. This is a completely editable PowerPoint presentation and is available for immediate download. Download now and impress your audience.
-
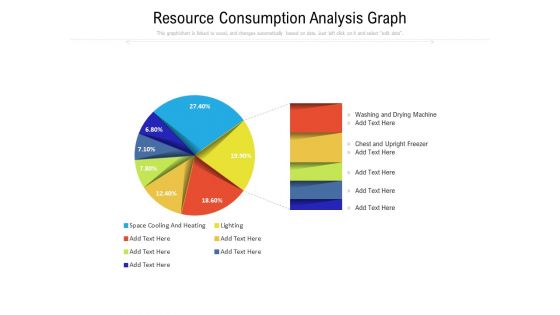
Resource Consumption Analysis Graph Ppt PowerPoint Presentation Gallery Smartart PDF
Presenting this set of slides with name resource consumption analysis graph ppt powerpoint presentation gallery smartart pdf. The topics discussed in these slide is resource consumption analysis graph. This is a completely editable PowerPoint presentation and is available for immediate download. Download now and impress your audience.
-
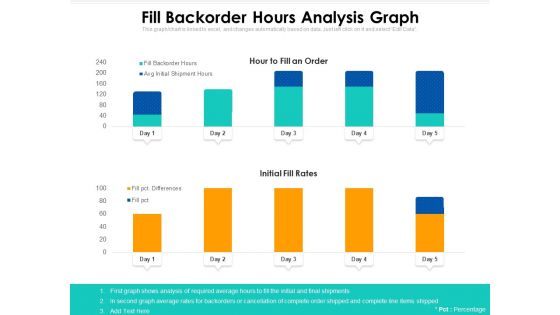
Fill Backorder Hours Analysis Graph Ppt PowerPoint Presentation Summary Example File PDF
Presenting this set of slides with name fill backorder hours analysis graph ppt powerpoint presentation summary example file pdf. The topics discussed in these slides are initial fill rates, hour to fill an order, analysis. This is a completely editable PowerPoint presentation and is available for immediate download. Download now and impress your audience.
-
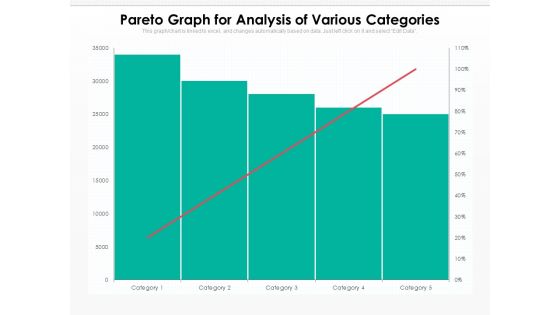
Pareto Graph For Analysis Of Various Categories Ppt PowerPoint Presentation Gallery Template PDF
Presenting this set of slides with name pareto graph for analysis of various categories ppt powerpoint presentation gallery template pdf. The topics discussed in these slide is pareto graph for analysis of various categories. This is a completely editable PowerPoint presentation and is available for immediate download. Download now and impress your audience.
-
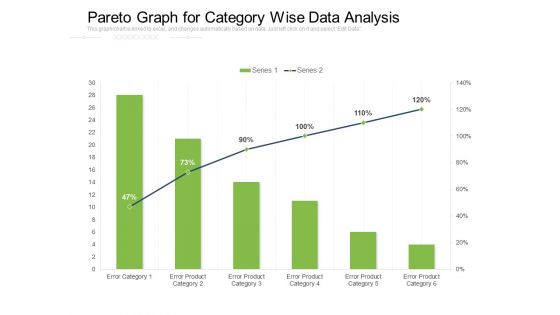
Pareto Graph For Category Wise Data Analysis Ppt PowerPoint Presentation File Example File PDF
Presenting this set of slides with name pareto graph for category wise data analysis ppt powerpoint presentation file example file pdf. The topics discussed in these slide is pareto graph for category wise data analysis. This is a completely editable PowerPoint presentation and is available for immediate download. Download now and impress your audience.
-
Pareto Graph For Logistics Issues Analysis Ppt PowerPoint Presentation File Example Topics PDF
Presenting this set of slides with name pareto graph for logistics issues analysis ppt powerpoint presentation file example topics pdf. The topics discussed in these slide is pareto graph for logistics issues analysis. This is a completely editable PowerPoint presentation and is available for immediate download. Download now and impress your audience.
-
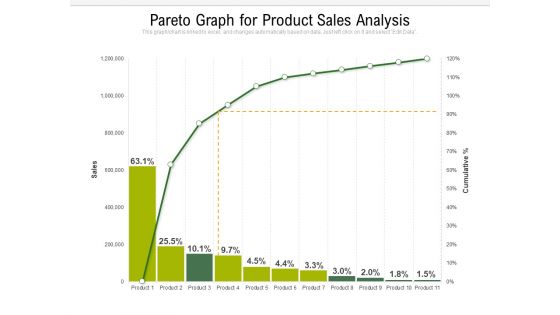
Pareto Graph For Product Sales Analysis Ppt PowerPoint Presentation File Clipart PDF
Presenting this set of slides with name pareto graph for product sales analysis ppt powerpoint presentation file clipart pdf. The topics discussed in these slide is pareto graph for product sales analysis. This is a completely editable PowerPoint presentation and is available for immediate download. Download now and impress your audience.
-
Bar Graph For Financial Growth Analysis Ppt PowerPoint Presentation Gallery Background Images PDF
Presenting this set of slides with name bar graph for financial growth analysis ppt powerpoint presentation gallery background images pdf. The topics discussed in these slide is bar graph for financial growth analysis. This is a completely editable PowerPoint presentation and is available for immediate download. Download now and impress your audience.
-
Graph Showing Sales Team Annual Employee Turnover Analysis Ppt PowerPoint Presentation Ideas PDF
Presenting this set of slides with name graph showing sales team annual employee turnover analysis ppt powerpoint presentation ideas pdf. The topics discussed in these slides are sales department, turnover rate, percentage, key insights, 2020. This is a completely editable PowerPoint presentation and is available for immediate download. Download now and impress your audience.
-
Line Graph Icon For Business Statistical Analysis Ppt PowerPoint Presentation Gallery Clipart Images PDF
Presenting this set of slides with name line graph icon for business statistical analysis ppt powerpoint presentation gallery clipart images pdf. The topics discussed in these slide is line graph icon for business statistical analysis. This is a completely editable PowerPoint presentation and is available for immediate download. Download now and impress your audience.
-
Magnifying Glass Bar Graph Showing Business Statistical Analysis Ppt PowerPoint Presentation File Sample PDF
Presenting this set of slides with name magnifying glass bar graph showing business statistical analysis ppt powerpoint presentation file sample pdf. This is a three stage process. The stages in this process are magnifying glass bar graph showing business statistical analysis. This is a completely editable PowerPoint presentation and is available for immediate download. Download now and impress your audience.
-
Data Analysis Business Graphs Vector Icon Ppt PowerPoint Presentation Gallery Layouts PDF
Presenting this set of slides with name data analysis business graphs vector icon ppt powerpoint presentation gallery layouts pdf. This is a one stage process. The stages in this process is data analysis business graphs vector icon. This is a completely editable PowerPoint presentation and is available for immediate download. Download now and impress your audience.
-
Bar Graph For Return On Investment Analysis Ppt PowerPoint Presentation Infographics Structure PDF
Presenting this set of slides with name bar graph for return on investment analysis ppt powerpoint presentation infographics structure pdf. The topics discussed in these slides are sales, roi. This is a completely editable PowerPoint presentation and is available for immediate download. Download now and impress your audience.
-
Bar Graph Revenue Performance Analysis Ppt PowerPoint Presentation Pictures Samples PDF
Presenting this set of slides with name bar graph revenue performance analysis ppt powerpoint presentation pictures samples pdf. The topics discussed in these slide is bar graph revenue performance analysis. This is a completely editable PowerPoint presentation and is available for immediate download. Download now and impress your audience.
-
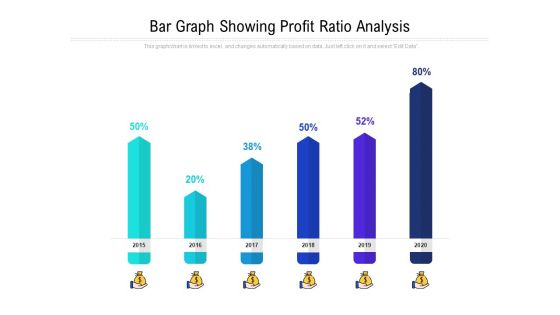
Bar Graph Showing Profit Ratio Analysis Ppt PowerPoint Presentation Styles Brochure PDF
Presenting this set of slides with name bar graph showing profit ratio analysis ppt powerpoint presentation styles brochure pdf. The topics discussed in these slides are 2015 to 2020. This is a completely editable PowerPoint presentation and is available for immediate download. Download now and impress your audience.
-
Bar Graph Showing Sales Cost And Profit Analysis Ppt PowerPoint Presentation Infographics Images PDF
Presenting this set of slides with name bar graph showing sales cost and profit analysis ppt powerpoint presentation infographics images pdf. The topics discussed in these slides are sales, cost, roi, profit. This is a completely editable PowerPoint presentation and is available for immediate download. Download now and impress your audience.
-
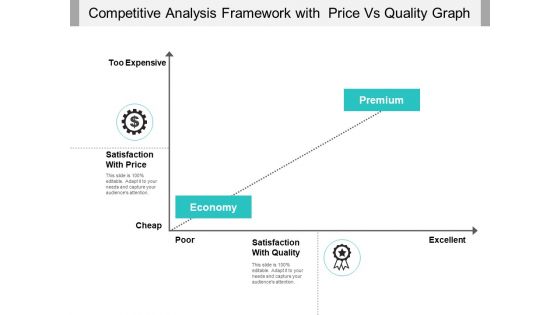
Competitive Analysis Framework With Price Vs Quality Graph Ppt PowerPoint Presentation File Gallery PDF
Presenting this set of slides with name competitive analysis framework with price vs quality graph ppt powerpoint presentation file gallery pdf. This is a two stage process. The stages in this process are price, expensive, excellent. This is a completely editable PowerPoint presentation and is available for immediate download. Download now and impress your audience.
-
Performance Analysis Of Car Segment In Various Pie Graphs Ppt PowerPoint Presentation Professional Example PDF
Pitch your topic with ease and precision using this performance analysis of car segment in various pie graphs ppt powerpoint presentation professional example pdf. This layout presents information on 2017 to 2020, car segment. It is also available for immediate download and adjustment. So, changes can be made in the color, design, graphics or any other component to create a unique layout.
-
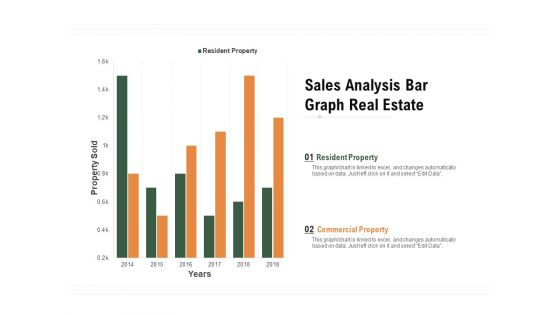
Sales Analysis Bar Graph Real Estate Ppt PowerPoint Presentation Infographic Template Show PDF
Pitch your topic with ease and precision using this sales analysis bar graph real estate ppt powerpoint presentation infographic template show pdf. This layout presents information on resident property, commercial property, property sold, 2014 to 2018. It is also available for immediate download and adjustment. So, changes can be made in the color, design, graphics or any other component to create a unique layout.
-
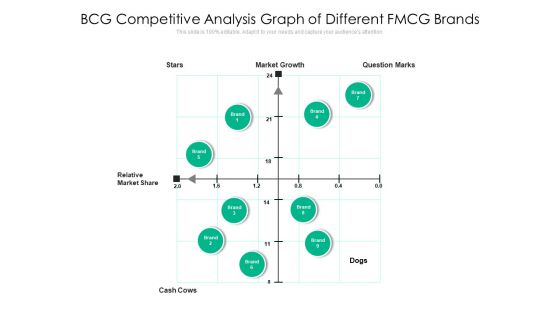
BCG Competitive Analysis Graph Of Different FMCG Brands Ppt PowerPoint Presentation Gallery Show PDF
Presenting bcg competitive analysis graph of different fmcg brands ppt powerpoint presentation gallery show pdf to dispense important information. This template comprises nine stages. It also presents valuable insights into the topics including market, growth, cash cows. This is a completely customizable PowerPoint theme that can be put to use immediately. So, download it and address the topic impactfully.
-
Statistics Analysis Graph Vector Icon Ppt PowerPoint Presentation Professional Show PDF
Showcasing this set of slides titled statistics analysis graph vector icon ppt powerpoint presentation professional show pdf. The topics addressed in these templates are statistics analysis graph vector icon. All the content presented in this PPT design is completely editable. Download it and make adjustments in color, background, font etc. as per your unique business setting.
-
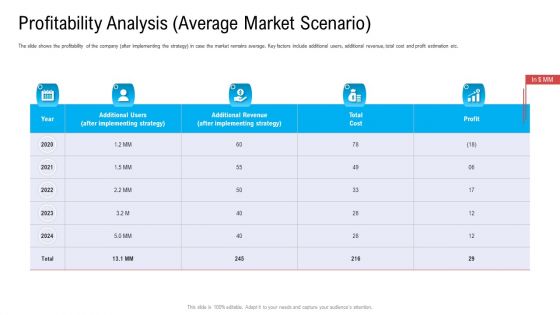
Profitability Analysis Average Market Scenario Ppt Diagram Graph Charts PDF
The slide shows the profitability of the company after implementing the strategy in case the market remains average. Key factors include additional users, additional revenue, total cost and profit estimation etc. Deliver an awe inspiring pitch with this creative profitability analysis average market scenario ppt diagram graph charts pdf bundle. Topics like implementing strategy, additional revenue, total cost, profit can be discussed with this completely editable template. It is available for immediate download depending on the needs and requirements of the user.
-
Managers Conducting Corporate Intelligence Analysis Using Data Graphs Ppt Icon Structure PDF
This is a managers conducting corporate intelligence analysis using data graphs ppt icon structure pdf template with various stages. Focus and dispense information on three stages using this creative set, that comes with editable features. It contains large content boxes to add your information on topics like managers conducting corporate intelligence analysis using data graphs. You can also showcase facts, figures, and other relevant content using this PPT layout. Grab it now.
-
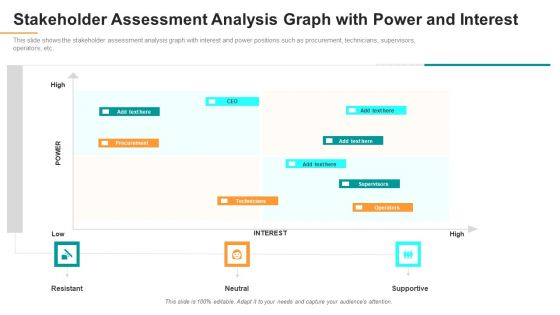
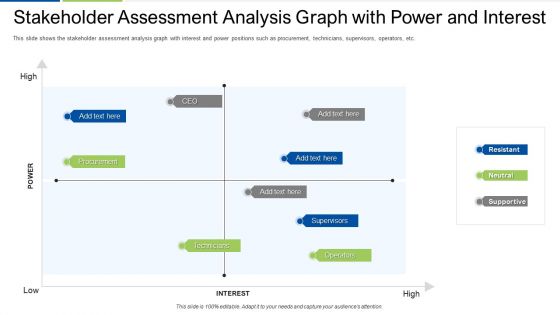
Stakeholder Assessment Analysis Graph With Power And Interest Ppt Gallery Skills PDF
This slide shows the stakeholder assessment analysis graph with interest and power positions such as procurement, technicians, supervisors, operators, etc. This is a stakeholder assessment analysis graph with power and interest ppt gallery skills pdf. template with various stages. Focus and dispense information on four stages using this creative set, that comes with editable features. It contains large content boxes to add your information on topics like technicians, procurement, supervisors, operators. You can also showcase facts, figures, and other relevant content using this PPT layout. Grab it now.
-
Evaluation Mapping Stakeholder Assessment Analysis Graph With Power And Interest Ideas PDF
This slide shows the stakeholder assessment analysis graph with interest and power positions such as procurement, technicians, supervisors, operators, etc. This is a evaluation mapping stakeholder assessment analysis graph with power and interest ideas pdf template with various stages. Focus and dispense information on four stages using this creative set, that comes with editable features. It contains large content boxes to add your information on topics like technicians, procurement, operators. You can also showcase facts, figures, and other relevant content using this PPT layout. Grab it now.
-
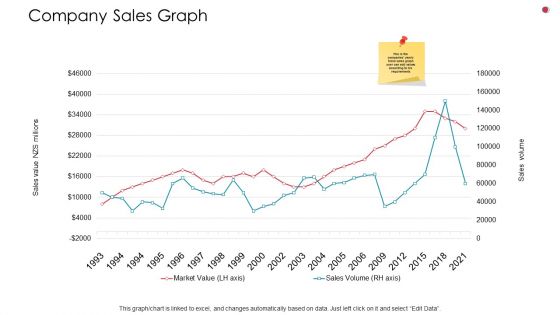
Company Sales Graph Business Analysis Method Ppt Professional Visuals PDF
Deliver an awe inspiring pitch with this creative company sales graph business analysis method ppt professional visuals pdf bundle. Topics like market value, sales can be discussed with this completely editable template. It is available for immediate download depending on the needs and requirements of the user.
-
Stakeholder Assessment Analysis Graph With Power And Interest Ideas PDF
This slide shows the stakeholder assessment analysis graph with interest and power positions such as procurement, technicians, supervisors, operators, etc.Deliver an awe inspiring pitch with this creative stakeholder assessment analysis graph with power and interest ideas pdf bundle. Topics like resistant, neutral, supportive, procurement, technicians can be discussed with this completely editable template. It is available for immediate download depending on the needs and requirements of the user.
-
Stakeholder Assessment Analysis Graph With Power And Interest Introduction PDF
This slide shows the stakeholder assessment analysis graph with interest and power positions such as procurement, technicians, supervisors, operators, etc. Deliver and pitch your topic in the best possible manner with this stakeholder assessment analysis graph with power and interest introduction pdf. Use them to share invaluable insights on technicians, operators, interest and impress your audience. This template can be altered and modified as per your expectations. So, grab it now.
-
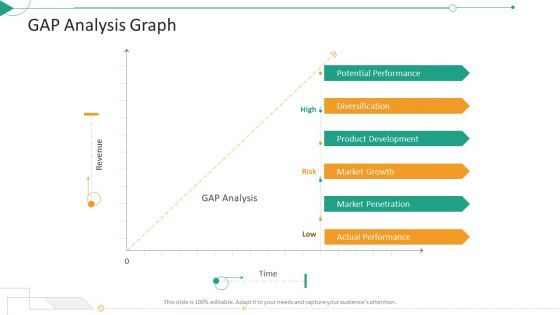
Strategic Planning Needs Evaluation Gap Analysis Graph Ppt Inspiration Templates PDF
This is a strategic planning needs evaluation gap analysis graph ppt inspiration templates pdf template with various stages. Focus and dispense information on three stages using this creative set, that comes with editable features. It contains large content boxes to add your information on topics like product development, market growth, potential performance. You can also showcase facts, figures, and other relevant content using this PPT layout. Grab it now.
-
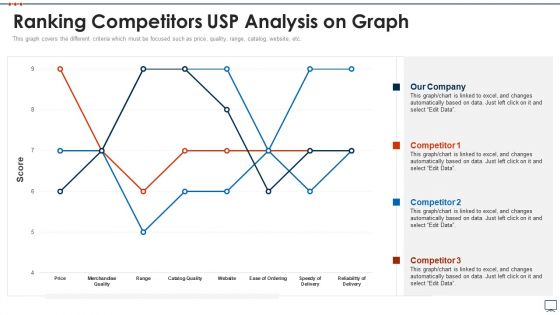
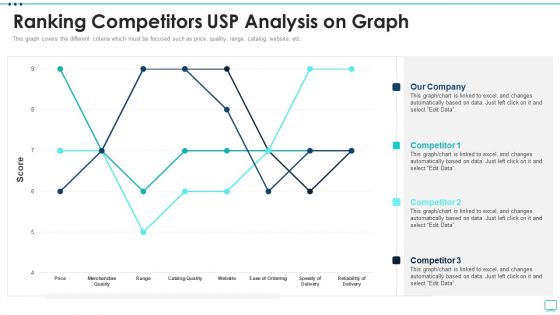
Business Plan Methods Tools And Templates Set 2 Ranking Competitors USP Analysis On Graph Elements PDF
This graph covers the different criteria which must be focused such as price, quality, range, catalog, website, etc. Deliver and pitch your topic in the best possible manner with this business plan methods tools and templates set 2 ranking competitors usp analysis on graph elements pdf. Use them to share invaluable insights on ranking competitors usp analysis on graph and impress your audience. This template can be altered and modified as per your expectations. So, grab it now.
-
Bar Graph Representing Macroeconomic Analysis Employment Change By Industry Background PDF
This slide focuses on the graphical presentation of macroeconomic indicator such as employment rate of different industries which includes service providing and goods producing industries which includes healthcare and social assistance, construction, manufacturing industry, etc. Pitch your topic with ease and precision using this Bar Graph Representing Macroeconomic Analysis Employment Change By Industry Background PDF. This layout presents information on Goods Producing, Service Providing, Financial, Business. It is also available for immediate download and adjustment. So, changes can be made in the color, design, graphics or any other component to create a unique layout.
-
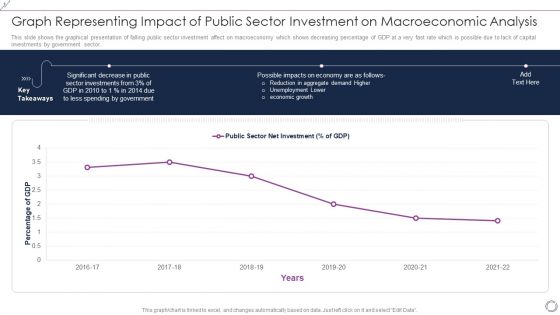
Graph Representing Impact Of Public Sector Investment On Macroeconomic Analysis Themes PDF
This slide shows the graphical presentation of falling public sector investment affect on macroeconomy which shows decreasing percentage of GDP at a very fast rate which is possible due to lack of capital investments by government sector. Showcasing this set of slides titled Graph Representing Impact Of Public Sector Investment On Macroeconomic Analysis Themes PDF. The topics addressed in these templates are Percentage GDP, 2016 to 2022, Public Sector Net Investment. All the content presented in this PPT design is completely editable. Download it and make adjustments in color, background, font etc. as per your unique business setting.
-
Line Graph Representing Macroeconomic Analysis Financial Stability And Flows Rules PDF
This slide focuses on the graphical representation of financial stability and flows in macroeconomy which shows the yearly financial flows of total net flows, direct investment, portfolio investment, change in reserves and other investments. Showcasing this set of slides titled Line Graph Representing Macroeconomic Analysis Financial Stability And Flows Rules PDF. The topics addressed in these templates are Total Net Flows, Direct Investment, Net, Portfolio Investment, Net. All the content presented in this PPT design is completely editable. Download it and make adjustments in color, background, font etc. as per your unique business setting.
-
Customer Purchasing Problems And Impact Analysis Graph Inspiration PDF
This slide represents the problems faced by the customers at the time of purchasing from retail stores along with their impacts in the form of graphical representation. Showcasing this set of slides titled Customer Purchasing Problems And Impact Analysis Graph Inspiration PDF. The topics addressed in these templates are Customer Purchasing Problems And Impact Analysis Graph. All the content presented in this PPT design is completely editable. Download it and make adjustments in color, background, font etc. as per your unique business setting.
-
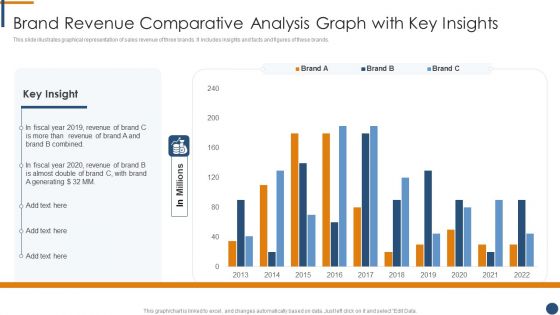
Brand Revenue Comparative Analysis Graph With Key Insights Inspiration PDF
This slide illustrates graphical representation of sales revenue of three brands. It includes insights and facts and figures of these brands.Showcasing this set of slides titled Brand Revenue Comparative Analysis Graph With Key Insights Inspiration PDF. The topics addressed in these templates are Brand Revenue Comparative Analysis Graph With Key Insights. All the content presented in this PPT design is completely editable. Download it and make adjustments in color, background, font etc. as per your unique business setting.
-
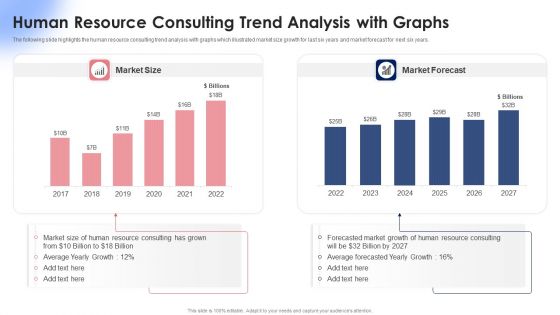
Human Resource Consulting Trend Analysis With Graphs Ppt Summary Clipart Images PDF
The following slide highlights the human resource consulting trend analysis with graphs which illustrated market size growth for last six years and market forecast for next six years. Pitch your topic with ease and precision using this Human Resource Consulting Trend Analysis With Graphs Ppt Summary Clipart Images PDF. This layout presents information on Market Size, Market Forecast, 2017 To 2022. It is also available for immediate download and adjustment. So, changes can be made in the color, design, graphics or any other component to create a unique layout.
-
Upcoming Trends Analysis In Banking Industry Statistical Graph Brochure PDF
This slide shows the graph representing the emerging trends in the banking industry. It includes trends such as use of APIs and open banking, investments in innovation initiatives, expansion of digital payments etc. Deliver and pitch your topic in the best possible manner with this Upcoming Trends Analysis In Banking Industry Statistical Graph Brochure PDF. Use them to share invaluable insights on Upcoming Trends Analysis, Banking Industry Statistical Graph and impress your audience. This template can be altered and modified as per your expectations. So, grab it now.
-
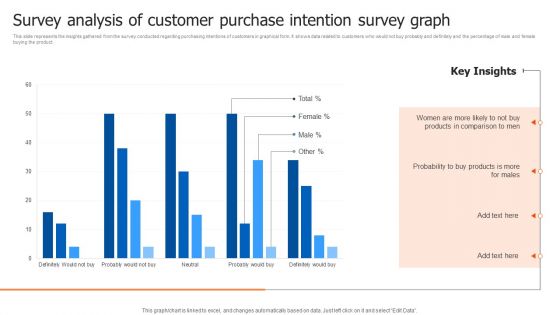
Survey Analysis Of Customer Purchase Intention Survey Graph Structure PDF
This slide represents the insights gathered from the survey conducted regarding purchasing intentions of customers in graphical form. It shows data related to customers who would not buy probably and definitely and the percentage of male and female buying the product. Pitch your topic with ease and precision using this Survey Analysis Of Customer Purchase Intention Survey Graph Structure PDF. This layout presents information on Probability, Products, Key Insights. It is also available for immediate download and adjustment. So, changes can be made in the color, design, graphics or any other component to create a unique layout.
-
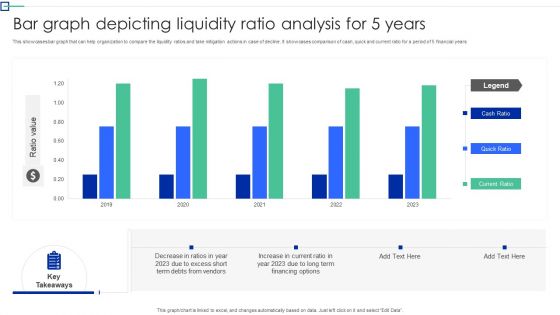
Bar Graph Depicting Liquidity Ratio Analysis For 5 Years Graphics PDF
This showcases bar graph that can help organization to compare the liquidity ratios and take mitigation actions in case of decline. It showcases comparison of cash, quick and current ratio for a period of 5 financial years. Showcasing this set of slides titled Bar Graph Depicting Liquidity Ratio Analysis For 5 Years Graphics PDF. The topics addressed in these templates are Organization To Compare, The Liquidity Ratios, Mitigation Action Decline. All the content presented in this PPT design is completely editable. Download it and make adjustments in color, background, font etc. as per your unique business setting.
-
Line Comparison Graph For Yearly Liquidity Ratio Analysis Comparison Topics PDF
This slide showcases liquidity ratios graph that can help in identifying cash richness and financial position of organization. It showcases comparison for last 6 years and it key components are current ratio, quick ratio and cash ratio. Showcasing this set of slides titled Line Comparison Graph For Yearly Liquidity Ratio Analysis Comparison Topics PDF. The topics addressed in these templates are Term Financing, Cash Shortage, Cash Ratio. All the content presented in this PPT design is completely editable. Download it and make adjustments in color, background, font etc. as per your unique business setting.
-
Manufacturing Productivity Analysis Bar Graph Introduction PDF
This slide illustrates the productivity chart of manufacturing of a company. It includes quantity produced in million units against the time period. Pitch your topic with ease and precision using this Manufacturing Productivity Analysis Bar Graph Introduction PDF. This layout presents information on Manufacturing Productivity, Production Decreased, Closure Of Companies. It is also available for immediate download and adjustment. So, changes can be made in the color, design, graphics or any other component to create a unique layout.
-
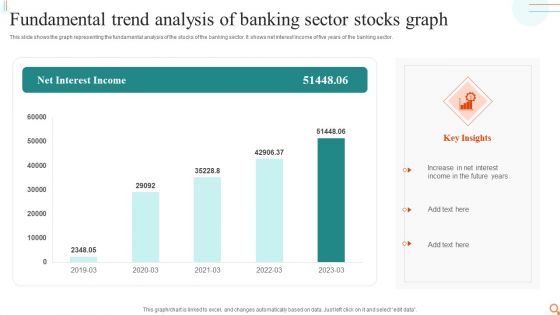
Fundamental Trend Analysis Of Banking Sector Stocks Graph Mockup PDF
This slide shows the graph representing the fundamental analysis of the stocks of the banking sector. It shows net interest income of five years of the banking sector.Pitch your topic with ease and precision using this Fundamental Trend Analysis Of Banking Sector Stocks Graph Mockup PDF. This layout presents information on Increase Interest, Income Future, Interest Income. It is also available for immediate download and adjustment. So, changes can be made in the color, design, graphics or any other component to create a unique layout.
-
Stakeholder Assessment Analysis Graph With Power And Interest Formats PDF
Deliver an awe-inspiring pitch with this creative stakeholder assessment analysis graph with power and interest formats pdf bundle. Topics like stakeholder assessment analysis graph with power and interest can be discussed with this completely editable template. It is available for immediate download depending on the needs and requirements of the user.
-
Strategic Business Plan Effective Tools Ranking Competitors USP Analysis On Graph Designs PDF
This graph covers the different criteria which must be focused such as price, quality, range, catalog, website, etc. Deliver and pitch your topic in the best possible manner with this strategic business plan effective tools ranking competitors usp analysis on graph designs pdf. Use them to share invaluable insights on price, merchandise quality, catalog quality, speedy delivery and impress your audience. This template can be altered and modified as per your expectations. So, grab it now.
-
Graph Comparison Icon For Liquidity Financial Ratios Analysis Summary PDF
Presenting Graph Comparison Icon For Liquidity Financial Ratios Analysis Summary PDF to dispense important information. This template comprises Three stages. It also presents valuable insights into the topics including Graph Comparison, Icon For Liquidity, Financial Ratios Analysis. This is a completely customizable PowerPoint theme that can be put to use immediately. So, download it and address the topic impactfully.
-
Graph Icon For Quick And Current Liquidity Ratio Analysis Template PDF
Persuade your audience using this Graph Icon For Quick And Current Liquidity Ratio Analysis Template PDF. This PPT design covers Three stages, thus making it a great tool to use. It also caters to a variety of topics including Graph Icon, Quick And Current, Liquidity Ratio Analysis. Download this PPT design now to present a convincing pitch that not only emphasizes the topic but also showcases your presentation skills.
-
Competitor Price Analysis Icon With Vision And Graph Symbol Structure PDF
Presenting Competitor Price Analysis Icon With Vision And Graph Symbol Structure PDF to dispense important information. This template comprises Three stages. It also presents valuable insights into the topics including Price Analysis Icon, Vision And Graph. This is a completely customizable PowerPoint theme that can be put to use immediately. So, download it and address the topic impactfully.
-
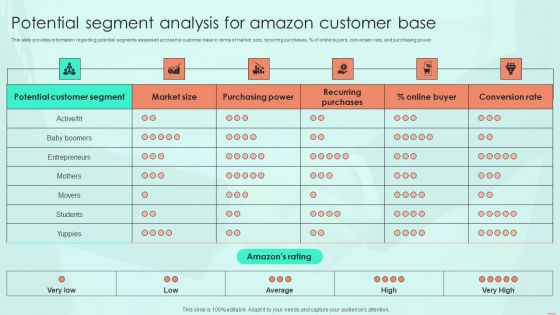
Potential Segment Analysis For Amazon Customer Base Ppt PowerPoint Presentation Diagram Graph Charts PDF
This slide provides information regarding potential segments assessed across the customer base in terms of market size, recurring purchases, percent of online buyers, conversion rate, and purchasing power. Present like a pro with Potential Segment Analysis For Amazon Customer Base Ppt PowerPoint Presentation Diagram Graph Charts PDF Create beautiful presentations together with your team, using our easy to use presentation slides. Share your ideas in real time and make changes on the fly by downloading our templates. So whether you are in the office, on the go, or in a remote location, you can stay in sync with your team and present your ideas with confidence. With Slidegeeks presentation got a whole lot easier. Grab these presentations today.
-
Comprehensive Analysis Of Different Data Lineage Classification Overview Graph Data Lineage Visualization Diagrams PDF
This slide gives an overview of graph data lineage visualization that enables business users to view and analyze data lineage to find solutions without technical skills. The search bar feature allows users to search for any data set or property in the database. Create an editable Comprehensive Analysis Of Different Data Lineage Classification Overview Graph Data Lineage Visualization Diagrams PDF that communicates your idea and engages your audience. Whether you are presenting a business or an educational presentation, pre designed presentation templates help save time. Comprehensive Analysis Of Different Data Lineage Classification Overview Graph Data Lineage Visualization Diagrams PDF is highly customizable and very easy to edit, covering many different styles from creative to business presentations. Slidegeeks has creative team members who have crafted amazing templates. So, go and get them without any delay.
-
Employee Work Time Utilization Analysis Graph Mockup PDF
The following slide highlights the employee work time assessment to gauge their productivity. It includes activities such as daily tasks, research, meetings, reports, contracting, travel, etc. Showcasing this set of slides titled Employee Work Time Utilization Analysis Graph Mockup PDF. The topics addressed in these templates are Employee Work Time, Utilization Analysis Graph. All the content presented in this PPT design is completely editable. Download it and make adjustments in color, background, font etc. as per your unique business setting.
-
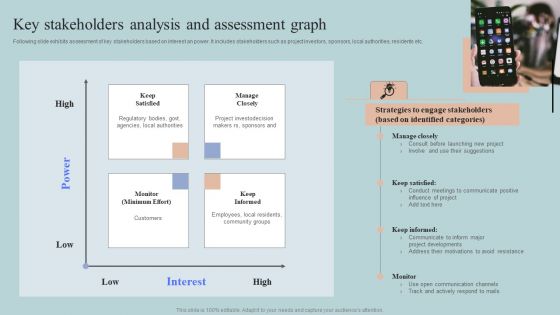
Key Stakeholders Analysis And Assessment Graph Structure PDF
Following slide exhibits assessment of key stakeholders based on interest an power. It includes stakeholders such as project investors, sponsors, local authorities, residents etc. Coming up with a presentation necessitates that the majority of the effort goes into the content and the message you intend to convey. The visuals of a PowerPoint presentation can only be effective if it supplements and supports the story that is being told. Keeping this in mind our experts created Key Stakeholders Analysis And Assessment Graph Structure PDF to reduce the time that goes into designing the presentation. This way, you can concentrate on the message while our designers take care of providing you with the right template for the situation.
-
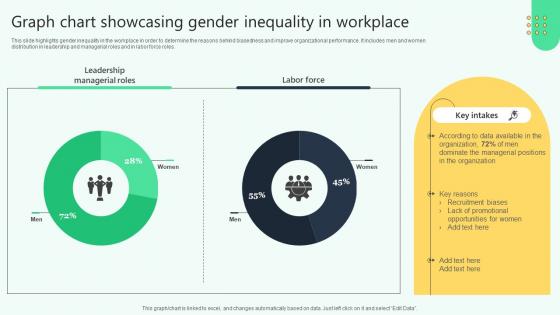
Graph Chart Showcasing Gender Inequality In Workplace Analysing Hr Data For Effective Decision Making
This slide highlights gender inequality in the workplace in order to determine the reasons behind biasedness and improve organizational performance. It includes men and women distribution in leadership and managerial roles and in labor force roles. This Graph Chart Showcasing Gender Inequality In Workplace Analysing Hr Data For Effective Decision Making is perfect for any presentation, be it in front of clients or colleagues. It is a versatile and stylish solution for organizing your meetings. The Graph Chart Showcasing Gender Inequality In Workplace Analysing Hr Data For Effective Decision Making features a modern design for your presentation meetings. The adjustable and customizable slides provide unlimited possibilities for acing up your presentation. Slidegeeks has done all the homework before launching the product for you. So, do not wait, grab the presentation templates today


