Financials dashboard PowerPoint Presentation Templates and Google Slides
-
Icon Of Yearly Financial Position Calculation Dashboard Formats PDF
Pitch your topic with ease and precision using this icon of yearly financial position calculation dashboard formats pdf. This layout presents information on icon of yearly financial position calculation dashboard. It is also available for immediate download and adjustment. So, changes can be made in the color, design, graphics or any other component to create a unique layout.
-
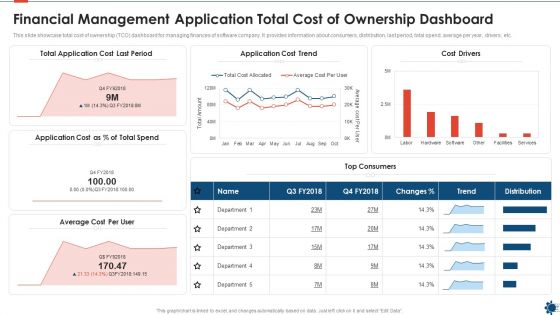
Financial Management Application Total Cost Of Ownership Dashboard Infographics PDF
This slide showcase total cost of ownership TCO dashboard for managing finances of software company. It provides information about consumers, distribution, last period, total spend, average per year, drivers, etc. Showcasing this set of slides titled financial management application total cost of ownership dashboard infographics pdf. The topics addressed in these templates are cost, application. All the content presented in this PPT design is completely editable. Download it and make adjustments in color, background, font etc. as per your unique business setting.
-
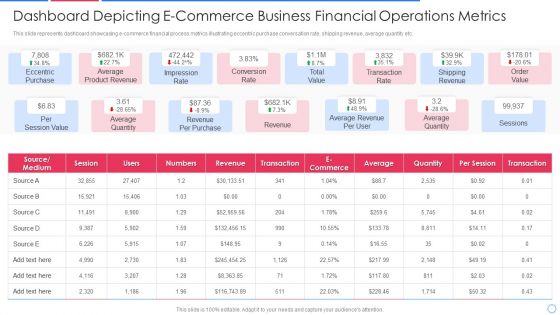
Dashboard Depicting E-Commerce Business Financial Operations Metrics Topics PDF
This slide represents dashboard showcasing e-commerce financial process metrics illustrating eccentric purchase conversation rate, shipping revenue, average quantity etc.Showcasing this set of slides titled dashboard depicting e-commerce business financial operations metrics topics pdf The topics addressed in these templates are eccentric purchase, average product revenue, impression rate All the content presented in this PPT design is completely editable. Download it and make adjustments in color, background, font etc. as per your unique business setting.
-
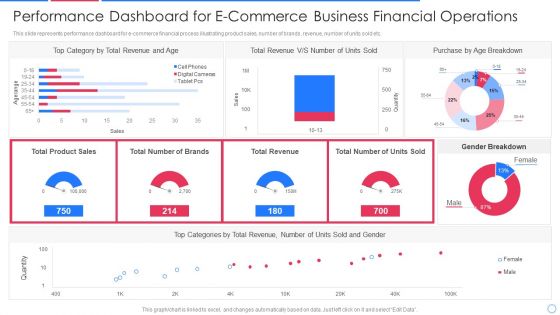
Performance Dashboard For E Commerce Business Financial Operations Infographics PDF
This slide represents performance dashboard for e-commerce financial process illustrating product sales, number of brands, revenue, number of units sold etc.Pitch your topic with ease and precision using this performance dashboard for e commerce business financial operations infographics pdf This layout presents information on category by total revenue, total revenue, purchase by age breakdown It is also available for immediate download and adjustment. So, changes can be made in the color, design, graphics or any other component to create a unique layout.
-
Project Financial Risk Evaluation Dashboard Icon Summary PDF
Persuade your audience using this project financial risk evaluation dashboard icon summary pdf This PPT design covers four stages, thus making it a great tool to use. It also caters to a variety of topics including project financial risk evaluation dashboard icon Download this PPT design now to present a convincing pitch that not only emphasizes the topic but also showcases your presentation skills.
-
Strawman Project Action Plan Financial Performance Tracking Dashboard Template PDF
This slide presents the dashboard which will help firm in tracking the financial performance. This dashboard displays number of customers, vendors and revenues generated, expenses and profit incurred. Deliver an awe inspiring pitch with this creative strawman project action plan financial performance tracking dashboard template pdf bundle. Topics like performance, customers, profit can be discussed with this completely editable template. It is available for immediate download depending on the needs and requirements of the user.
-
Startup Business Financial Dashboard With Income Statement Portrait PDF
This slide represents dashboard showing financial position of the startup business. It shows details related to net profit margin, income and expenses, accounts payable and receivable, net profit, quick and current ratio etc. Showcasing this set of slides titled Startup Business Financial Dashboard With Income Statement Portrait PDF. The topics addressed in these templates are Accounts Receivable Income, Income And Expenses, Net Profit Margin. All the content presented in this PPT design is completely editable. Download it and make adjustments in color, background, font etc. as per your unique business setting.
-
Startup Business Financial Dashboard With Key Metrics Sample PDF
This slide represents the financial dashboard for startup company with key performance indicators. It includes details related to current working capital, cash conversion cycle in days and vendor payment error rate. Pitch your topic with ease and precision using this Startup Business Financial Dashboard With Key Metrics Sample PDF. This layout presents information on Cash Conversion Cycle, Current Working Capital, Current Liabilities Debt. It is also available for immediate download and adjustment. So, changes can be made in the color, design, graphics or any other component to create a unique layout.
-
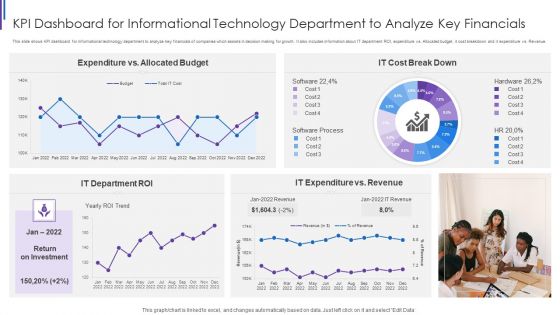
KPI Dashboard For Informational Technology Department To Analyze Key Financials Structure PDF
This slide shows KPI dashboard for informational technology department to analyze key financials of companies which assists in decision making for growth. It also includes information about IT department ROI, expenditure vs. Allocated budget, it cost breakdown and it expenditure vs. Revenue. Pitch your topic with ease and precision using this KPI Dashboard For Informational Technology Department To Analyze Key Financials Structure PDF. This layout presents information on Expenditure Vs Allocated, Budget IT Cost, Break Down IT, Expenditure Vs Revenue, IT Department ROI. It is also available for immediate download and adjustment. So, changes can be made in the color, design, graphics or any other component to create a unique layout.
-
Financial Environment Dashboard For Tracking Growth In Banking Industry Slides PDF
This slide covers financial environment dashboard for tracking growth in banking industry which includes overall regional and sub-regional growth of banking services Pitch your topic with ease and precision using this Financial Environment Dashboard For Tracking Growth In Banking Industry Slides PDF This layout presents information on Best Demonstrated, Worst Demonstrated, Average Variance It is also available for immediate download and adjustment. So, changes can be made in the color, design, graphics or any other component to create a unique layout.
-
Financial Services Advisory Business Plan Insurance Agency Activities Tracking Dashboard Introduction PDF
This slide provides glimpse about insurance agency activities tracking dashboard which help management in monitoring activities. Deliver an awe inspiring pitch with this creative Financial Services Advisory Business Plan Insurance Agency Activities Tracking Dashboard Introduction PDF bundle. Topics like Claim Reviews, Claim Renewals, Activities, Vehicle Insurance, Scheduled Reports can be discussed with this completely editable template. It is available for immediate download depending on the needs and requirements of the user.
-
Financial Dashboard For Month Closing Income And Expenses Ideas PDF
This slide illustrates facts and figures related to month end financials of a corporation. It includes income statement graph, profit margin, income and expenditure graph etc.Showcasing this set of slides titled Financial Dashboard For Month Closing Income And Expenses Ideas PDF The topics addressed in these templates are Accounts Receivable, Income Statement, Expenditure All the content presented in this PPT design is completely editable. Download it and make adjustments in color, background, font etc. as per your unique business setting.
-
Cyber Safety Incident Management Financial Performance Tracking Dashboard Formats PDF
This slide presents the dashboard which will help firm in tracking the fiscal performance. This dashboard displays revenues and expenses trends and payment received analysis. Deliver an awe inspiring pitch with this creative cyber safety incident management financial performance tracking dashboard formats pdf bundle. Topics like revenue and expense trends, receivables analysis can be discussed with this completely editable template. It is available for immediate download depending on the needs and requirements of the user.
-
Strategic Procedure To Improve Employee Efficiency Company Financial Performance Dashboard Infographics PDF
This slide highlights KPI dashboard exhibiting overall improvement in the financial performance of company as the consequences of program implementation. Deliver and pitch your topic in the best possible manner with this strategic procedure to improve employee efficiency company financial performance dashboard infographics pdf Use them to share invaluable insights on company financial performance dashboard and impress your audience. This template can be altered and modified as per your expectations. So, grab it now.
-
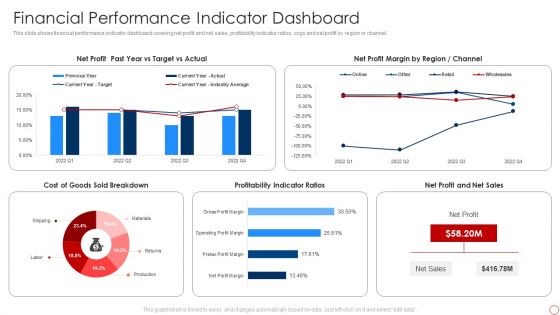
Sustainability Calculation With KPI Financial Performance Indicator Dashboard Infographics PDF Template PDF
This slide shows financial performance indicator dashboard covering net profit and net sales, profitability indicator ratios, cogs and net profit by region or channel. Deliver an awe inspiring pitch with this creative sustainability calculation with kpi financial performance indicator dashboard infographics pdf bundle. Topics like net profit margin, net profit and net sales, profitability indicator ratios, sold breakdown can be discussed with this completely editable template. It is available for immediate download depending on the needs and requirements of the user.
-
Summary Financial Accounting Statement Profit And Loss Analysis Dashboard Elements PDF
This graph or chart is linked to excel, and changes automatically based on data. Just left click on it and select Edit Data. Deliver an awe inspiring pitch with this creative Summary Financial Accounting Statement Profit And Loss Analysis Dashboard Elements PDF bundle. Topics like P And L Structure Dynamics, Dupont Rations, Debt Coverage Ratios, Creditworthiness Assessment can be discussed with this completely editable template. It is available for immediate download depending on the needs and requirements of the user.
-
Summary Financial Sales And Profit Margin Analysis Dashboard Pictures PDF
This graph or chart is linked to excel, and changes automatically based on data. Just left click on it and select Edit Data. Deliver an awe inspiring pitch with this creative Summary Financial Sales And Profit Margin Analysis Dashboard Pictures PDF bundle. Topics like Net Profit, Past Year Vs Target Vs Actual, Net Profit Margin By Region, Channel, Expenses Breakdown, Costs And Expenses, Profitability Indicator Ratios can be discussed with this completely editable template. It is available for immediate download depending on the needs and requirements of the user.
-
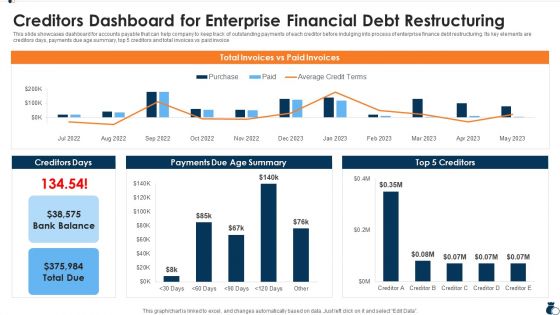
Creditors Dashboard For Enterprise Financial Debt Restructuring Brochure PDF
This slide showcases dashboard for accounts payable that can help company to keep track of outstanding payments of each creditor before indulging into process of enterprise finance debt restructuring. Its key elements are creditors days, payments due age summary, top 5 creditors and total invoices vs paid invoice. Deliver an awe inspiring pitch with this creative Creditors Dashboard For Enterprise Financial Debt Restructuring Brochure PDF bundle. Topics like Creditors Dashboard For Enterprise Financial Debt Restructuring can be discussed with this completely editable template. It is available for immediate download depending on the needs and requirements of the user.
-
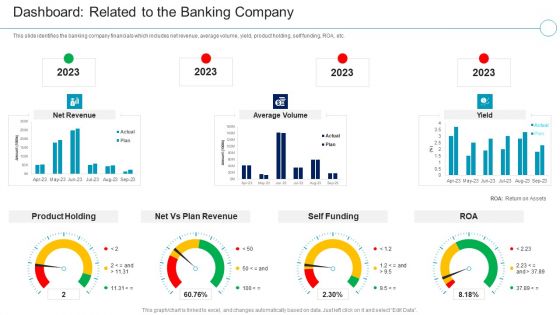
Financial Services Enterprise Transformation Dashboard Related To The Banking Company Information PDF
This slide shows the company financials Total Branches and Total R and D Expenses of ABC Bank. It includes the financials before the implementation of strategies for the years 2019 to 2023 with key notes.Deliver an awe inspiring pitch with this creative Financial Services Enterprise Transformation Dashboard Related To The Banking Company Information PDF bundle. Topics like Company Financials Before The Implementation Of Strategies can be discussed with this completely editable template. It is available for immediate download depending on the needs and requirements of the user.
-
Threat Management At Workplace Financial Performance Tracking Dashboard Introduction Pdf
This slide presents the dashboard which will help firm in tracking the fiscal performance. This dashboard displays revenues and expenses trends and payment received analysis. Deliver and pitch your topic in the best possible manner with this threat management at workplace financial performance tracking dashboard introduction pdf. Use them to share invaluable insights on revenue trends, expense trends, receivables analysis and impress your audience. This template can be altered and modified as per your expectations. So, grab it now.
-
Corporate Security And Risk Management Financial Performance Tracking Dashboard Introduction PDF
This slide presents the dashboard which will help firm in tracking the fiscal performance. This dashboard displays revenues and expenses trends and payment received analysis. Deliver an awe inspiring pitch with this creative corporate security and risk management financial performance tracking dashboard introduction pdf bundle. Topics like revenue and expense trends, receivables analysis can be discussed with this completely editable template. It is available for immediate download depending on the needs and requirements of the user.
-
Providing Electronic Financial Services To Existing Consumers Branch Scoreboard Kpi Dashboard Brochure PDF
This slide portrays branch scoreboard dashboard covering metrics such as accounts opened and closed, deposits to goal, accounts by type, expense to budget and referrals by product. Deliver an awe inspiring pitch with this creative Providing Electronic Financial Services To Existing Consumers Branch Scoreboard Kpi Dashboard Brochure PDF bundle. Topics like Product, Budget, Goal, Expense can be discussed with this completely editable template. It is available for immediate download depending on the needs and requirements of the user.
-
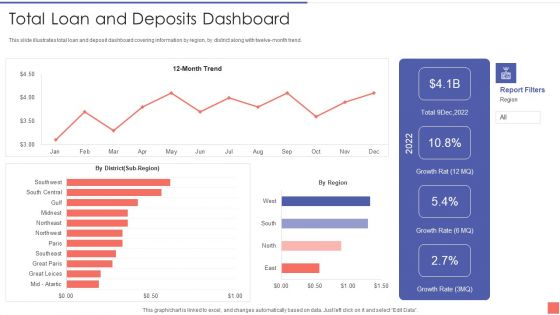
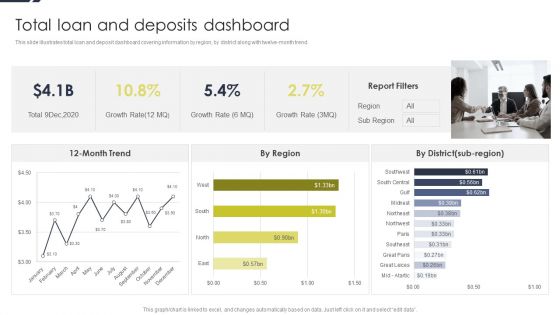
Providing Electronic Financial Services To Existing Consumers Total Loan And Deposits Dashboard Guidelines PDF
This slide illustrates total loan and deposit dashboard covering information by region, by district along with twelve-month trend. Deliver an awe inspiring pitch with this creative Providing Electronic Financial Services To Existing Consumers Total Loan And Deposits Dashboard Guidelines PDF bundle. Topics like Total Loan And Deposits Dashboard can be discussed with this completely editable template. It is available for immediate download depending on the needs and requirements of the user.
-
Ways To Enhance Organizations Profitability Financial Performance Tracking Dashboard Slides PDF
This slide presents the dashboard which will help firm in tracking the financial performance. This dashboard displays number of customers, vendors and revenues generated, expenses and profit incurred. Deliver and pitch your topic in the best possible manner with this ways to enhance organizations profitability financial performance tracking dashboard slides pdf Use them to share invaluable insights on asset rationalization, adjusting liability, capital moderation and impress your audience. This template can be altered and modified as per your expectations. So, grab it now.
-
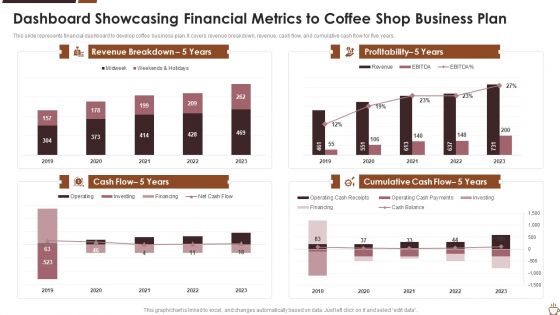
Dashboard Showcasing Financial Metrics To Coffee Shop Business Plan Background PDF
This slide represents financial dashboard to develop coffee business plan. It covers revenue breakdown, revenue, cash flow, and cumulative cash flow for five years. Showcasing this set of slides titled dashboard showcasing financial metrics to coffee shop business plan background pdf. The topics addressed in these templates are dashboard showcasing financial metrics to coffee shop business plan. All the content presented in this PPT design is completely editable. Download it and make adjustments in color, background, font etc. as per your unique business setting.
-
Organizational Issue Resolution Tool Financial Performance Tracking Dashboard Background PDF
This slide presents the dashboard which will help firm in tracking the financial performance. This dashboard displays number of customers, vendors and revenues generated, expenses and profit incurred. Deliver an awe inspiring pitch with this creative Organizational Issue Resolution Tool Financial Performance Tracking Dashboard Background PDF bundle. Topics like Profit, Performance, Revenue can be discussed with this completely editable template. It is available for immediate download depending on the needs and requirements of the user.
-
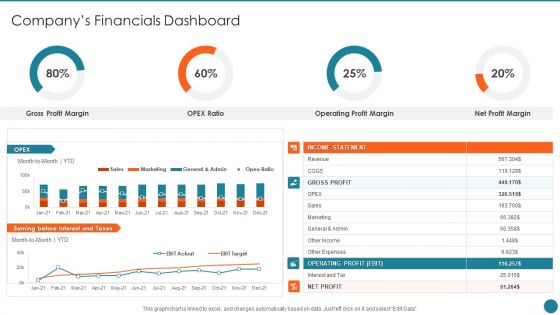
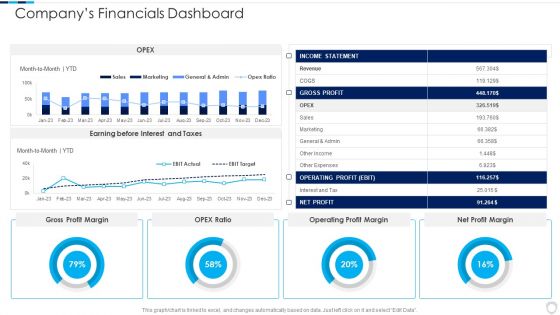
Business Overview Of An Information Technology Company Companys Financials Dashboard Themes PDF
Deliver an awe inspiring pitch with this creative Business Overview Of An Information Technology Company Companys Financials Dashboard Themes PDF bundle. Topics like Gross Profit, Operating Profit, Profit Margin can be discussed with this completely editable template. It is available for immediate download depending on the needs and requirements of the user.
-
Manual To Develop Strawman Proposal Financial Performance Tracking Dashboard Pictures PDF
This slide presents the dashboard which will help firm in tracking the financial performance. This dashboard displays number of customers, vendors and revenues generated, expenses and profit incurred. Deliver and pitch your topic in the best possible manner with this Manual To Develop Strawman Proposal Financial Performance Tracking Dashboard Pictures PDF. Use them to share invaluable insights on Profit, Revenue, Expense and impress your audience. This template can be altered and modified as per your expectations. So, grab it now.
-
Financial Report Of An IT Firm Companys Financials Dashboard Infographics PDF
Deliver an awe inspiring pitch with this creative Financial Report Of An IT Firm Companys Financials Dashboard Infographics PDF bundle. Topics like Operating Profit, Gross Profit, Income Statement can be discussed with this completely editable template. It is available for immediate download depending on the needs and requirements of the user.
-
Information Technology Firm Report Example Companys Financials Dashboard Designs PDF
Deliver an awe inspiring pitch with this creative Information Technology Firm Report Example Companys Financials Dashboard Designs PDF bundle. Topics like Gross Profit, Operating Profit, Profit Margin can be discussed with this completely editable template. It is available for immediate download depending on the needs and requirements of the user.
-
Optimize Enterprise Core Financial Performance Tracking Dashboard Clipart PDF
This slide presents the dashboard which will help firm in tracking the financial performance. This dashboard displays number of customers, vendors and revenues generated, expenses and profit incurred. Deliver an awe inspiring pitch with this creative Optimize Enterprise Core Financial Performance Tracking Dashboard Clipart PDF bundle. Topics like Profit Revenue, Performance Expense, Budget Monthly can be discussed with this completely editable template. It is available for immediate download depending on the needs and requirements of the user.
-
Stock Requirement Plan Dashboard With Financial Overview Formats PDF
The following slide highlights the material requirement planning dashboard with financial overview. It depicts project details, project requirement, cost progress, hours progress, material planning, late orders and planning expectations. Showcasing this set of slides titled Stock Requirement Plan Dashboard With Financial Overview Formats PDF. The topics addressed in these templates are Project Requirement, Planning Expectations, Project Details. All the content presented in this PPT design is completely editable. Download it and make adjustments in color, background, font etc. as per your unique business setting.
-
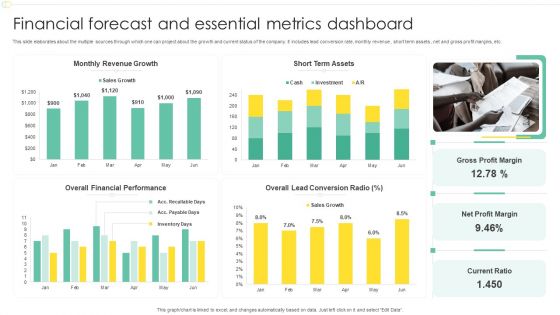
Financial Forecast And Essential Metrics Dashboard Ppt File Show PDF
This slide elaborates about the multiple sources through which one can project about the growth and current status of the company. It includes lead conversion rate, monthly revenue , short term assets , net and gross profit margins, etc. Pitch your topic with ease and precision using this Financial Forecast And Essential Metrics Dashboard Ppt File Show PDF. This layout presents information on Monthly Revenue Growth, Short Term Assets, Overall Financial Performance, Net Profit Margin. It is also available for immediate download and adjustment. So, changes can be made in the color, design, graphics or any other component to create a unique layout.
-
Financial Forecast And Essential Metrics Dashboard Showing Cash Management Designs PDF
This slide contains the projections of the company financials to predict the future position so that better decisions could be taken for the growth prospective. It also includes ratios, cash balance, inventory analysis , etc. Showcasing this set of slides titled Financial Forecast And Essential Metrics Dashboard Showing Cash Management Designs PDF. The topics addressed in these templates are Days Sales Outstanding, Cash Management Dashboard, Days Inventory Outstanding. All the content presented in this PPT design is completely editable. Download it and make adjustments in color, background, font etc. as per your unique business setting.
-
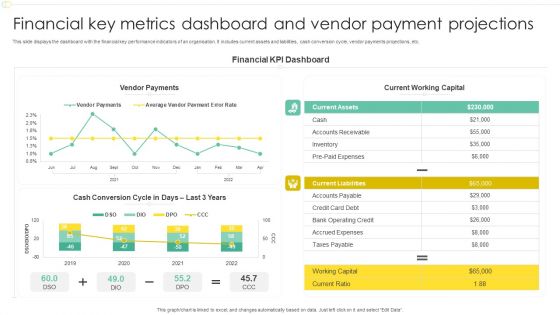
Financial Key Metrics Dashboard And Vendor Payment Projections Professional PDF
This slide displays the dashboard with the financial key performance indicators of an organisation. It includes current assets and liabilities, cash conversion cycle, vendor payments projections, etc. Pitch your topic with ease and precision using this Financial Key Metrics Dashboard And Vendor Payment Projections Professional PDF. This layout presents information on Financial KPI Dashboard, Current Working Capital, Vendor Payments. It is also available for immediate download and adjustment. So, changes can be made in the color, design, graphics or any other component to create a unique layout.
-
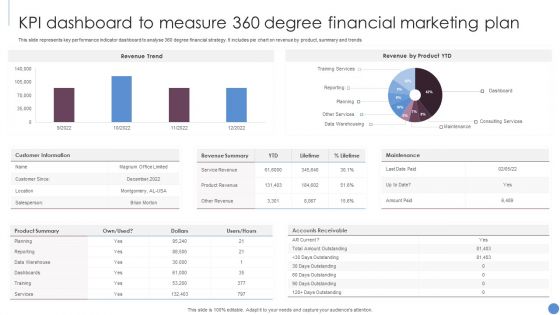
KPI Dashboard To Measure 360 Degree Financial Marketing Plan Slides PDF
This slide represents key performance indicator dashboard to analyse 360 degree financial strategy. It includes pie chart on revenue by product, summary and trends. Showcasing this set of slides titled KPI Dashboard To Measure 360 Degree Financial Marketing Plan Slides PDF. The topics addressed in these templates are Revenue Trend, Revenue Product YTD, Customer Information. All the content presented in this PPT design is completely editable. Download it and make adjustments in color, background, font etc. as per your unique business setting.
-
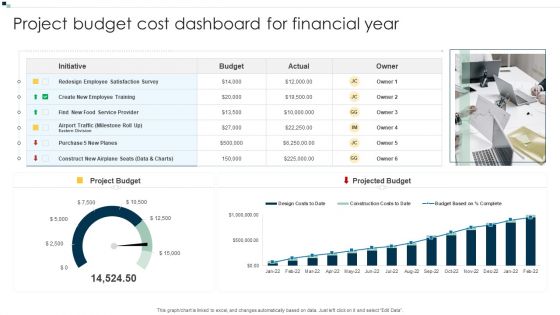
Project Budget Cost Dashboard For Financial Year Ideas PDF
Pitch your topic with ease and precision using this Project Budget Cost Dashboard For Financial Year Ideas PDF. This layout presents information on Budget, Service Provider, Redesign Employee. It is also available for immediate download and adjustment. So, changes can be made in the color, design, graphics or any other component to create a unique layout.
-
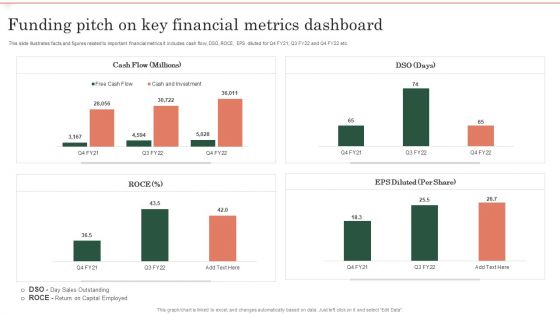
Funding Pitch On Key Financial Metrics Dashboard Ppt Ideas Deck PDF
This slide illustrates facts and figures related to important financial metrics It includes cash flow, DSO, ROCE, EPS diluted for Q4 FY21, Q3 FY22 and Q4 FY22 etc. Showcasing this set of slides titled Funding Pitch On Key Financial Metrics Dashboard Ppt Ideas Deck PDF. The topics addressed in these templates are Cash Flow, EPS Diluted, ROCE. All the content presented in this PPT design is completely editable. Download it and make adjustments in color, background, font etc. as per your unique business setting.
-
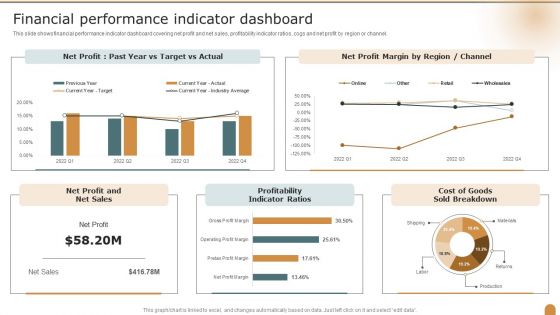
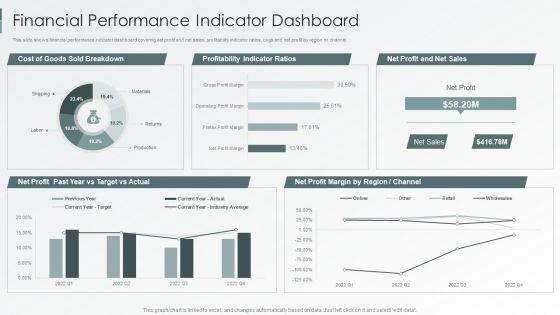
Financial Performance Indicator Dashboard Company Performance Evaluation Using KPI Structure PDF
This slide shows financial performance indicator dashboard covering net profit and net sales, profitability indicator ratios, cogs and net profit by region or channel. Deliver and pitch your topic in the best possible manner with this Financial Performance Indicator Dashboard Company Performance Evaluation Using KPI Structure PDF. Use them to share invaluable insights on Financial Performance, Indicator Dashboard, Profitability Indicator and impress your audience. This template can be altered and modified as per your expectations. So, grab it now.
-
Financial Unsatisfactory Performance Dashboard With Accounting Ratios Diagrams PDF
This slide contains the information of the financial sector of the company to know where it stands and what needs to be done to improve the performance.It includes multiple ratios ROA, ROE, working capital ration and debt-equity ratio. Pitch your topic with ease and precision using this Financial Unsatisfactory Performance Dashboard With Accounting Ratios Diagrams PDF. This layout presents information on Return Assets, Working Capital, Return Equity. It is also available for immediate download and adjustment. So, changes can be made in the color, design, graphics or any other component to create a unique layout.
-
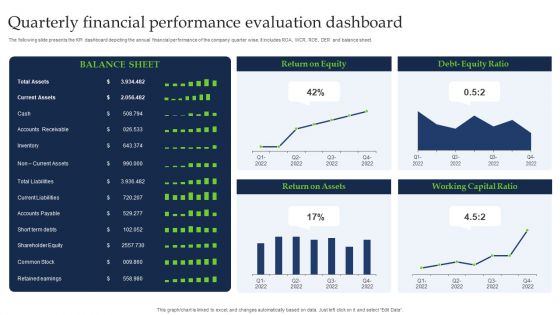
Quarterly Financial Performance Evaluation Dashboard Guidelines PDF
The following slide presents the KPI dashboard depicting the annual financial performance of the company quarter wise. It includes ROA, WCR, ROE, DER and balance sheet. Pitch your topic with ease and precision using this Quarterly Financial Performance Evaluation Dashboard Guidelines PDF. This layout presents information on Current Assets, Shareholder Equity, Common Stock. It is also available for immediate download and adjustment. So, changes can be made in the color, design, graphics or any other component to create a unique layout.
-
Conducting Monetary Inclusion With Mobile Financial Services Branch Scoreboard Dashboard Sample PDF
This slide portrays branch scoreboard dashboard covering metrics such as accounts opened and closed, deposits to goal, accounts by type, expense to budget and referrals by product. Deliver an awe inspiring pitch with this creative Conducting Monetary Inclusion With Mobile Financial Services Branch Scoreboard Dashboard Sample PDF bundle. Topics like Expense Budget, Referrals Product, Deposits To Goal can be discussed with this completely editable template. It is available for immediate download depending on the needs and requirements of the user.
-
Conducting Monetary Inclusion With Mobile Financial Services Total Loan And Deposits Dashboard Download PDF
This slide illustrates total loan and deposit dashboard covering information by region, by district along with twelve-month trend.Deliver and pitch your topic in the best possible manner with this Conducting Monetary Inclusion With Mobile Financial Services Total Loan And Deposits Dashboard Download PDF. Use them to share invaluable insights on Total Loan, Deposits Dashboard and impress your audience. This template can be altered and modified as per your expectations. So, grab it now.
-
KPI Dashboard To Monitor Financial Budget Allocation And Distribution Portrait PDF
This slide signifies the key performance indicator dashboard on organisation financial budget allocation within various department. It includes budget allocation, monthly performance, top suppliers etc.Deliver an awe inspiring pitch with this creative KPI Dashboard To Monitor Financial Budget Allocation And Distribution Portrait PDF bundle. Topics like Budget Allocated, Budget Distributed, Payable Account can be discussed with this completely editable template. It is available for immediate download depending on the needs and requirements of the user.
-
Company Financials Performance Tracking Dashboard Brochure PDF
This slide illustrates KPI dashboard that can be used by organizations to track their financial performance on company basis. Kpis covered in the slide are contract status, revenue, cost of goods, overdue and task status. Showcasing this set of slides titled Company Financials Performance Tracking Dashboard Brochure PDF. The topics addressed in these templates are Report Shortcut, Revenue Cost, Overdue Task. All the content presented in this PPT design is completely editable. Download it and make adjustments in color, background, font etc. as per your unique business setting.
-
Company Financial Performance Indicators Dashboard With Liquidity And Turnover Ratios Formats PDF
This graph or chart is linked to excel, and changes automatically based on data. Just left click on it and select Edit Data. Pitch your topic with ease and precision using this Company Financial Performance Indicators Dashboard With Liquidity And Turnover Ratios Formats PDF. This layout presents information on Cash Balance, Days Inventory Outstanding, Days Payable Outstanding. It is also available for immediate download and adjustment. So, changes can be made in the color, design, graphics or any other component to create a unique layout.
-
Company Financial Performance Indicators Dashboard With Working Capital And Cash Conversion Icons PDF
This slide shows dashboard of finance KPIs . It covers working capital, cash conversion cycle, vendor payment error rate ,current assets and liabilities. Showcasing this set of slides titled Company Financial Performance Indicators Dashboard With Working Capital And Cash Conversion Icons PDF. The topics addressed in these templates are Current Working Capital, Current Liabilities, Working Capital. All the content presented in this PPT design is completely editable. Download it and make adjustments in color, background, font etc. as per your unique business setting.
-
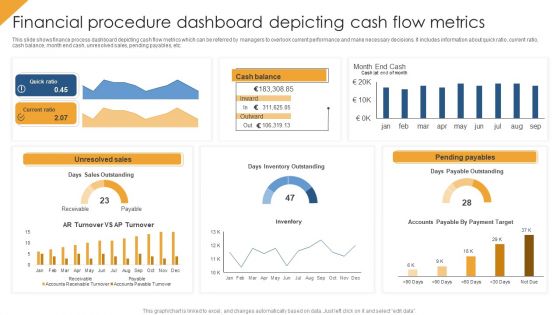
Financial Procedure Dashboard Depicting Cash Flow Metrics Structure PDF
This slide shows finance process dashboard depicting cash flow metrics which can be referred by managers to overlook current performance and make necessary decisions. It includes information about quick ratio, current ratio, cash balance, month end cash, unresolved sales, pending payables, etc. Pitch your topic with ease and precision using this Financial Procedure Dashboard Depicting Cash Flow Metrics Structure PDF. This layout presents information on Quick Ratio, Unresolved Sales, Pending Payables. It is also available for immediate download and adjustment. So, changes can be made in the color, design, graphics or any other component to create a unique layout.
-
Financial Procedure Dashboard Indicating Yearly Revenue Analysis Icons PDF
This slide illustrates finance process dashboard indicating yearly revenue analysis which contains gross profit margin, operating profit ratio, net profit, revenue and cost of goods sold cogs operating expenses, etc. It can be referred by company owners who can compare it with previous years performance and make related decisions for future. Showcasing this set of slides titled Financial Procedure Dashboard Indicating Yearly Revenue Analysis Icons PDF. The topics addressed in these templates are Operating Profit Percentage, Net Profit Percentage, Operating Profit Ratio. All the content presented in this PPT design is completely editable. Download it and make adjustments in color, background, font etc. as per your unique business setting.
-
Sales Enhancement Strategy Dashboard With Product Classification And Financial Analysis Formats PDF
This slide shows sales improvement plan dashboard for product classification and financial analysis which can be referred by companies which want to make quick decisions by having overview of organized and compiled data. It includes details such as comparison chart, state wise sales, total sales, adjusted margin, operational expenses, etc. Showcasing this set of slides titled Sales Enhancement Strategy Dashboard With Product Classification And Financial Analysis Formats PDF. The topics addressed in these templates are Gross Margin, Sales, Operational Expenses. All the content presented in this PPT design is completely editable. Download it and make adjustments in color, background, font etc. as per your unique business setting.
-
Business Overview Of A Technology Firm Companys Financials Dashboard Sample PDF
Deliver and pitch your topic in the best possible manner with this Business Overview Of A Technology Firm Companys Financials Dashboard Sample PDF. Use them to share invaluable insights on Financials Dashboard, Operating Profit Margin, Net Profit Margin and impress your audience. This template can be altered and modified as per your expectations. So, grab it now.
-
Insurance And Financial Product Insurance Agency Activities Tracking Dashboard Download PDF
This slide provides glimpse about insurance agency activities tracking dashboard which help management in monitoring activities. Deliver an awe inspiring pitch with this creative Insurance And Financial Product Insurance Agency Activities Tracking Dashboard Download PDF bundle. Topics like Scheduled Reports, Pending Activities, Latest Customers can be discussed with this completely editable template. It is available for immediate download depending on the needs and requirements of the user.
-
Financial Dashboard To Evaluate Internal Rate Of Return Microsoft PDF
This slide showcases dashboard that can help organization to calculate the internal rate of return on invested capital. Company can use it to communicate the return on investment to investors. Deliver an awe inspiring pitch with this creative Financial Dashboard To Evaluate Internal Rate Of Return Microsoft PDF bundle. Topics like Invested, Equity, Debt can be discussed with this completely editable template. It is available for immediate download depending on the needs and requirements of the user.
-
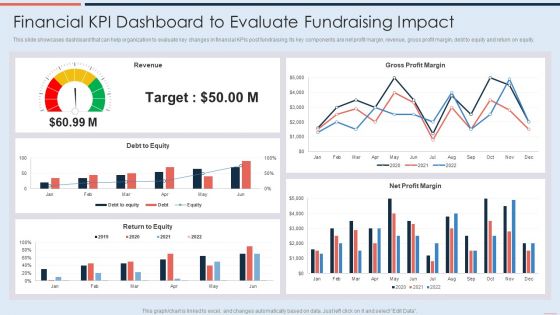
Financial Kpi Dashboard To Evaluate Fundraising Impact Demonstration PDF
This slide showcases dashboard that can help organization to evaluate key changes in financial KPIs post fundraising. Its key components are net profit margin, revenue, gross profit margin, debt to equity and return on equity. Deliver and pitch your topic in the best possible manner with this Financial Kpi Dashboard To Evaluate Fundraising Impact Demonstration PDF. Use them to share invaluable insights on Debt To Equity, Revenue, Gross Profit Margin and impress your audience. This template can be altered and modified as per your expectations. So, grab it now.
-
Metrics To Measure Business Performance Financial Performance Indicator Dashboard Pictures PDF
This slide shows financial performance indicator dashboard covering net profit and net sales, profitability indicator ratios, cogs and net profit by region or channel. Deliver an awe inspiring pitch with this creative Metrics To Measure Business Performance Financial Performance Indicator Dashboard Pictures PDF bundle. Topics like Net Profit, Net Sales, Cost Goods, Sold Breakdown can be discussed with this completely editable template. It is available for immediate download depending on the needs and requirements of the user.
-
Kpis For Evaluating Business Sustainability Financial Performance Indicator Dashboard Demonstration PDF
This slide shows financial performance indicator dashboard covering net profit and net sales, profitability indicator ratios, cogs and net profit by region or channel. Deliver and pitch your topic in the best possible manner with this Kpis For Evaluating Business Sustainability Financial Performance Indicator Dashboard Demonstration PDF. Use them to share invaluable insights on Net Profit, Net Profit Margin, Profitability Indicator Ratios and impress your audience. This template can be altered and modified as per your expectations. So, grab it now.
-
Enterprise Sustainability Performance Metrics Financial Performance Indicator Dashboard Themes PDF
This slide shows financial performance indicator dashboard covering net profit and net sales, profitability indicator ratios, cogs and net profit by region or channel.Deliver an awe inspiring pitch with this creative Enterprise Sustainability Performance Metrics Financial Performance Indicator Dashboard Themes PDF bundle. Topics like Profitability Indicator, Sold Breakdown, Target Actual can be discussed with this completely editable template. It is available for immediate download depending on the needs and requirements of the user.
-
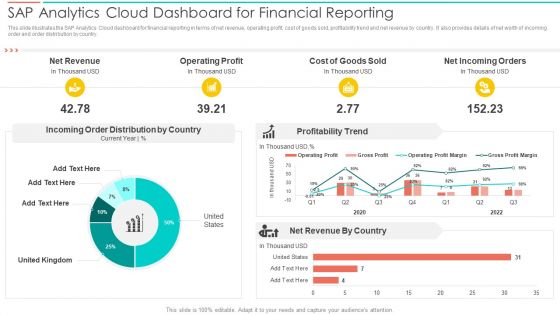
SAC Planning And Implementation SAP Analytics Cloud Dashboard For Financial Reporting Introduction PDF
This slide illustrates the SAP Analytics Cloud dashboard for financial reporting in terms of net revenue, operating profit, cost of goods sold, profitability trend and net revenue by country. It also provides details of net worth of incoming order and order distribution by country. Deliver an awe inspiring pitch with this creative SAC Planning And Implementation SAP Analytics Cloud Dashboard For Financial Reporting Introduction PDF bundle. Topics like Net Revenue, Operating Profit, Cost Goods Sold can be discussed with this completely editable template. It is available for immediate download depending on the needs and requirements of the user.
-
Project Metrics Dashboard Depicting Financials Pictures PDF
This slide shows the project management dashboard which covers the monthly sales graph and project financials such as reviewing, setup, coding, testing, getting feedback from users, training, implementation and launching. Pitch your topic with ease and precision using this Project Metrics Dashboard Depicting Financials Pictures PDF. This layout presents information on Execution, Project Financial. It is also available for immediate download and adjustment. So, changes can be made in the color, design, graphics or any other component to create a unique layout.
-
Project Metrics Dashboard With Financial Forecast Professional PDF
This slide shows the project management dashboard which includes the types of expenditure, follow up items, summary overview, with status updated, issues, risks, contingencies, financials, schedule and scope with starting and ending date, actual budget, etc. Showcasing this set of slides titled Project Metrics Dashboard With Financial Forecast Professional PDF. The topics addressed in these templates are Expenditure, Financial Forecast, Risks. All the content presented in this PPT design is completely editable. Download it and make adjustments in color, background, font etc. as per your unique business setting.


