Financial charts and graphs PowerPoint Presentation Templates and Google Slides
-
Financial Charts And Graphs For Statistical Analysis Ppt Powerpoint Presentation Show Layout
This is a financial charts and graphs for statistical analysis ppt powerpoint presentation show layout. This is a four stage process. The stages in this process are business metrics, business kpi, business dashboard.
-
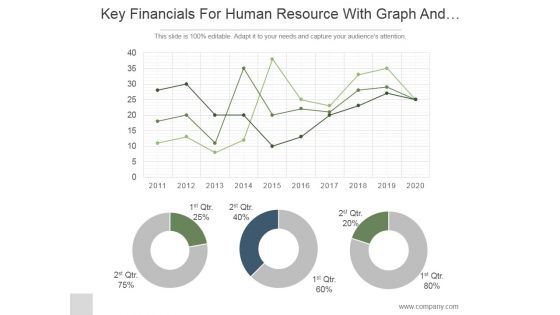
Key Financials For Human Resource With Graph And Pie Chart Ppt PowerPoint Presentation Ideas
This is a key financials for human resource with graph and pie chart ppt powerpoint presentation ideas. This is a three stage process. The stages in this process are business, strategy, marketing, analysis, donut, growth.
-
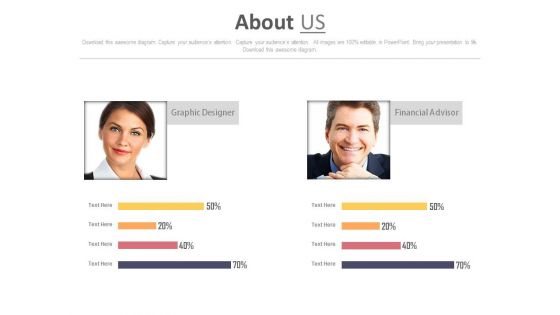
Graphic Designer And Financial Advisor Skill Assessment Chart Powerpoint Slides
The PowerPoint template has been designed with graphic designer and financial advisor skill assessment chart. Use this about us page to tell the story of your company.
-
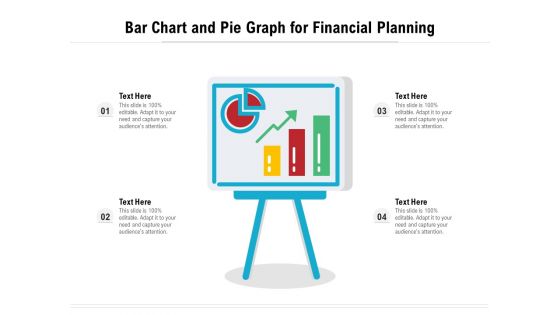
Bar Chart And Pie Graph For Financial Planning Ppt PowerPoint Presentation Infographics Graphics Example PDF
Presenting bar chart and pie graph for financial planning ppt powerpoint presentation infographics graphics example pdf. to dispense important information. This template comprises four stages. It also presents valuable insights into the topics including bar chart and pie graph for financial planning. This is a completely customizable PowerPoint theme that can be put to use immediately. So, download it and address the topic impactfully.
-
Financial R2R Icon With Graph And Chart Ppt PowerPoint Presentation Slides Design Inspiration PDF
Presenting Financial R2R Icon With Graph And Chart Ppt PowerPoint Presentation Slides Design Inspiration PDF to dispense important information. This template comprises three stages. It also presents valuable insights into the topics including Financial R2r Icon, Graph Chart. This is a completely customizable PowerPoint theme that can be put to use immediately. So, download it and address the topic impactfully.
-
Adjusting Financial Strategies And Planning Assessment Of Working Capital Modelling Chart Graphics PDF
This slide provides glimpse about model of managing cashflows in the business that can help in timely payments to creditors. It includes trade debtors account, trade creditors account, working capital adjustments, etc. Crafting an eye catching presentation has never been more straightforward. Let your presentation shine with this tasteful yet straightforward Adjusting Financial Strategies And Planning Assessment Of Working Capital Modelling Chart Graphics PDF template. It offers a minimalistic and classy look that is great for making a statement. The colors have been employed intelligently to add a bit of playfulness while still remaining professional. Construct the ideal Adjusting Financial Strategies And Planning Assessment Of Working Capital Modelling Chart Graphics PDF that effortlessly grabs the attention of your audience. Begin now and be certain to wow your customers.


