Estimated performance PowerPoint Presentation Templates and Google Slides
-
Estimated Paycheck Performance Appraisals Ppt PowerPoint Presentation Slides Smartart
This is a estimated paycheck performance appraisals ppt powerpoint presentation slides smartart. This is a four stage process. The stages in this process are estimated paycheck, performance appraisals.
-
Agile Model Improve Task Team Performance Agile Operations Project Cost Estimation Table Ideas PDF
The following slide shows estimated costs involved in Agile Implementation with agile tasks Infrastructure Upgradation, Software Support, Market Analysis, estimated time required, task priority level high, medium or low, task requirement criteria etc. This is a agile model improve task team performance agile operations project cost estimation table ideas pdf template with various stages. Focus and dispense information on five stages using this creative set, that comes with editable features. It contains large content boxes to add your information on topics like software maintenance, market analysis, infrastructure upgradation. You can also showcase facts, figures, and other relevant content using this PPT layout. Grab it now.
-
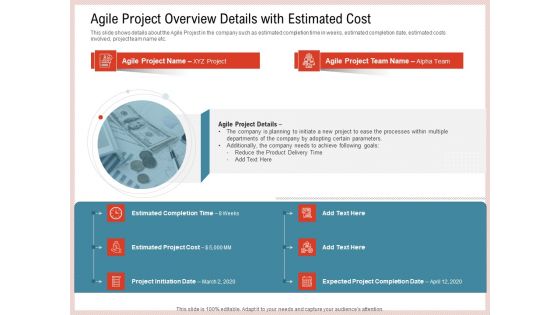
Agile Model Improve Task Team Performance Agile Project Overview Details With Estimated Cost Diagrams PDF
This slide shows details about the Agile Project in the company such as estimated completion time in weeks, estimated completion date, estimated costs involved, project team name etc. This is a agile model improve task team performance agile project overview details with estimated cost diagrams pdf template with various stages. Focus and dispense information on six stages using this creative set, that comes with editable features. It contains large content boxes to add your information on topics like agile project overview details with estimated cost. You can also showcase facts, figures, and other relevant content using this PPT layout. Grab it now.
-
Agile Model Improve Task Team Performance Agile Software Development Stages With Estimated Time Ideas PDF
This slide shows Agile Software Development Stages such as Planning, Designing, Analysis, Task Implementation, Software Testing, and Maintenance of Software along with estimated time for each stage. This is a agile model improve task team performance agile software development stages with estimated time ideas pdf template with various stages. Focus and dispense information on six stages using this creative set, that comes with editable features. It contains large content boxes to add your information on topics like planning, analysis, design, implementation, testing and integration. You can also showcase facts, figures, and other relevant content using this PPT layout. Grab it now.
-
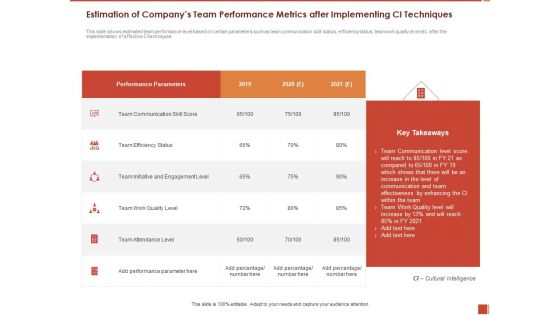
Cultural Intelligence Importance Workplace Productivity Estimation Of Companys Team Performance Diagrams PDF
Presenting this set of slides with name cultural intelligence importance workplace productivity estimation of companys team performance diagrams pdf. The topics discussed in these slides are team communication skill score, team efficiency status, team initiative and engagement level. This is a completely editable PowerPoint presentation and is available for immediate download. Download now and impress your audience.
-
Improving Retention Rate Implementing Estimated Performance Targets After Implementing Acquisition Strategy Brochure PDF
Presenting this set of slides with name improving retention rate implementing estimated performance targets after implementing acquisition strategy brochure pdf. The topics discussed in these slides are retention, performance, parameters. This is a completely editable PowerPoint presentation and is available for immediate download. Download now and impress your audience.
-
Winning New Customers Strategies Estimated Performance Targets After Implementing Acquisition Strategy Portrait PDF
Presenting this set of slides with name winning new customers strategies estimated performance targets after implementing acquisition strategy portrait pdf. The topics discussed in these slides are retention, performance, parameters. This is a completely editable PowerPoint presentation and is available for immediate download. Download now and impress your audience.
-
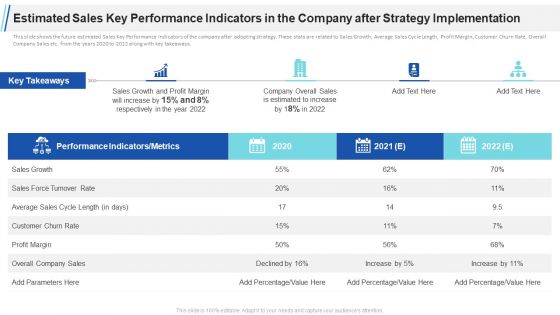
Estimated Sales Key Performance Indicators In The Company After Strategy Implementation Mockup PDF
This slide shows the future estimated Sales Key Performance Indicators of the company after adopting strategy. These stats are related to Sales Growth, Average Sales Cycle Length, Profit Margin, Customer Churn Rate, Overall Company Sales etc. from the years 2020 to 2022 along with key takeaways. Deliver an awe inspiring pitch with this creative estimated sales key performance indicators in the company after strategy implementation mockup pdf bundle. Topics like performance indicators, sales growth, profit margin, overall company sales, 2020 2022 can be discussed with this completely editable template. It is available for immediate download depending on the needs and requirements of the user.
-
Estimated People Engagement Performance Indicators In The Company After Strategy Implementation Ppt File Graphics Example PDF
This slide shows the estimated and improved People Engagement Performance Indicators in the Company after strategy implementation for the coming 3 years. Some of the indicators are Employee Turnover Rate, Internal Promotion Rate, Absenteeism Rate, Employee Satisfaction Index, NPS Net Promoter Score etc. Deliver and pitch your topic in the best possible manner with this estimated people engagement performance indicators in the company after strategy implementation ppt file graphics example pdf. Use them to share invaluable insights on employee turnover rate, internal promotion rate, employee absenteeism rate and impress your audience. This template can be altered and modified as per your expectations. So, grab it now.
-
Estimated Sales Key Performance Indicators In The Company After Strategy Implementation Information PDF
This slide shows the future estimated Sales Key Performance Indicators of the company after adopting strategy. These stats are related to Sales Growth, Average Sales Cycle Length, Profit Margin, Customer Churn Rate, Overall Company Sales etc. from the years 2021 to 2023 along with key takeaways. This is a estimated sales key performance indicators in the company after strategy implementation information pdf template with various stages. Focus and dispense information on four stages using this creative set, that comes with editable features. It contains large content boxes to add your information on topics like performance, sales, growth, profit margin. You can also showcase facts, figures, and other relevant content using this PPT layout. Grab it now.
-
Estimated Sales Key Performance Indicators In The Company After Strategy Implementation Structure PDF
This slide shows the future estimated Sales Key Performance Indicators of the company after adopting strategy. These stats are related to Sales Growth, Average Sales Cycle Length, Profit Margin, Customer Churn Rate, Overall Company Sales etc. from the years 2021 to 2023 along with key takeaways. This is a estimated sales key performance indicators in the company after strategy implementation structure pdf template with various stages. Focus and dispense information on four stages using this creative set, that comes with editable features. It contains large content boxes to add your information on topics like performance, sales, growth, profit margin. You can also showcase facts, figures, and other relevant content using this PPT layout. Grab it now.
-
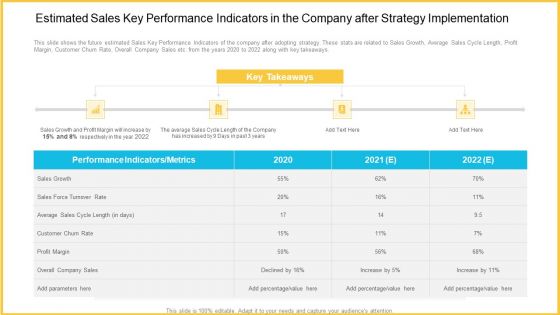
Estimated Sales Key Performance Indicators In The Company After Strategy Implementation Diagrams PDF
This slide shows the future estimated Sales Key Performance Indicators of the company after adopting strategy. These stats are related to Sales Growth, Average Sales Cycle Length, Profit Margin, Customer Churn Rate, Overall Company Sales etc. from the years 2020 to 2022 along with key takeaways. Deliver an awe-inspiring pitch with this creative estimated sales key performance indicators in the company after strategy implementation diagrams pdf. bundle. Topics like sales growth, sales force turnover rate, customer churn rate, profit margin, overall company sales can be discussed with this completely editable template. It is available for immediate download depending on the needs and requirements of the user.
-
Estimated People Engagement Performance Indicators In The Company After Strategy Implementation Download PDF
Deliver and pitch your topic in the best possible manner with this estimated people engagement performance indicators in the company after strategy implementation download pdf. Use them to share invaluable insights on estimated people engagement performance indicators in the company after strategy implementation and impress your audience. This template can be altered and modified as per your expectations. So, grab it now.
-
Estimated People Engagement Performance Indicators In The Company After Strategy Implementation Ppt Portfolio Influencers PDF
This slide shows the estimated and improved People Engagement Performance Indicators in the Company after strategy implementation for the coming 3 years. Some of the indicators are Employee Turnover Rate, Internal Promotion Rate, Absenteeism Rate, Employee Satisfaction Index, NPS Net Promoter Score etc. Deliver and pitch your topic in the best possible manner with this estimated people engagement performance indicators in the company after strategy implementation ppt portfolio influencers pdf. Use them to share invaluable insights on internal promotion rate, employee turnover rate, overall company sales, performance indicators and impress your audience. This template can be altered and modified as per your expectations. So, grab it now.
-
Estimated Security Monitoring Key Performance Indicators Diagrams PDF
Deliver and pitch your topic in the best possible manner with this estimated security monitoring key performance indicators diagrams pdf. Use them to share invaluable insights on security monitoring, security related service downtimes, overall security monitoring and impress your audience. This template can be altered and modified as per your expectations. So, grab it now.
-
Estimated People Engagement Performance Indicators In The Company After Strategy Implementation Elements PDF
This slide shows the estimated and improved People Engagement Performance Indicators in the Company after strategy implementation for the coming 3 years. Some of the indicators are Employee Turnover Rate, Internal Promotion Rate, Absenteeism Rate, Employee Satisfaction Index, NPS Net Promoter Score etc. Deliver and pitch your topic in the best possible manner with this estimated people engagement performance indicators in the company after strategy implementation elements pdf. Use them to share invaluable insights on employee turnover rate, internal promotion rate, employee absenteeism rate and impress your audience. This template can be altered and modified as per your expectations. So, grab it now.
-
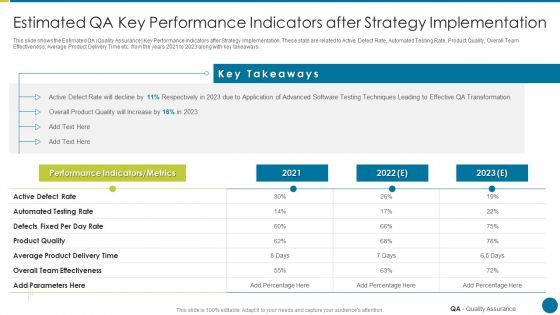
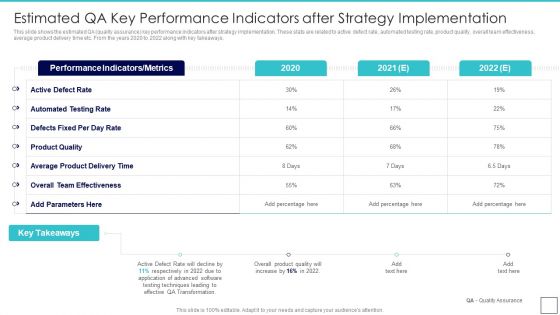
QA Modification For Product Quality Development And Consumer Satisfaction Estimated QA Key Performance Summary PDF
This slide shows the Estimated QA Quality Assurance Key Performance Indicators after Strategy Implementation. These stats are related to Active Defect Rate, Automated Testing Rate, Product Quality, Overall Team Effectiveness, Average Product Delivery Time etc. from the years 2021 to 2023 along with key takeaways. Deliver and pitch your topic in the best possible manner with this qa modification for product quality development and consumer satisfaction estimated qa key performance summary pdf. Use them to share invaluable insights on parameters, team effectiveness, product quality, performance and impress your audience. This template can be altered and modified as per your expectations. So, grab it now.
-
Successful Quality Assurance Transition Techniques To Enhance Product Quality Estimated Qa Key Performance Indicators Slides PDF
This slide shows the Estimated QA Quality Assurance Key Performance Indicators after Strategy Implementation. These stats are related to Active Defect Rate, Automated Testing Rate, Product Quality, Overall Team Effectiveness, Average Product Delivery Time etc. from the years 2022 to 2024 along with key takeaways. Deliver an awe inspiring pitch with this creative successful quality assurance transition techniques to enhance product quality estimated qa key performance indicators slides pdf bundle. Topics like estimated qa key performance indicators after strategy implementation can be discussed with this completely editable template. It is available for immediate download depending on the needs and requirements of the user.
-
Methods To Develop Advanced Estimated Security Monitoring Key Performance Indicators Structure PDF
This slide shows the estimated Cyber Security Monitoring Key Performance Indicators of the company after implementing an advanced security monitoring plan, adopting security monitoring best practices and implementing Cybersecurity Monitoring Tool Cain and Abel. Deliver an awe inspiring pitch with this creative methods to develop advanced estimated security monitoring key performance indicators structure pdf bundle. Topics like security monitoring kpis, costs per security incident can be discussed with this completely editable template. It is available for immediate download depending on the needs and requirements of the user.
-
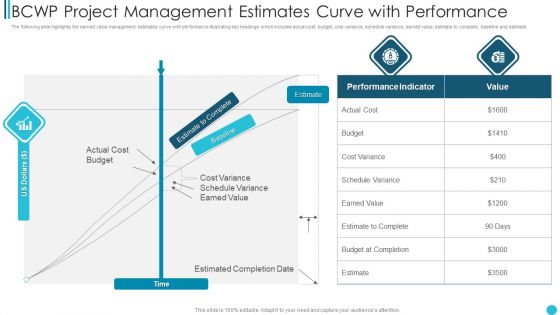
BCWP Project Management Estimates Curve With Performance Infographics PDF
The following slide highlights the earned value management estimates curve with performance illustrating key headings which includes actual cost, budget, cost variance, schedule variance, earned value, estimate to complete, baseline and estimate.Showcasing this set of slides titled BCWP Project Management Estimates Curve With Performance Infographics PDF The topics addressed in these templates are Cost Variance, Schedule Variance, Eames Value All the content presented in this PPT design is completely editable. Download it and make adjustments in color, background, font etc. as per your unique business setting.
-
Quality Assurance Transformation Strategies To Improve Business Performance Efficiency Estimated Active Defect Rate Pictures PDF
This slide shows details about the Estimated Active Defect Rate in the coming 5 years. Active Defect Rate will decline due to application of Test Oriented Software Testing Approach. Deliver and pitch your topic in the best possible manner with this quality assurance transformation strategies to improve business performance efficiency estimated active defect rate pictures pdf. Use them to share invaluable insights on estimated active defect rate after application of qa transformation techniques and impress your audience. This template can be altered and modified as per your expectations. So, grab it now.
-
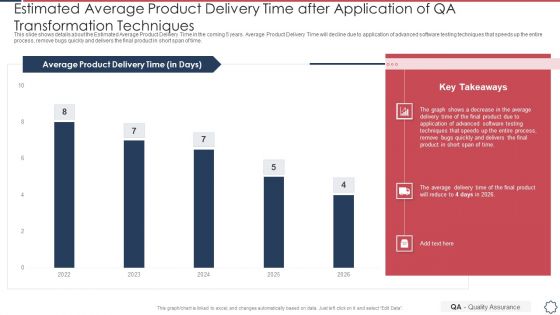
Quality Assurance Transformation Strategies To Improve Business Performance Efficiency Estimated Average Product Delivery Brochure PDF
This slide shows details about the Estimated Average Product Delivery Time in the coming 5 years. Average Product Delivery Time will decline due to application of advanced software testing techniques that speeds up the entire process, remove bugs quickly and delivers the final product in short span of time. Deliver an awe inspiring pitch with this creative quality assurance transformation strategies to improve business performance efficiency estimated average product delivery brochure pdf bundle. Topics like product delivery time can be discussed with this completely editable template. It is available for immediate download depending on the needs and requirements of the user.
-
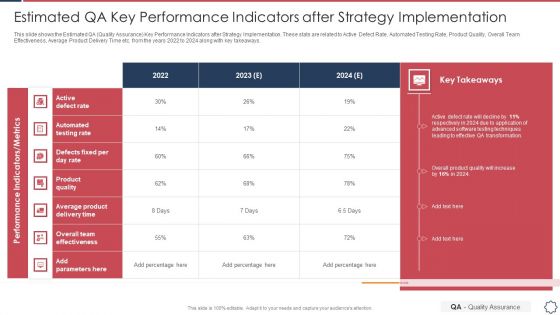
Quality Assurance Transformation Strategies To Improve Business Performance Efficiency Estimated QA Key Performance Topics PDF
This slide shows the Estimated QA Quality Assurance Key Performance Indicators after Strategy Implementation. These stats are related to Active Defect Rate, Automated Testing Rate, Product Quality, Overall Team Effectiveness, Average Product Delivery Time etc. from the years 2022 to 2024 along with key takeaways. Deliver and pitch your topic in the best possible manner with this quality assurance transformation strategies to improve business performance efficiency estimated qa key performance topics pdf. Use them to share invaluable insights on automated testing rate, average product delivery time, active defect rate and impress your audience. This template can be altered and modified as per your expectations. So, grab it now.
-
Deploying Quality Assurance QA Transformation Estimated QA Key Performance Indicators Ideas PDF
This slide shows the estimated QA quality assurance key performance indicators after strategy implementation. These stats are related to active defect rate, automated testing rate, product quality, overall team effectiveness, average product delivery time etc. From the years 2020 to 2022 along with key takeaways.Deliver and pitch your topic in the best possible manner with this Deploying Quality Assurance QA Transformation Estimated QA Key Performance Indicators Ideas PDF Use them to share invaluable insights on Performance Indicators, Automated Testing, Overall Team Effectiveness and impress your audience. This template can be altered and modified as per your expectations. So, grab it now.
-
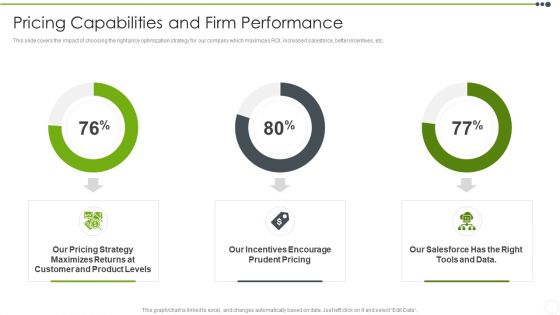
Estimating The Price Pricing Capabilities And Firm Performance Topics PDF
This slide covers the impact of choosing the right price optimization strategy for our company which maximizes ROI, increased salesforce, better incentives, etc. Deliver and pitch your topic in the best possible manner with this Estimating The Price Pricing Capabilities And Firm Performance Topics PDF. Use them to share invaluable insights on Data, Salesforce, Pricing, Strategy, Customer and impress your audience. This template can be altered and modified as per your expectations. So, grab it now.
-
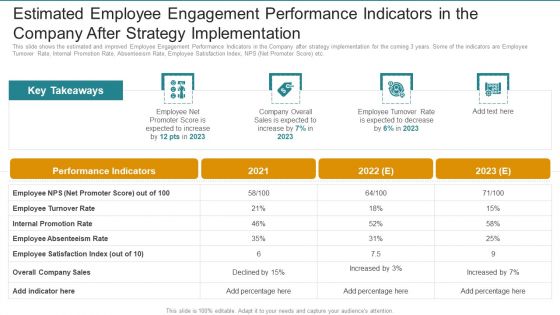
Estimated Employee Engagement Performance Indicators In The Company After Strategy Implementation Portrait PDF
This slide shows the estimated and improved Employee Engagement Performance Indicators in the Company after strategy implementation for the coming 3 years. Some of the indicators are Employee Turnover Rate, Internal Promotion Rate, Absenteeism Rate, Employee Satisfaction Index, NPS Net Promoter Score etc. Presenting Estimated Employee Engagement Performance Indicators In The Company After Strategy Implementation Portrait PDF to provide visual cues and insights. Share and navigate important information on four stages that need your due attention. This template can be used to pitch topics like Employee Turnover Rate, Internal Promotion Rate, Employee Absenteeism Rate. In addtion, this PPT design contains high resolution images, graphics, etc, that are easily editable and available for immediate download.
-
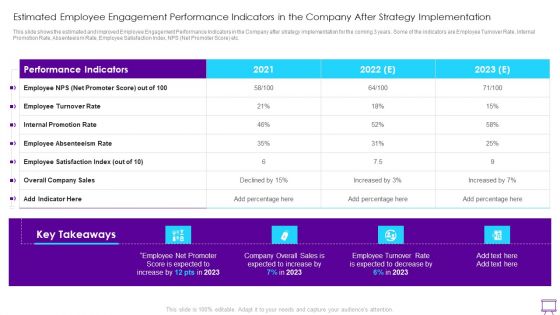
Estimated Employee Engagement Performance Indicators In The Company After Strategy Implementation Microsoft PDF
This slide shows the estimated and improved Employee Engagement Performance Indicators in the Company after strategy implementation for the coming 3 years. Some of the indicators are Employee Turnover Rate, Internal Promotion Rate, Absenteeism Rate, Employee Satisfaction Index, NPS Net Promoter Score etc. Deliver an awe inspiring pitch with this creative Estimated Employee Engagement Performance Indicators In The Company After Strategy Implementation Microsoft PDF bundle. Topics like Performance Indicators, Internal Promotion, Employee Satisfaction can be discussed with this completely editable template. It is available for immediate download depending on the needs and requirements of the user.
-
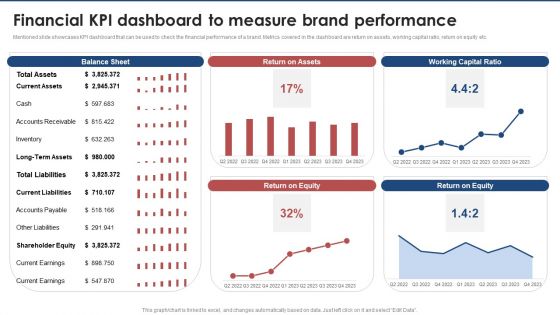
Financial Kpi Dashboard To Measure Brand Performance Brand Value Estimation Guide Inspiration PDF
Mentioned slide showcases KPI dashboard that can be used to check the financial performance of a brand. Metrics covered in the dashboard are return on assets, working capital ratio, return on equity etc.Are you in need of a template that can accommodate all of your creative concepts This one is crafted professionally and can be altered to fit any style. Use it with Google Slides or PowerPoint. Include striking photographs, symbols, depictions, and other visuals. Fill, move around, or remove text boxes as desired. Test out color palettes and font mixtures. Edit and save your work, or work with colleagues. Download Financial Kpi Dashboard To Measure Brand Performance Brand Value Estimation Guide Inspiration PDF and observe how to make your presentation outstanding. Give an impeccable presentation to your group and make your presentation unforgettable.
-
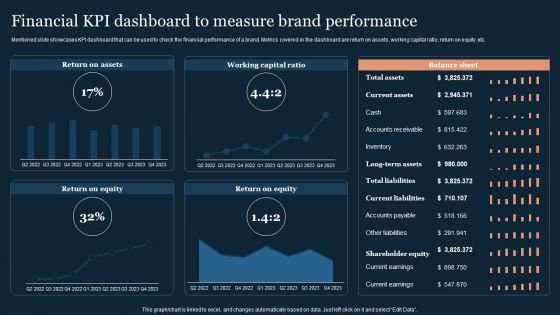
Guide To Develop And Estimate Brand Value Financial KPI Dashboard To Measure Brand Performance Formats PDF
Mentioned slide showcases KPI dashboard that can be used to check the financial performance of a brand. Metrics covered in the dashboard are return on assets, working capital ratio, return on equity etc.Coming up with a presentation necessitates that the majority of the effort goes into the content and the message you intend to convey. The visuals of a PowerPoint presentation can only be effective if it supplements and supports the story that is being told. Keeping this in mind our experts created Guide To Develop And Estimate Brand Value Financial KPI Dashboard To Measure Brand Performance Formats PDF to reduce the time that goes into designing the presentation. This way, you can concentrate on the message while our designers take care of providing you with the right template for the situation.
-
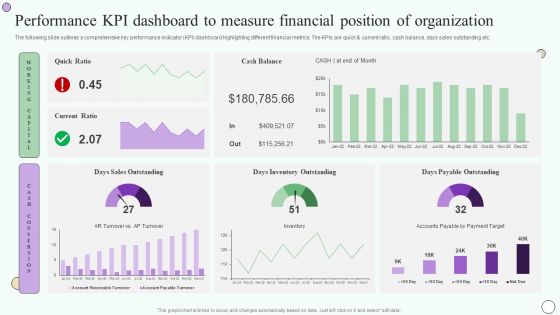
Estimating Business Overall Performance Kpi Dashboard To Measure Financial Position Inspiration PDF
The following slide outlines a comprehensive key performance indicator KPI dashboard highlighting different financial metrics. The KPIs are quick and current ratio, cash balance, days sales outstanding etc. Welcome to our selection of the Estimating Business Overall Performance Kpi Dashboard To Measure Financial Position Inspiration PDF. These are designed to help you showcase your creativity and bring your sphere to life. Planning and Innovation are essential for any business that is just starting out. This collection contains the designs that you need for your everyday presentations. All of our PowerPoints are 100 percent editable, so you can customize them to suit your needs. This multi-purpose template can be used in various situations. Grab these presentation templates today.
-
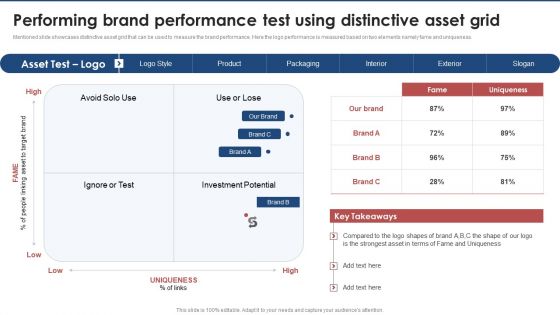
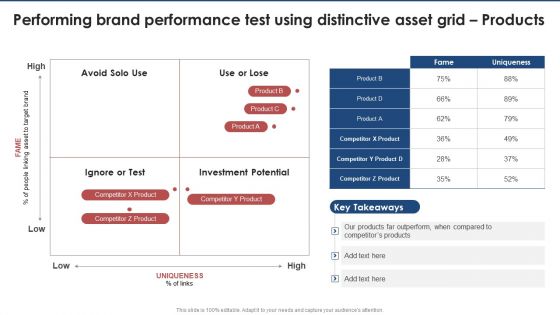
Performing Brand Performance Test Using Distinctive Asset Grid Brand Value Estimation Guide Microsoft PDF
Mentioned slide showcases distinctive asset grid that can be used to measure the brand performance. Here the logo performance is measured based on two elements namely fame and uniqueness. Presenting this PowerPoint presentation, titled Performing Brand Performance Test Using Distinctive Asset Grid Brand Value Estimation Guide Microsoft PDF, with topics curated by our researchers after extensive research. This editable presentation is available for immediate download and provides attractive features when used. Download now and captivate your audience. Presenting this Performing Brand Performance Test Using Distinctive Asset Grid Brand Value Estimation Guide Microsoft PDF. Our researchers have carefully researched and created these slides with all aspects taken into consideration. This is a completely customizable Performing Brand Performance Test Using Distinctive Asset Grid Brand Value Estimation Guide Microsoft PDF that is available for immediate downloading. Download now and make an impact on your audience. Highlight the attractive features available with our PPTs.
-
Performing Brand Performance Test Using Distinctive Asset Grid Products Brand Value Estimation Guide Portrait PDF
Here you can discover an assortment of the finest PowerPoint and Google Slides templates. With these templates, you can create presentations for a variety of purposes while simultaneously providing your audience with an eye-catching visual experience. Download Performing Brand Performance Test Using Distinctive Asset Grid Products Brand Value Estimation Guide Portrait PDF to deliver an impeccable presentation. These templates will make your job of preparing presentations much quicker, yet still, maintain a high level of quality. Slidegeeks has experienced researchers who prepare these templates and write high-quality content for you. Later on, you can personalize the content by editing the Performing Brand Performance Test Using Distinctive Asset Grid Products Brand Value Estimation Guide Portrait PDF.
-
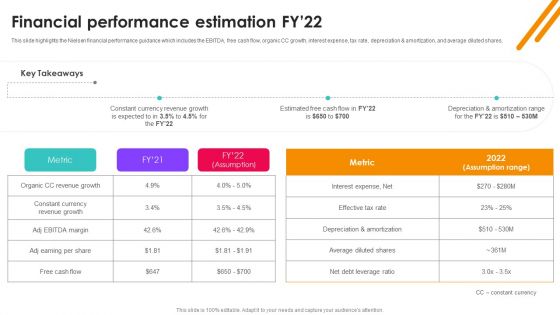
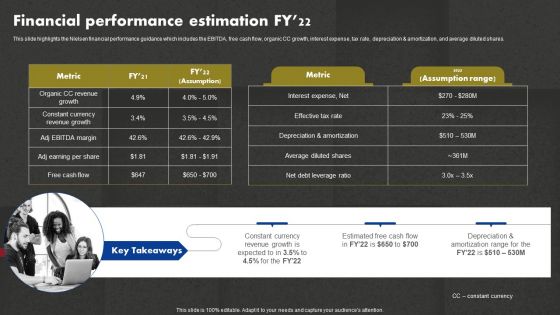
Nielsen Business Profile Financial Performance Estimation Fy22 Ppt PowerPoint Presentation File Diagrams PDF
This slide highlights the Nielsen financial performance guidance which includes the EBITDA, free cash flow, organic CC growth, interest expense, tax rate, depreciation and amortization, and average diluted shares. Coming up with a presentation necessitates that the majority of the effort goes into the content and the message you intend to convey. The visuals of a PowerPoint presentation can only be effective if it supplements and supports the story that is being told. Keeping this in mind our experts created Nielsen Business Profile Financial Performance Estimation Fy22 Ppt PowerPoint Presentation File Diagrams PDF to reduce the time that goes into designing the presentation. This way, you can concentrate on the message while our designers take care of providing you with the right template for the situation.
-
Guide To Develop And Estimate Brand Value Performing Brand Performance Test Using Distinctive Asset Grid Products Template PDF
Boost your pitch with our creative Guide To Develop And Estimate Brand Value Performing Brand Performance Test Using Distinctive Asset Grid Products Template PDF. Deliver an awe-inspiring pitch that will mesmerize everyone. Using these presentation templates you will surely catch everyones attention. You can browse the ppts collection on our website. We have researchers who are experts at creating the right content for the templates. So you do not have to invest time in any additional work. Just grab the template now and use them.
-
Guide To Develop And Estimate Brand Value Performing Brand Performance Test Using Distinctive Asset Grid Introduction PDF
Mentioned slide showcases distinctive asset grid that can be used to measure the brand performance. Here the logo performance is measured based on two elements namely fame and uniqueness.Create an editable Guide To Develop And Estimate Brand Value Performing Brand Performance Test Using Distinctive Asset Grid Introduction PDF that communicates your idea and engages your audience. Whether you are presenting a business or an educational presentation, pre-designed presentation templates help save time. Guide To Develop And Estimate Brand Value Performing Brand Performance Test Using Distinctive Asset Grid Introduction PDF is highly customizable and very easy to edit, covering many different styles from creative to business presentations. Slidegeeks has creative team members who have crafted amazing templates. So, go and get them without any delay.
-
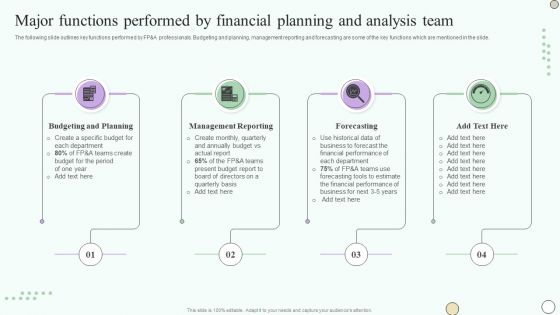
Estimating Business Overall Major Functions Performed By Financial Planning And Analysis Sample PDF
The following slide outlines key functions performed by FPandA professionals. Budgeting and planning, management reporting and forecasting are some of the key functions which are mentioned in the slide. This modern and well-arranged Estimating Business Overall Major Functions Performed By Financial Planning And Analysis Sample PDF provides lots of creative possibilities. It is very simple to customize and edit with the Powerpoint Software. Just drag and drop your pictures into the shapes. All facets of this template can be edited with Powerpoint, no extra software is necessary. Add your own material, put your images in the places assigned for them, adjust the colors, and then you can show your slides to the world, with an animated slide included.
-
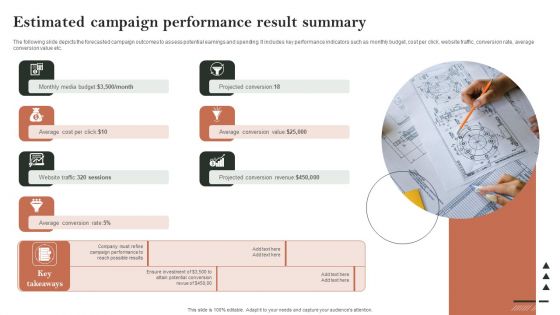
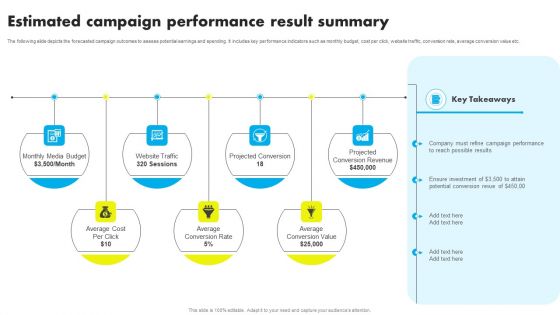
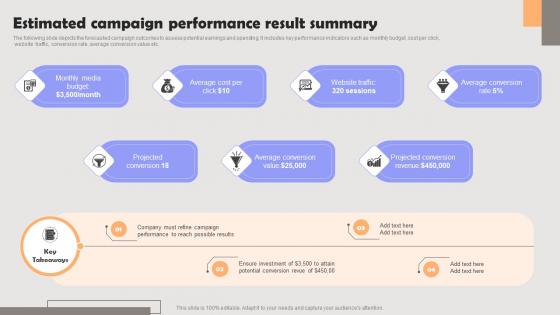
Search Engine Marketing Estimated Campaign Performance Result Summary Designs PDF
The following slide depicts the forecasted campaign outcomes to assess potential earnings and spending. It includes key performance indicators such as monthly budget, cost per click, website traffic, conversion rate, average conversion value etc. Do you know about Slidesgeeks Search Engine Marketing Estimated Campaign Performance Result Summary Designs PDF These are perfect for delivering any kind od presentation. Using it, create PowerPoint presentations that communicate your ideas and engage audiences. Save time and effort by using our pre-designed presentation templates that are perfect for a wide range of topic. Our vast selection of designs covers a range of styles, from creative to business, and are all highly customizable and easy to edit. Download as a PowerPoint template or use them as Google Slides themes.
-
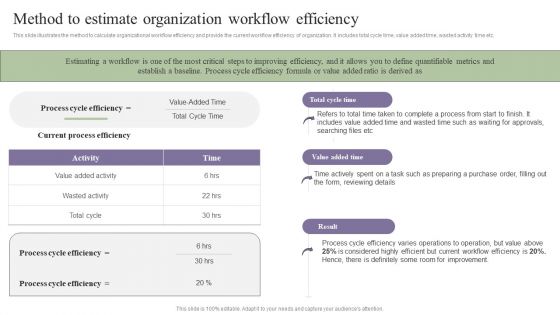
Deployment Of Process Automation To Increase Organisational Performance Method To Estimate Organization Ideas PDF
This slide illustrates the method to calculate organizational workflow efficiency and provide the current workflow efficiency of organization. It includes total cycle time, value added time, wasted activity time etc. Formulating a presentation can take up a lot of effort and time, so the content and message should always be the primary focus. The visuals of the PowerPoint can enhance the presenters message, so our Deployment Of Process Automation To Increase Organisational Performance Method To Estimate Organization Ideas PDF was created to help save time. Instead of worrying about the design, the presenter can concentrate on the message while our designers work on creating the ideal templates for whatever situation is needed. Slidegeeks has experts for everything from amazing designs to valuable content, we have put everything into Deployment Of Process Automation To Increase Organisational Performance Method To Estimate Organization Ideas PDF
-
Market Study Company Outline Financial Performance Estimation FY 22 Demonstration PDF
This slide highlights the Nielsen financial performance guidance which includes the EBITDA, free cash flow, organic CC growth, interest expense, tax rate, depreciation and amortization, and average diluted shares. Take your projects to the next level with our ultimate collection of Market Study Company Outline Financial Performance Estimation FY 22 Demonstration PDF Slidegeeks has designed a range of layouts that are perfect for representing task or activity duration, keeping track of all your deadlines at a glance. Tailor these designs to your exact needs and give them a truly corporate look with your own brand colors they will make your projects stand out from the rest.
-
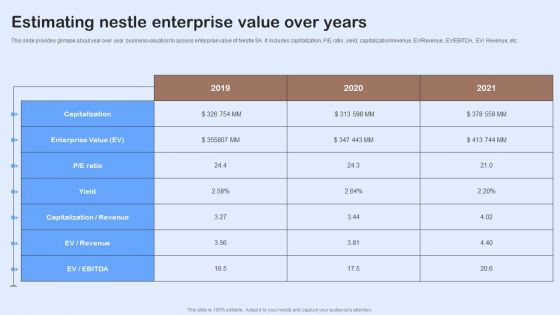
Nestle Performance Management Report Estimating Nestle Enterprise Value Over Years Mockup PDF
This slide provides glimpse about year over year business valuation to assess enterprise value of Nestle SA. It includes capitalization, P or E ratio, yield, capitalization or revenue, EV or Revenue, EV or EBITDA, EV or Revenue, etc. Find highly impressive Nestle Performance Management Report Estimating Nestle Enterprise Value Over Years Mockup PDF on Slidegeeks to deliver a meaningful presentation. You can save an ample amount of time using these presentation templates. No need to worry to prepare everything from scratch because Slidegeeks experts have already done a huge research and work for you. You need to download Nestle Performance Management Report Estimating Nestle Enterprise Value Over Years Mockup PDF for your upcoming presentation. All the presentation templates are 100 percent editable and you can change the color and personalize the content accordingly. Download now.
-
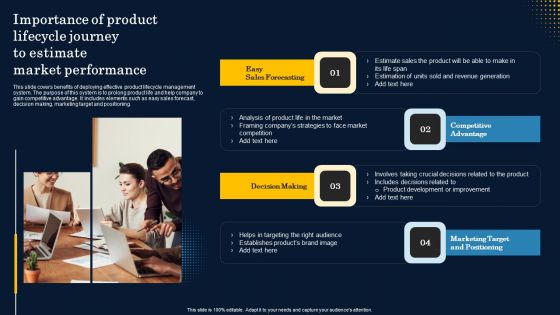
Importance Of Product Lifecycle Journey To Estimate Market Performance Summary PDF
This slide covers benefits of deploying effective product lifecycle management system. The purpose of this system is to prolong product life and help company to gain competitive advantage. It includes elements such as easy sales forecast, decision making, marketing target and positioning. From laying roadmaps to briefing everything in detail, our templates are perfect for you. You can set the stage with your presentation slides. All you have to do is download these easy to edit and customizable templates. Importance Of Product Lifecycle Journey To Estimate Market Performance Summary PDF will help you deliver an outstanding performance that everyone would remember and praise you for. Do download this presentation today.
-
Estimated Campaign Performance Result Summary Ppt Slide PDF
The following slide depicts the forecasted campaign outcomes to assess potential earnings and spending. It includes key performance indicators such as monthly budget, cost per click, website traffic, conversion rate, average conversion value etc. Coming up with a presentation necessitates that the majority of the effort goes into the content and the message you intend to convey. The visuals of a PowerPoint presentation can only be effective if it supplements and supports the story that is being told. Keeping this in mind our experts created Estimated Campaign Performance Result Summary Ppt Slide PDF to reduce the time that goes into designing the presentation. This way, you can concentrate on the message while our designers take care of providing you with the right template for the situation.
-
Data And Customer Analysis Company Outline Financial Performance Estimation FY22 Pictures PDF
This slide highlights the Nielsen financial performance guidance which includes the EBITDA, free cash flow, organic CC growth, interest expense, tax rate, depreciation and amortization, and average diluted shares. Formulating a presentation can take up a lot of effort and time, so the content and message should always be the primary focus. The visuals of the PowerPoint can enhance the presenters message, so our Data And Customer Analysis Company Outline Financial Performance Estimation FY22 Pictures PDF was created to help save time. Instead of worrying about the design, the presenter can concentrate on the message while our designers work on creating the ideal templates for whatever situation is needed. Slidegeeks has experts for everything from amazing designs to valuable content, we have put everything into Data And Customer Analysis Company Outline Financial Performance Estimation FY22 Pictures PDF
-
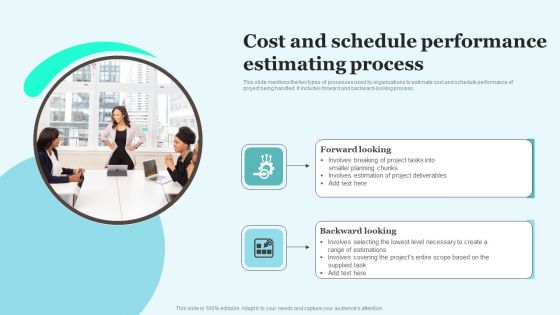
Cost And Schedule Performance Estimating Process Brochure PDF
This slide mentions the two types of processes used by organizations to estimate cost and schedule performance of project being handled. It includes forward and backward-looking process. Persuade your audience using this Cost And Schedule Performance Estimating Process Brochure PDF. This PPT design covers two stages, thus making it a great tool to use. It also caters to a variety of topics including Forward Looking, Backward Looking. Download this PPT design now to present a convincing pitch that not only emphasizes the topic but also showcases your presentation skills.
-
Improving PPC Campaign Results Estimated Campaign Performance Result Information Pdf
The following slide depicts the forecasted campaign outcomes to assess potential earnings and spending. It includes key performance indicators such as monthly budget, cost per click, website traffic, conversion rate, average conversion value etc. Crafting an eye-catching presentation has never been more straightforward. Let your presentation shine with this tasteful yet straightforward Improving PPC Campaign Results Estimated Campaign Performance Result Information Pdf template. It offers a minimalistic and classy look that is great for making a statement. The colors have been employed intelligently to add a bit of playfulness while still remaining professional. Construct the ideal Improving PPC Campaign Results Estimated Campaign Performance Result Information Pdf that effortlessly grabs the attention of your audience. Begin now and be certain to wow your customers.


