Data visualization tools PowerPoint Presentation Templates and Google Slides
-
Big Data Visual Tool Box Diagram Ppt Infographic Template
This is a big data visual tool box diagram ppt infographic template. This is a five stage process. The stages in this process are volume, cloud, velocity, big data, variety.
-
Data Governance Steps Review Tools Setup Ppt PowerPoint Presentation Visual Aids Diagrams
This is a data governance steps review tools setup ppt powerpoint presentation visual aids diagrams. This is a five stage process. The stages in this process are data analysis, data review, data evaluation.
-
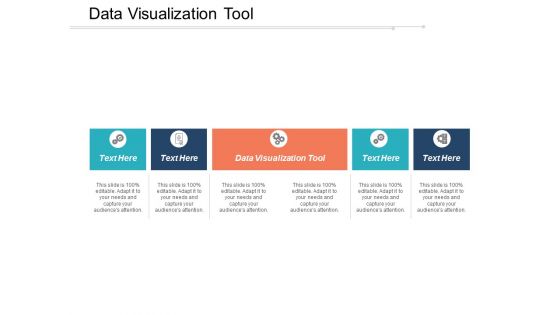
Data Visualization Tool Ppt PowerPoint Presentation Summary Visuals Cpb
Presenting this set of slides with name data visualization tool ppt powerpoint presentation summary visuals cpb. This is an editable Powerpoint five stages graphic that deals with topics like data visualization tool to help convey your message better graphically. This product is a premium product available for immediate download and is 100 percent editable in Powerpoint. Download this now and use it in your presentations to impress your audience.
-
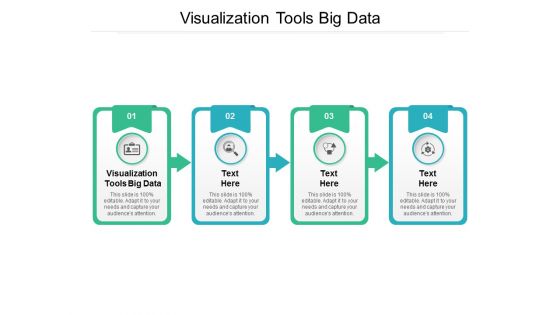
Visualization Tools Big Data Ppt PowerPoint Presentation Summary Outline Cpb
Presenting this set of slides with name visualization tools big data ppt powerpoint presentation summary outline cpb. This is an editable Powerpoint four stages graphic that deals with topics like visualization tools big data to help convey your message better graphically. This product is a premium product available for immediate download and is 100 percent editable in Powerpoint. Download this now and use it in your presentations to impress your audience.
-
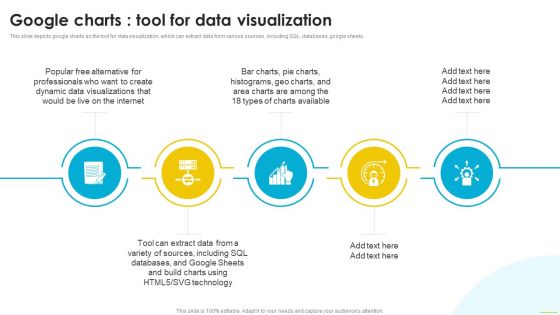
Graphical Representation Of Research IT Google Charts Tool For Data Visualization Introduction PDF
This slide depicts google charts as the tool for data visualization, which can extract data from various sources, including SQL, databases, google sheets. This is a graphical representation of research it google charts tool for data visualization introduction pdf template with various stages. Focus and dispense information on five stages using this creative set, that comes with editable features. It contains large content boxes to add your information on topics like dynamic, databases, sources, technology. You can also showcase facts, figures, and other relevant content using this PPT layout. Grab it now.
-
Departments Of Visualization Research Google Charts Tool For Data Visualization Themes PDF
This slide depicts google charts as the tool for data visualization, which can extract data from various sources, including SQL, databases, google sheets.This is a Departments Of Visualization Research Google Charts Tool For Data Visualization Themes PDF template with various stages. Focus and dispense information on five stages using this creative set, that comes with editable features. It contains large content boxes to add your information on topics like Popular Free Alternative, Create Dynamic Data, Including SQL Databases You can also showcase facts, figures, and other relevant content using this PPT layout. Grab it now.
-
Departments Of Visualization Research Highcharts As Data Visualization Research Tool Ideas PDF
This slide represents another data visualization research tool that provides a high level of compatibility and is also a popular tool for commercial use.Presenting Departments Of Visualization Research Highcharts As Data Visualization Research Tool Ideas PDF to provide visual cues and insights. Share and navigate important information on four stages that need your due attention. This template can be used to pitch topics like Integrate Interactive, Necessitates The Purchase, Javascript Chart Framework In addtion, this PPT design contains high resolution images, graphics, etc, that are easily editable and available for immediate download.
-
Google Charts Tool For Data Visualization Rules PDF
This slide depicts google charts as the tool for data visualization, which can extract data from various sources, including SQL, databases, google sheets. From laying roadmaps to briefing everything in detail, our templates are perfect for you. You can set the stage with your presentation slides. All you have to do is download these easy to edit and customizable templates. Google Charts Tool For Data Visualization Rules PDF will help you deliver an outstanding performance that everyone would remember and praise you for. Do download this presentation today.
-
Highcharts As Data Visualization Research Tool Elements PDF
This slide represents another data visualization research tool that provides a high level of compatibility and is also a popular tool for commercial use. Present like a pro with Highcharts As Data Visualization Research Tool Elements PDF Create beautiful presentations together with your team, using our easy to use presentation slides. Share your ideas in real time and make changes on the fly by downloading our templates. So whether you are in the office, on the go, or in a remote location, you can stay in sync with your team and present your ideas with confidence. With Slidegeeks presentation got a whole lot easier. Grab these presentations today.
-
Table Of Contents For Data And Information Visualization Tool Structure PDF
Whether you have daily or monthly meetings, a brilliant presentation is necessary. Table Of Contents For Data And Information Visualization Tool Structure PDF can be your best option for delivering a presentation. Represent everything in detail using Table Of Contents For Data And Information Visualization Tool Structure PDF and make yourself stand out in meetings. The template is versatile and follows a structure that will cater to your requirements. All the templates prepared by Slidegeeks are easy to download and edit. Our research experts have taken care of the corporate themes as well. So, give it a try and see the results.
-
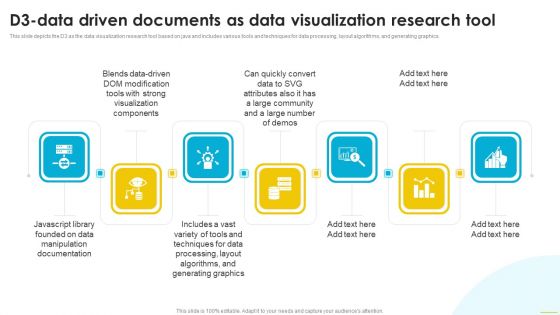
D3 Data Driven Documents As Data Visualization Research Tool Brochure PDF
This slide depicts the D3 as the data visualization research tool based on java and includes various tools and techniques for data processing, layout algorithms, and generating graphics. Crafting an eye catching presentation has never been more straightforward. Let your presentation shine with this tasteful yet straightforward D3 Data Driven Documents As Data Visualization Research Tool Brochure PDF template. It offers a minimalistic and classy look that is great for making a statement. The colors have been employed intelligently to add a bit of playfulness while still remaining professional. Construct the ideal D3 Data Driven Documents As Data Visualization Research Tool Brochure PDF that effortlessly grabs the attention of your audience Begin now and be certain to wow your customers.
-
Branches For Visualization Research And Development Google Charts Tool For Data Elements PDF
This slide depicts google charts as the tool for data visualization, which can extract data from various sources, including SQL, databases, google sheets. Do you have an important presentation coming up Are you looking for something that will make your presentation stand out from the rest Look no further than Branches For Visualization Research And Development Google Charts Tool For Data Elements PDF. With our professional designs, you can trust that your presentation will pop and make delivering it a smooth process. And with Slidegeeks, you can trust that your presentation will be unique and memorable. So why wait Grab Branches For Visualization Research And Development Google Charts Tool For Data Elements PDF today and make your presentation stand out from the rest.
-
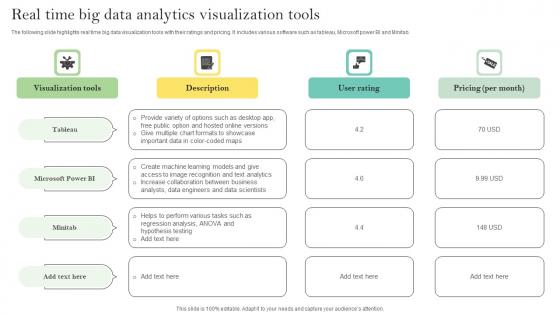
Real Time Big Data Analytics Visualization Tools Ppt Portfolio Example Pdf
The following slide highlights real time big data visualization tools with their ratings and pricing. It includes various software such as tableau, Microsoft power BI and Minitab. Pitch your topic with ease and precision using this Real Time Big Data Analytics Visualization Tools Ppt Portfolio Example Pdf. This layout presents information on Visualization Tools, User Rating, Pricing Per Month. It is also available for immediate download and adjustment. So, changes can be made in the color, design, graphics or any other component to create a unique layout.
-
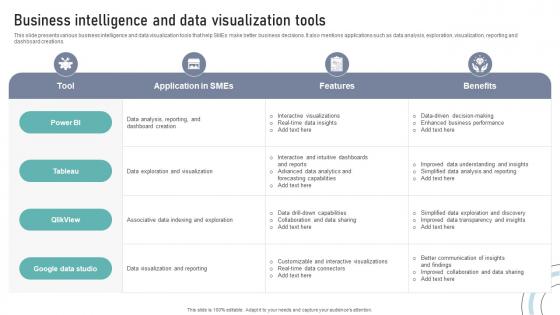
Business Intelligence And Data Visualization Tools DT SS V
This slide presents various business intelligence and data visualization tools that help SMEs make better business decisions. It also mentions applications such as data analysis, exploration, visualization, reporting and dashboard creations.Present like a pro with Business Intelligence And Data Visualization Tools DT SS V. Create beautiful presentations together with your team, using our easy-to-use presentation slides. Share your ideas in real-time and make changes on the fly by downloading our templates. So whether you are in the office, on the go, or in a remote location, you can stay in sync with your team and present your ideas with confidence. With Slidegeeks presentation got a whole lot easier. Grab these presentations today.
-
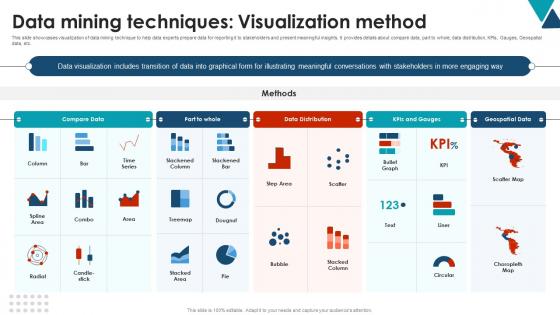
Data Mining Techniques Visualization Method Using Data Mining Tools To Optimize Processes AI SS V
This slide showcases visualization of data mining technique to help data experts prepare data for reporting it to stakeholders and present meaningful insights. It provides details about compare data, part to whole, data distribution, KPIs, Gauges, Geospatial data, etc. Here you can discover an assortment of the finest PowerPoint and Google Slides templates. With these templates, you can create presentations for a variety of purposes while simultaneously providing your audience with an eye-catching visual experience. Download Data Mining Techniques Visualization Method Using Data Mining Tools To Optimize Processes AI SS V to deliver an impeccable presentation. These templates will make your job of preparing presentations much quicker, yet still, maintain a high level of quality. Slidegeeks has experienced researchers who prepare these templates and write high-quality content for you. Later on, you can personalize the content by editing the Data Mining Techniques Visualization Method Using Data Mining Tools To Optimize Processes AI SS V.
-
Statistical Tools For Evidence Dashboard For Data Visualization And Analytics
This slide represents the dashboard to track statistical data analysis process. The purpose of this slide is to provide a graphical representation of total sessions, bounce rate, goal completions, goal completion rate, top channels over time, etc. Are you in need of a template that can accommodate all of your creative concepts This one is crafted professionally and can be altered to fit any style. Use it with Google Slides or PowerPoint. Include striking photographs, symbols, depictions, and other visuals. Fill, move around, or remove text boxes as desired. Test out color palettes and font mixtures. Edit and save your work, or work with colleagues. Download Statistical Tools For Evidence Dashboard For Data Visualization And Analytics and observe how to make your presentation outstanding. Give an impeccable presentation to your group and make your presentation unforgettable.
-
Statistical Tools For Evidence Data Analytics To Improve Visualization For Us Manufacturers
This slide represents the concise overview of the problem, the proposed solution, and the achieved result for using data analytics to improve visualization for US manufacturers. The problems were poor data performance, unmanageable reporting, etc. Crafting an eye-catching presentation has never been more straightforward. Let your presentation shine with this tasteful yet straightforward Statistical Tools For Evidence Data Analytics To Improve Visualization For Us Manufacturers template. It offers a minimalistic and classy look that is great for making a statement. The colors have been employed intelligently to add a bit of playfulness while still remaining professional. Construct the ideal Statistical Tools For Evidence Data Analytics To Improve Visualization For Us Manufacturers that effortlessly grabs the attention of your audience Begin now and be certain to wow your customers


