Data visualizatio PowerPoint Presentation Templates and Google Slides
-
Graphical Representation Of Research IT Highcharts As Data Visualization Research Demonstration PDF
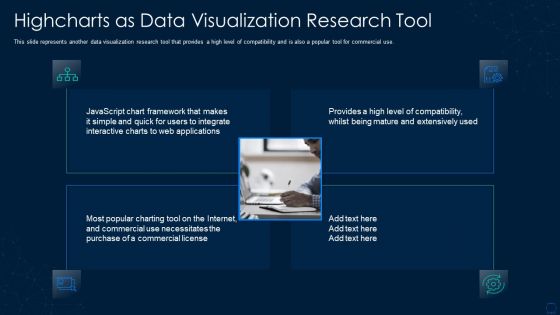
This slide represents another data visualization research tool that provides a high level of compatibility and is also a popular tool for commercial use. This is a graphical representation of research it highcharts as data visualization research demonstration pdf template with various stages. Focus and dispense information on four stages using this creative set, that comes with editable features. It contains large content boxes to add your information on topics like highcharts as data visualization research tool. You can also showcase facts, figures, and other relevant content using this PPT layout. Grab it now.
-
Graphical Representation Of Research IT Data Visualization Helps In Academic Research Microsoft PDF
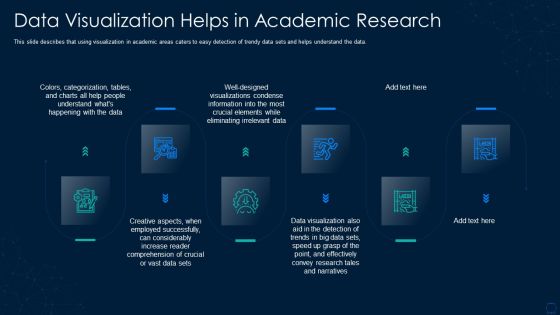
This slide describes that using visualization in academic areas caters to easy detection of trendy data sets and helps understand the data. Presenting graphical representation of research it data visualization helps in academic research microsoft pdf to provide visual cues and insights. Share and navigate important information on six stages that need your due attention. This template can be used to pitch topics like data visualization helps in academic research. In addtion, this PPT design contains high resolution images, graphics, etc, that are easily editable and available for immediate download.
-
Graphical Representation Of Research IT Google Charts Tool For Data Visualization Introduction PDF
This slide depicts google charts as the tool for data visualization, which can extract data from various sources, including SQL, databases, google sheets. This is a graphical representation of research it google charts tool for data visualization introduction pdf template with various stages. Focus and dispense information on five stages using this creative set, that comes with editable features. It contains large content boxes to add your information on topics like dynamic, databases, sources, technology. You can also showcase facts, figures, and other relevant content using this PPT layout. Grab it now.
-
Oracle Analytics Cloud Solutions Powerful Data Visualization Template PDF
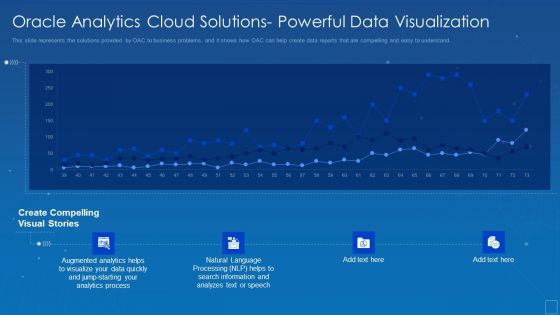
This slide represents the predictive analytics solution of the oracle analytics cloud and how it is helpful to predict outputs and display quickly with the help of ML. Deliver an awe inspiring pitch with this creative oracle analytics cloud solutions powerful data visualization template pdf bundle. Topics like oracle analytics cloud solutions powerful data visualization can be discussed with this completely editable template. It is available for immediate download depending on the needs and requirements of the user.
-
Oracle Cloud Data Analytics Administration IT Oracle Data Visualization Cloud Service DVCS Inspiration PDF
This slide depicts the data visualization service provided by the oracle analytics cloud and how it allows users to experiment with data easily to visualize data from different perspectives. Deliver an awe inspiring pitch with this creative oracle cloud data analytics administration it oracle data visualization cloud service dvcs inspiration pdf bundle. Topics like experiments, representations, sources, visualizations can be discussed with this completely editable template. It is available for immediate download depending on the needs and requirements of the user.
-
Augmented Analytics Implementation IT Data Visualization With Augmented Analytics Microsoft PDF
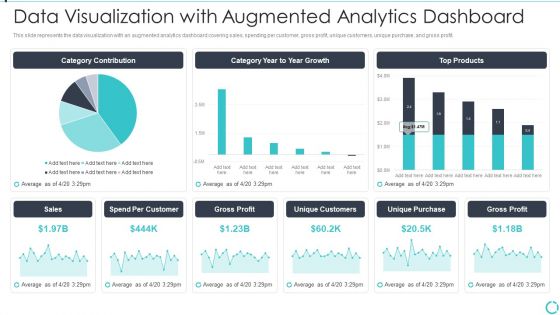
This slide represents the data visualization with an augmented analytics dashboard covering sales, spending per customer, gross profit, unique customers, unique purchase, and gross profit. Deliver an awe inspiring pitch with this creative Augmented Analytics Implementation IT Data Visualization With Augmented Analytics Microsoft PDF bundle. Topics like Category Contribution, Category Year To Year Growth, Top Products, Sales, Gross Profit can be discussed with this completely editable template. It is available for immediate download depending on the needs and requirements of the user.
-
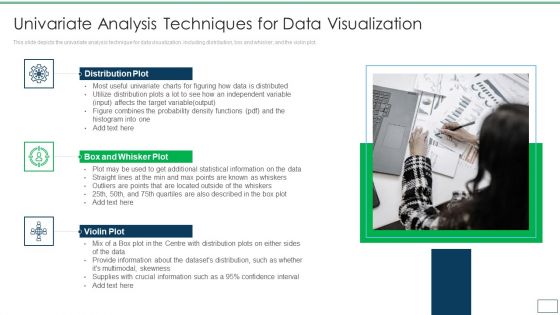
Departments Of Visualization Research Univariate Analysis Techniques For Data Visualization Microsoft PDF
This slide depicts the univariate analysis technique for data visualization, including distribution, box and whisker, and the violin plot.This is a Departments Of Visualization Research Univariate Analysis Techniques For Data Visualization Microsoft PDF template with various stages. Focus and dispense information on three stages using this creative set, that comes with editable features. It contains large content boxes to add your information on topics like Distribution Plot, Box And Whisker Plot, Violin Plot You can also showcase facts, figures, and other relevant content using this PPT layout. Grab it now.
-
Departments Of Visualization Research Bivariate Analysis Techniques For Data Visualization Ideas PDF
This slide describes the second analysis technique, bivariate analysis for data visualization, which includes three plots line, bar, and scatter.This is a Departments Of Visualization Research Bivariate Analysis Techniques For Data Visualization Ideas PDF template with various stages. Focus and dispense information on three stages using this creative set, that comes with editable features. It contains large content boxes to add your information on topics like Effective In Evaluating, Displaying Basic, Range Of Applications, Including You can also showcase facts, figures, and other relevant content using this PPT layout. Grab it now.
-
Departments Of Visualization Research D3 Data Driven Documents As Data Visualization Structure PDF
This slide depicts the D3 as the data visualization research tool based on java and includes various tools and techniques for data processing, layout algorithms, and generating graphics.Presenting Departments Of Visualization Research D3 Data Driven Documents As Data Visualization Structure PDF to provide visual cues and insights. Share and navigate important information on seven stages that need your due attention. This template can be used to pitch topics like Manipulation Documentation, Visualization Components, Generating Graphics In addtion, this PPT design contains high resolution images, graphics, etc, that are easily editable and available for immediate download.
-
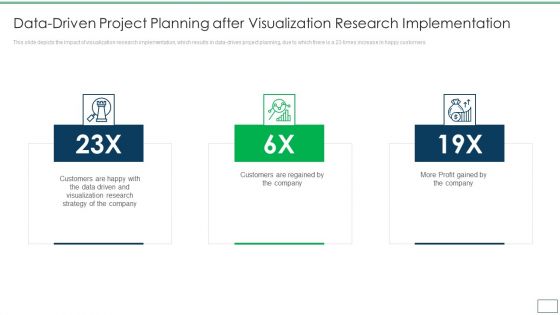
Departments Of Visualization Research Data Driven Project Planning After Visualization Rules PDF
This slide depicts the impact of visualization research implementation, which results in data-driven project planning, due to which there is a 23 times increase in happy customers.This is a Departments Of Visualization Research Data Driven Project Planning After Visualization Rules PDF template with various stages. Focus and dispense information on three stages using this creative set, that comes with editable features. It contains large content boxes to add your information on topics like Visualization Research, Strategy Of The Company, Customers Are Regained You can also showcase facts, figures, and other relevant content using this PPT layout. Grab it now.
-
Departments Of Visualization Research Data Visualization Helps In Academic Research Icons PDF
This slide describes that using visualization in academic areas caters to easy detection of trendy data sets and helps understand the data. Presenting Departments Of Visualization Research Data Visualization Helps In Academic Research Icons PDF to provide visual cues and insights. Share and navigate important information on six stages that need your due attention. This template can be used to pitch topics like Eliminating Irrelevant, Visualizations Condense, Employed Successfully In addtion, this PPT design contains high resolution images, graphics, etc, that are easily editable and available for immediate download.
-
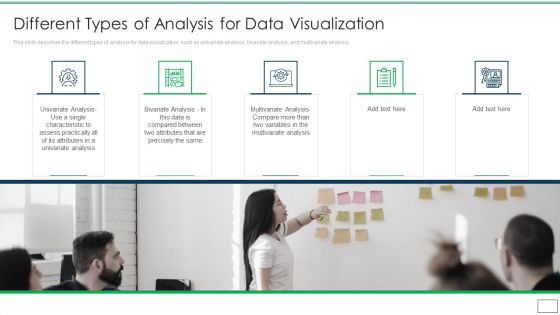
Departments Of Visualization Research Different Types Of Analysis For Data Visualization Summary PDF
This slide describes the different types of analysis for data visualization, such as univariate analysis, bivariate analysis, and multivariate analysis.This is a Departments Of Visualization Research Different Types Of Analysis For Data Visualization Summary PDF template with various stages. Focus and dispense information on five stages using this creative set, that comes with editable features. It contains large content boxes to add your information on topics like Multivariate Analysis, Assess Practically, Univariate Analysis You can also showcase facts, figures, and other relevant content using this PPT layout. Grab it now.
-
Departments Of Visualization Research Google Charts Tool For Data Visualization Themes PDF
This slide depicts google charts as the tool for data visualization, which can extract data from various sources, including SQL, databases, google sheets.This is a Departments Of Visualization Research Google Charts Tool For Data Visualization Themes PDF template with various stages. Focus and dispense information on five stages using this creative set, that comes with editable features. It contains large content boxes to add your information on topics like Popular Free Alternative, Create Dynamic Data, Including SQL Databases You can also showcase facts, figures, and other relevant content using this PPT layout. Grab it now.
-
Departments Of Visualization Research Highcharts As Data Visualization Research Tool Ideas PDF
This slide represents another data visualization research tool that provides a high level of compatibility and is also a popular tool for commercial use.Presenting Departments Of Visualization Research Highcharts As Data Visualization Research Tool Ideas PDF to provide visual cues and insights. Share and navigate important information on four stages that need your due attention. This template can be used to pitch topics like Integrate Interactive, Necessitates The Purchase, Javascript Chart Framework In addtion, this PPT design contains high resolution images, graphics, etc, that are easily editable and available for immediate download.
-
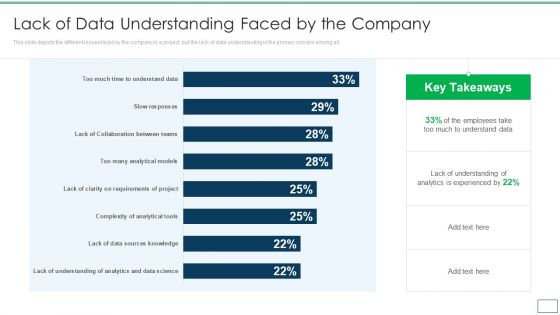
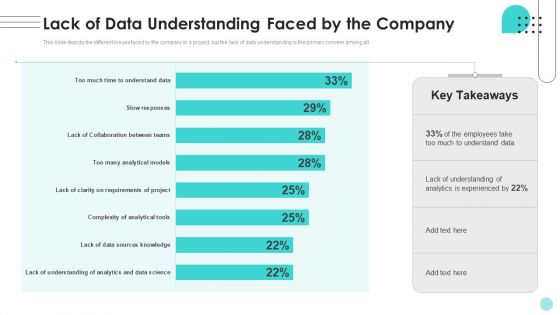
Departments Of Visualization Research Lack Of Data Understanding Faced By The Company Download PDF
This slide depicts the different issues faced by the company in a project, but the lack of data understanding is the primary concern among all.Deliver an awe inspiring pitch with this creative Departments Of Visualization Research Lack Of Data Understanding Faced By The Company Download PDF bundle. Topics like Analytics Is Experienced, Lack Of Understanding, Analytics And Data Science can be discussed with this completely editable template. It is available for immediate download depending on the needs and requirements of the user.
-
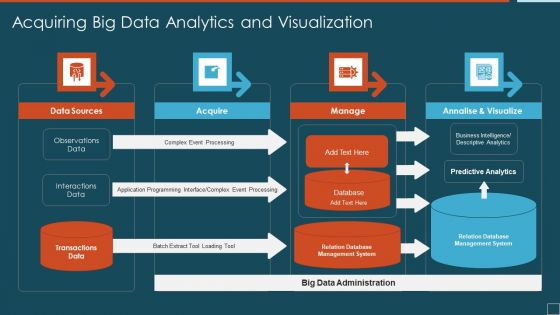
Acquiring Big Data Analytics And Visualization Ideas PDF
Presenting acquiring big data analytics and visualization ideas pdf to dispense important information. This template comprises four stages. It also presents valuable insights into the topics including data sources, acquire, manage. This is a completely customizable PowerPoint theme that can be put to use immediately. So, download it and address the topic impactfully.
-
Cognitive Visualizations Computing Strategy Tracking Customer Data Insights Dashboard Brochure PDF
This slide provides information regarding customer data insights dashboard in terms of average churn risk, segments, high earner, highly engaged customers, etc. Deliver an awe inspiring pitch with this creative Cognitive Visualizations Computing Strategy Tracking Customer Data Insights Dashboard Brochure PDF bundle. Topics like Median Lifetime, Engaged Customers, Return Customers can be discussed with this completely editable template. It is available for immediate download depending on the needs and requirements of the user.
-
Linked Data Visualization Data Quality Dashboard For Linked Data Pictures PDF
This slide describes the data quality dashboard for linked data by covering details of account information quality, contact details quality, financial data quality, and missing account information. Create an editable Linked Data Visualization Data Quality Dashboard For Linked Data Pictures PDF that communicates your idea and engages your audience. Whether youre presenting a business or an educational presentation, pre-designed presentation templates help save time. Linked Data Visualization Data Quality Dashboard For Linked Data Pictures PDF is highly customizable and very easy to edit, covering many different styles from creative to business presentations. Slidegeeks has creative team members who have crafted amazing templates. So, go and get them without any delay.
-
Linked Data Visualization Principles Of Linked Data System Ppt Outline Portrait PDF
This slide represents the principles of linked data, such as using uniform resource identifier names, utilizing HTTP URIs for identification, standards to deliver information to users, and adding links of other uniform resource identifiers. The best PPT templates are a great way to save time, energy, and resources. Slidegeeks have 100 percent editable powerpoint slides making them incredibly versatile. With these quality presentation templates, you can create a captivating and memorable presentation by combining visually appealing slides and effectively communicating your message. Download Linked Data Visualization Principles Of Linked Data System Ppt Outline Portrait PDF from Slidegeeks and deliver a wonderful presentation.
-
Table Of Contents For Data And Information Visualization Background PDF
Explore a selection of the finest Table Of Contents For Data And Information Visualization Background PDF here. With a plethora of professionally designed and pre made slide templates, you can quickly and easily find the right one for your upcoming presentation. You can use our Table Of Contents For Data And Information Visualization Background PDF to effectively convey your message to a wider audience. Slidegeeks has done a lot of research before preparing these presentation templates. The content can be personalized and the slides are highly editable. Grab templates today from Slidegeeks.
-
Social Media Artificial Intelligence Data Visualization Capabilities Dashboard Inspiration PDF
This slide illustrates graphical representation of visualization abilities of artificial intelligence on social media. It includes total impressions, total clicks, performance review etc. Pitch your topic with ease and precision using this Social Media Artificial Intelligence Data Visualization Capabilities Dashboard Inspiration PDF. This layout presents information on Artificial Intelligence, Data Visualization Capabilities. It is also available for immediate download and adjustment. So, changes can be made in the color, design, graphics or any other component to create a unique layout.
-
Branches For Visualization Research And Development Lack Of Data Understanding Faced Introduction PDF
This slide depicts the different issues faced by the company in a project, but the lack of data understanding is the primary concern among all. If you are looking for a format to display your unique thoughts, then the professionally designed Branches For Visualization Research And Development Lack Of Data Understanding Faced Introduction PDF is the one for you. You can use it as a Google Slides template or a PowerPoint template. Incorporate impressive visuals, symbols, images, and other charts. Modify or reorganize the text boxes as you desire. Experiment with shade schemes and font pairings. Alter, share or cooperate with other people on your work. Download Branches For Visualization Research And Development Lack Of Data Understanding Faced Introduction PDF and find out how to give a successful presentation. Present a perfect display to your team and make your presentation unforgettable.
-
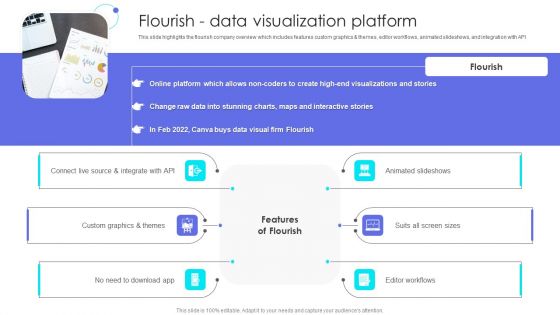
Canva Pro Business Profile Flourish Data Visualization Platform Slides PDF
This slide highlights the flourish company overview which includes features custom graphics and themes, editor workflows, animated slideshows, and integration with API Presenting Canva Pro Business Profile Flourish Data Visualization Platform Slides PDF to provide visual cues and insights. Share and navigate important information on one stages that need your due attention. This template can be used to pitch topics like Connect Live Source, Custom Graphics. In addtion, this PPT design contains high resolution images, graphics, etc, that are easily editable and available for immediate download.
-
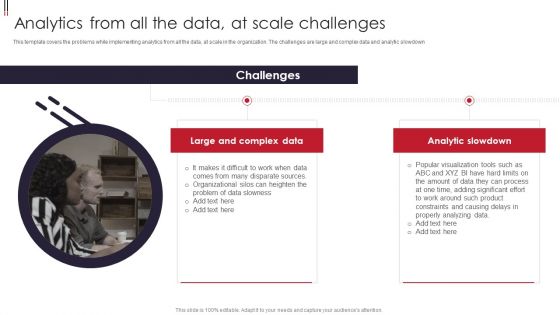
Information Visualizations Playbook Analytics From All The Data At Scale Challenges Structure PDF
This template covers the problems while implementing analytics from all the data, at scale in the organization. The challenges are large and complex data and analytic slowdown. Presenting Information Visualizations Playbook Analytics From All The Data At Scale Challenges Structure PDF to provide visual cues and insights. Share and navigate important information on two stages that need your due attention. This template can be used to pitch topics like Complex Data, Analytic Slowdown. In addtion, this PPT design contains high resolution images, graphics, etc, that are easily editable and available for immediate download.
-
Information Visualizations Playbook Data Science Depends On Six Critical Elements Structure PDF
This template depicts that data science depends on six critical elements, including analytic opportunities, data, analytic techniques, people, technology, and culture, also known as ADAPT C. This is a Information Visualizations Playbook Data Science Depends On Six Critical Elements Structure PDF template with various stages. Focus and dispense information on six stages using this creative set, that comes with editable features. It contains large content boxes to add your information on topics like Data, Analytic Opportunities, Technology. You can also showcase facts, figures, and other relevant content using this PPT layout. Grab it now.
-
Information Visualizations Playbook Final Thoughts For Data Analytics Playbook Pictures PDF
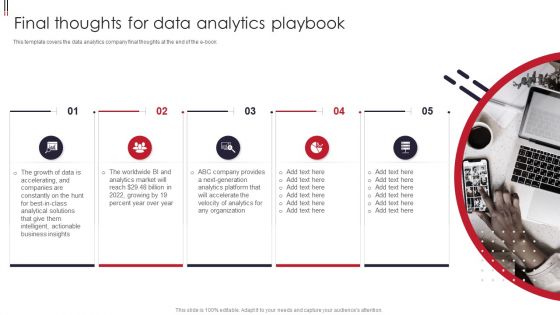
This template covers the data analytics company final thoughts at the end of the e book. Presenting Information Visualizations Playbook Final Thoughts For Data Analytics Playbook Pictures PDF to provide visual cues and insights. Share and navigate important information on five stages that need your due attention. This template can be used to pitch topics like Organization, Business Insights, Growth. In addtion, this PPT design contains high resolution images, graphics, etc, that are easily editable and available for immediate download.
-
Information Visualizations Playbook How To Fix The Business Intelligence Problem Data Analytics Playbook Guidelines PDF
This template covers the solution for BI problems such as analytics transformation and business intelligence program. It also depicts that switching to next generation analytics platform that gives business users data driven insights. This is a Information Visualizations Playbook How To Fix The Business Intelligence Problem Data Analytics Playbook Guidelines PDF template with various stages. Focus and dispense information on five stages using this creative set, that comes with editable features. It contains large content boxes to add your information on topics like Search Driven Analytics, Bridging Business Intelligence, Predictive Analytics. You can also showcase facts, figures, and other relevant content using this PPT layout. Grab it now.
-
Information Visualizations Playbook How To Overcome Automated Data Analysis Powered By Ml Challenges Professional PDF
This template illustrates that automated discovery of insights utilizes machine learning algorithms to analyze billions of data points in seconds to perform complex segmentation, anomaly detection, and trend based analysis without coding. Presenting Information Visualizations Playbook How To Overcome Automated Data Analysis Powered By Ml Challenges Professional PDF to provide visual cues and insights. Share and navigate important information on five stages that need your due attention. This template can be used to pitch topics like Average, Opportunity, Analytics Tools. In addtion, this PPT design contains high resolution images, graphics, etc, that are easily editable and available for immediate download.
-
Information Visualizations Playbook Requirement Of Data Management In BI Projects Ideas PDF
This slide covers the reasons for data management in an organisation such as minimizing the data movement and attention to data security Presenting Information Visualizations Playbook Requirement Of Data Management In BI Projects Ideas PDF to provide visual cues and insights. Share and navigate important information on three stages that need your due attention. This template can be used to pitch topics like Data Security, Use Existing Skills, Minimize Data Movement. In addtion, this PPT design contains high resolution images, graphics, etc, that are easily editable and available for immediate download.
-
Information Visualizations Playbook The Escalating Value Of Data And Analytics Portrait PDF
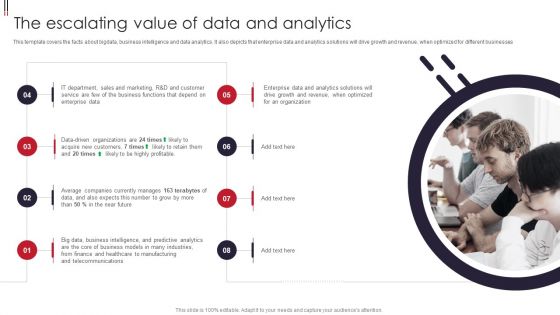
This template covers the facts about bigdata, business intelligence and data analytics. It also depicts that enterprise data and analytics solutions will drive growth and revenue, when optimized for different businesses. This is a Information Visualizations Playbook The Escalating Value Of Data And Analytics Portrait PDF template with various stages. Focus and dispense information on eight stages using this creative set, that comes with editable features. It contains large content boxes to add your information on topics like Data Driven Organizations, Acquire New Customers, Profitable. You can also showcase facts, figures, and other relevant content using this PPT layout. Grab it now.
-
Information Visualizations Playbook The Problem With Todays BI Projects Data Analytics Playbook Portrait PDF
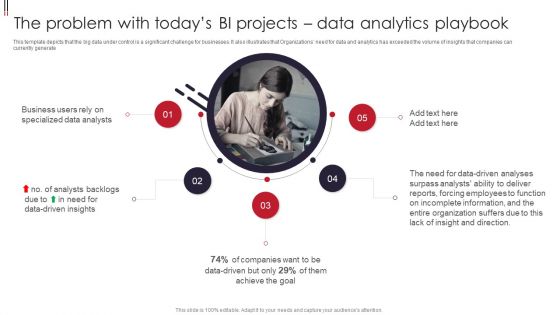
This template depicts that the big data under control is a significant challenge for businesses. It also illustrates that Organizations need for data and analytics has exceeded the volume of insights that companies can currently generate. Presenting Information Visualizations Playbook The Problem With Todays BI Projects Data Analytics Playbook Portrait PDF to provide visual cues and insights. Share and navigate important information on five stages that need your due attention. This template can be used to pitch topics like Business Users, Specialized Data Analysts, Data Driven Insights. In addtion, this PPT design contains high resolution images, graphics, etc, that are easily editable and available for immediate download.
-
Table Of Contents Information Visualizations Playbook Data Pictures PDF
Presenting Table Of Contents Information Visualizations Playbook Data Pictures PDF to provide visual cues and insights. Share and navigate important information on one stages that need your due attention. This template can be used to pitch topics like Automated Data Analysis, Information Visualizations Playbook. In addtion, this PPT design contains high resolution images, graphics, etc, that are easily editable and available for immediate download.
-
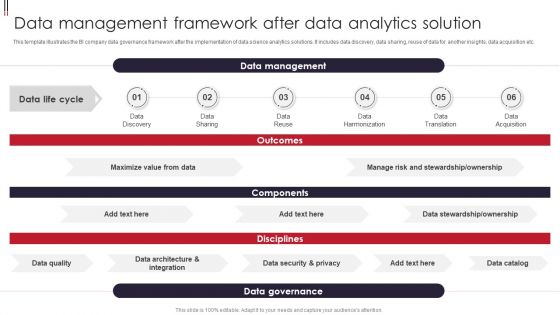
Information Visualizations Playbook Data Management Framework After Data Analytics Solution Formats PDF
Deliver an awe inspiring pitch with this creative Information Visualizations Playbook Data Management Framework After Data Analytics Solution Formats PDF bundle. Topics like Data Discovery, Data Sharing, Data Harmonization can be discussed with this completely editable template. It is available for immediate download depending on the needs and requirements of the user.
-
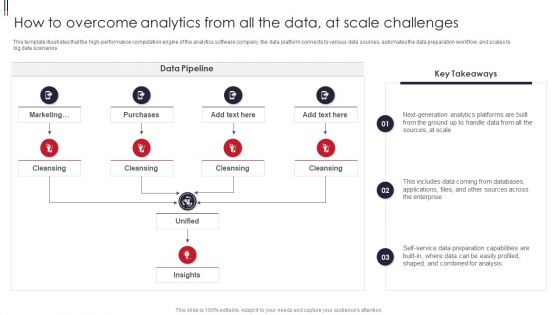
Information Visualizations Playbook How To Overcome Analytics From All The Data At Scale Challenges Mockup PDF
This template illustrates that the high performance computation engine of the analytics software company, the data platform connects to various data sources, automates the data preparation workflow, and scales to big data scenarios. Deliver an awe inspiring pitch with this creative Information Visualizations Playbook How To Overcome Analytics From All The Data At Scale Challenges Mockup PDF bundle. Topics like Purchases, Marketing, Data Pipeline can be discussed with this completely editable template. It is available for immediate download depending on the needs and requirements of the user.
-
Data Visualization And User Profiling Icon Ppt Styles Slide PDF
Presenting Data Visualization And User Profiling Icon Ppt Styles Slide PDF to dispense important information. This template comprises three stages. It also presents valuable insights into the topics including Data Visualization, User Profiling, Icon. This is a completely customizable PowerPoint theme that can be put to use immediately. So, download it and address the topic impactfully.
-
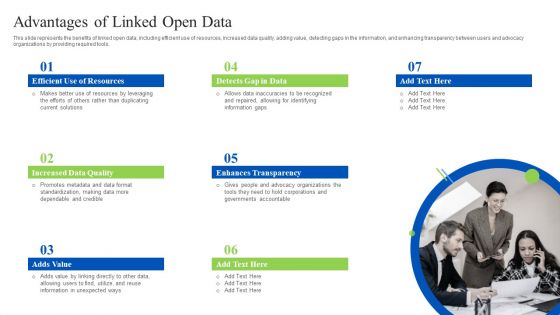
Linked Data Visualization Advantages Of Linked Open Data Rules PDF
This slide represents the benefits of linked open data, including efficient use of resources, increased data quality, adding value, detecting gaps in the information, and enhancing transparency between users and advocacy organizations by providing required tools. Find a pre-designed and impeccable Linked Data Visualization Advantages Of Linked Open Data Rules PDF. The templates can ace your presentation without additional effort. You can download these easy-to-edit presentation templates to make your presentation stand out from others. So, what are you waiting for Download the template from Slidegeeks today and give a unique touch to your presentation.
-
Linked Data Visualization Benefits Of Linked Data System Designs PDF
This slide represents the benefits of linked data, such as breaking down the information silos, interconnecting data from different sources, promoting data model expansion, connecting heterogeneous sources and formats, and enabling enterprises to place proprietary knowledge in the context of public knowledge. Boost your pitch with our creative Linked Data Visualization Benefits Of Linked Data System Designs PDF. Deliver an awe-inspiring pitch that will mesmerize everyone. Using these presentation templates you will surely catch everyones attention. You can browse the ppts collection on our website. We have researchers who are experts at creating the right content for the templates. So you dont have to invest time in any additional work. Just grab the template now and use them.
-
Linked Data Visualization Data Structure Circular Linked List Portrait PDF
This slide represents the circular linked list in the data structure, including its different categories such as singly linked list and doubly linked list. It also caters to the basic operations of the circular linked list, such as insertion, deletion, and display. Slidegeeks is one of the best resources for PowerPoint templates. You can download easily and regulate Linked Data Visualization Data Structure Circular Linked List Portrait PDF for your personal presentations from our wonderful collection. A few clicks is all it takes to discover and get the most relevant and appropriate templates. Use our Templates to add a unique zing and appeal to your presentation and meetings. All the slides are easy to edit and you can use them even for advertisement purposes.
-
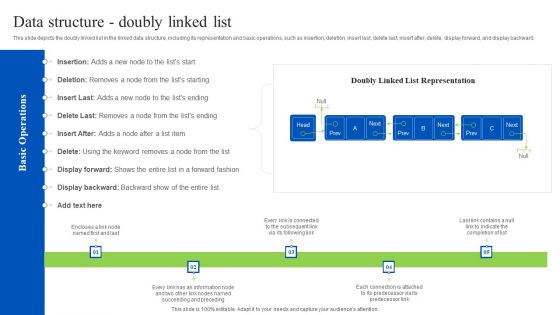
Linked Data Visualization Data Structure Doubly Linked List Inspiration PDF
This slide depicts the doubly linked list in the linked data structure, including its representation and basic operations, such as insertion, deletion, insert last, delete last, insert after, delete, display forward, and display backward. Want to ace your presentation in front of a live audience Our Linked Data Visualization Data Structure Doubly Linked List Inspiration PDF can help you do that by engaging all the users towards you. Slidegeeks experts have put their efforts and expertise into creating these impeccable powerpoint presentations so that you can communicate your ideas clearly. Moreover, all the templates are customizable, and easy-to-edit and downloadable. Use these for both personal and commercial use.
-
Linked Data Visualization Data Structure Simple Linked List Clipart PDF
This slide represents the simple linked list data structure of linked data, including its representation, and various elements such as first, next, node, data items and null. The basic operations performed on a simple linked list are insertion, deletion and reverse. There are so many reasons you need a Linked Data Visualization Data Structure Simple Linked List Clipart PDF. The first reason is you cant spend time making everything from scratch, Thus, Slidegeeks has made presentation templates for you too. You can easily download these templates from our website easily.
-
Linked Data Visualization Dataset Quality In The Linked Data Web Inspiration PDF
This slide depicts the dataset quality in the linked data web, which is necessary since open data is growing in popularity worldwide. The 5-star data is quality data as per linked data standards and it is more helpful as it is accessible throughout the web. Do you have to make sure that everyone on your team knows about any specific topic I yes, then you should give Linked Data Visualization Dataset Quality In The Linked Data Web Inspiration PDF a try. Our experts have put a lot of knowledge and effort into creating this impeccable Linked Data Visualization Dataset Quality In The Linked Data Web Inspiration PDF. You can use this template for your upcoming presentations, as the slides are perfect to represent even the tiniest detail. You can download these templates from the Slidegeeks website and these are easy to edit. So grab these today.
-
Linked Data Visualization Deletion Operation Performed On Simple Linked List Microsoft PDF
This slide shows the step-by-step process of deleting a node from the linked list, including the syntax. Users can keep the deleted node in the memory to use later or can deallocate the memory and erase it permanently. Get a simple yet stunning designed Linked Data Visualization Deletion Operation Performed On Simple Linked List Microsoft PDF. It is the best one to establish the tone in your meetings. It is an excellent way to make your presentations highly effective. So, download this PPT today from Slidegeeks and see the positive impacts. Our easy-to-edit Linked Data Visualization Deletion Operation Performed On Simple Linked List Microsoft PDF can be your go-to option for all upcoming conferences and meetings. So, what are you waiting for Grab this template today.
-
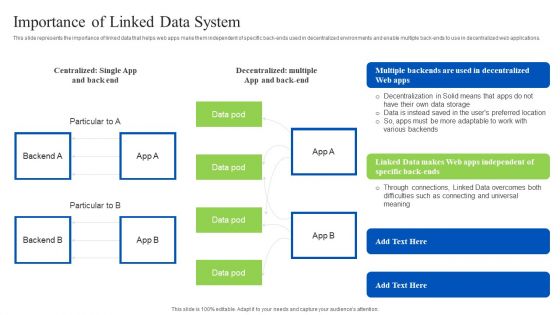
Linked Data Visualization Importance Of Linked Data System Professional PDF
This slide represents the importance of linked data that helps web apps make them independent of specific back-ends used in decentralized environments and enable multiple back-ends to use in decentralized web applications. From laying roadmaps to briefing everything in detail, our templates are perfect for you. You can set the stage with your presentation slides. All you have to do is download these easy-to-edit and customizable templates. Linked Data Visualization Importance Of Linked Data System Professional PDF will help you deliver an outstanding performance that everyone would remember and praise you for. Do download this presentation today.
-
Linked Data Visualization Importance To Publish 5 Stars Linked Data Clipart PDF
This slide describes the importance of publishing five stars-linked data, where five stars mean your data is linked with other available information throughout the internet, four stars mean detection of each object and making content easily discoverable, and so on. Present like a pro with Linked Data Visualization Importance To Publish 5 Stars Linked Data Clipart PDF Create beautiful presentations together with your team, using our easy-to-use presentation slides. Share your ideas in real-time and make changes on the fly by downloading our templates. So whether youre in the office, on the go, or in a remote location, you can stay in sync with your team and present your ideas with confidence. With Slidegeeks presentation got a whole lot easier. Grab these presentations today.
-
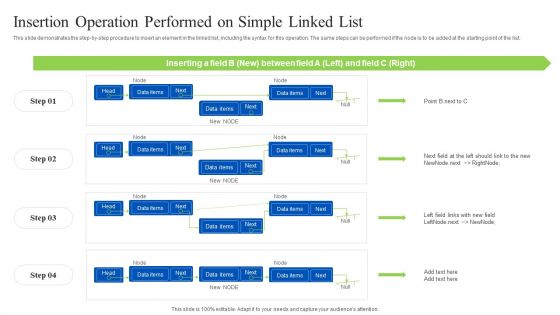
Linked Data Visualization Insertion Operation Performed On Simple Linked List Mockup PDF
This slide demonstrates the step-by-step procedure to insert an element in the linked list, including the syntax for this operation. The same steps can be performed if the node is to be added at the starting point of the list. Slidegeeks is here to make your presentations a breeze with Linked Data Visualization Insertion Operation Performed On Simple Linked List Mockup PDF With our easy-to-use and customizable templates, you can focus on delivering your ideas rather than worrying about formatting. With a variety of designs to choose from, youre sure to find one that suits your needs. And with animations and unique photos, illustrations, and fonts, you can make your presentation pop. So whether youre giving a sales pitch or presenting to the board, make sure to check out Slidegeeks first.
-
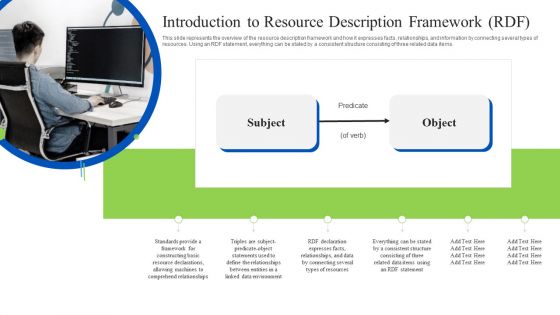
Linked Data Visualization Introduction To Resource Description Framework RDF Clipart PDF
This slide represents the overview of the resource description framework and how it expresses facts, relationships, and information by connecting several types of resources. Using an RDF statement, everything can be stated by a consistent structure consisting of three related data items. Do you have an important presentation coming up Are you looking for something that will make your presentation stand out from the rest Look no further than Linked Data Visualization Introduction To Resource Description Framework RDF Clipart PDF. With our professional designs, you can trust that your presentation will pop and make delivering it a smooth process. And with Slidegeeks, you can trust that your presentation will be unique and memorable. So why wait Grab Linked Data Visualization Introduction To Resource Description Framework RDF Clipart PDF today and make your presentation stand out from the rest.
-
Linked Data Visualization Introduction To Turtle In Linked Data Demonstration PDF
This slide represents the introduction to Turtle in linked data, which is a syntax and format for storing and expressing information. The turtle information is described in triple form with uniform resource identifiers rather than words depicting values. Whether you have daily or monthly meetings, a brilliant presentation is necessary. Linked Data Visualization Introduction To Turtle In Linked Data Demonstration PDF can be your best option for delivering a presentation. Represent everything in detail using Linked Data Visualization Introduction To Turtle In Linked Data Demonstration PDF and make yourself stand out in meetings. The template is versatile and follows a structure that will cater to your requirements. All the templates prepared by Slidegeeks are easy to download and edit. Our research experts have taken care of the corporate themes as well. So, give it a try and see the results.
-
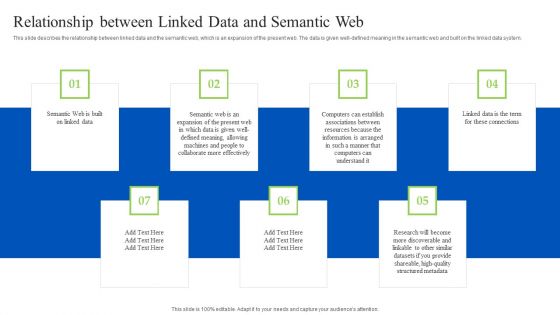
Linked Data Visualization Relationship Between Linked Data And Semantic Web Inspiration PDF
This slide describes the relationship between linked data and the semantic web, which is an expansion of the present web. The data is given well-defined meaning in the semantic web and built on the linked data system. Find highly impressive Linked Data Visualization Relationship Between Linked Data And Semantic Web Inspiration PDF on Slidegeeks to deliver a meaningful presentation. You can save an ample amount of time using these presentation templates. No need to worry to prepare everything from scratch because Slidegeeks experts have already done a huge research and work for you. You need to download Linked Data Visualization Relationship Between Linked Data And Semantic Web Inspiration PDF for your upcoming presentation. All the presentation templates are 100 percent editable and you can change the color and personalize the content accordingly. Download now.
-
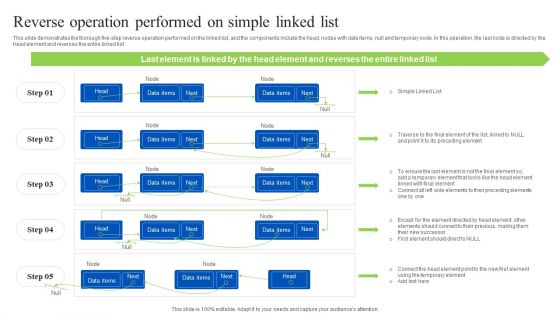
Linked Data Visualization Reverse Operation Performed On Simple Linked List Formats PDF
This slide demonstrates the thorough five-step reverse operation performed on the linked list, and the components include the head, nodes with data items, null and temporary node. In this operation, the last node is directed by the head element and reverses the entire linked list. If your project calls for a presentation, then Slidegeeks is your go-to partner because we have professionally designed, easy-to-edit templates that are perfect for any presentation. After downloading, you can easily edit Linked Data Visualization Reverse Operation Performed On Simple Linked List Formats PDF and make the changes accordingly. You can rearrange slides or fill them with different images. Check out all the handy templates.
-
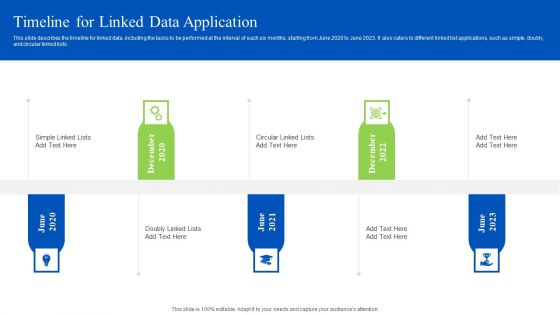
Linked Data Visualization Roadmap For Linked Data Application Clipart PDF
This slide represents the roadmap for linked data application in the organization, including the milestones to be achieved by the company starting from the financial year 2019 till 2023. It also caters to different linked list applications, such as simple, doubly, and circular linked lists. If you are looking for a format to display your unique thoughts, then the professionally designed Linked Data Visualization Roadmap For Linked Data Application Clipart PDF is the one for you. You can use it as a Google Slides template or a PowerPoint template. Incorporate impressive visuals, symbols, images, and other charts. Modify or reorganize the text boxes as you desire. Experiment with shade schemes and font pairings. Alter, share or cooperate with other people on your work. Download Linked Data Visualization Roadmap For Linked Data Application Clipart PDF and find out how to give a successful presentation. Present a perfect display to your team and make your presentation unforgettable.
-
Linked Data Visualization Role Of The Uniform Resource Identifier URI Slides PDF
This slide represents the role of a uniform resource identifier that is a character string in the linked data system, it can be linked or not linked to the internet, and a uniform resource locator is a form of a uniform resource identifier. Are you in need of a template that can accommodate all of your creative concepts This one is crafted professionally and can be altered to fit any style. Use it with Google Slides or PowerPoint. Include striking photographs, symbols, depictions, and other visuals. Fill, move around, or remove text boxes as desired. Test out color palettes and font mixtures. Edit and save your work, or work with colleagues. Download Linked Data Visualization Role Of The Uniform Resource Identifier URI Slides PDF and observe how to make your presentation outstanding. Give an impeccable presentation to your group and make your presentation unforgettable.
-
Linked Data Visualization Timeline For Linked Data Application Pictures PDF
This slide describes the timeline for linked data, including the tasks to be performed at the interval of each six months, starting from June 2020 to June 2023. It also caters to different linked list applications, such as simple, doubly, and circular linked lists. Crafting an eye-catching presentation has never been more straightforward. Let your presentation shine with this tasteful yet straightforward Linked Data Visualization Timeline For Linked Data Application Pictures PDF template. It offers a minimalistic and classy look that is great for making a statement. The colors have been employed intelligently to add a bit of playfulness while still remaining professional. Construct the ideal Linked Data Visualization Timeline For Linked Data Application Pictures PDF that effortlessly grabs the attention of your audience Begin now and be certain to wow your customers.
-
Agenda For Linked Data Visualization Ppt File Formats PDF
Crafting an eye-catching presentation has never been more straightforward. Let your presentation shine with this tasteful yet straightforward Agenda For Linked Data Visualization Ppt File Formats PDF template. It offers a minimalistic and classy look that is great for making a statement. The colors have been employed intelligently to add a bit of playfulness while still remaining professional. Construct the ideal Agenda For Linked Data Visualization Ppt File Formats PDF that effortlessly grabs the attention of your audience Begin now and be certain to wow your customers.
-
Icons Slide For Linked Data Visualization Ppt Infographics Layout PDF
Help your business to create an attention-grabbing presentation using our Icons Slide For Linked Data Visualization Ppt Infographics Layout PDF set of slides. The slide contains innovative icons that can be flexibly edited. Choose this Icons Slide For Linked Data Visualization Ppt Infographics Layout PDF template to create a satisfactory experience for your customers. Go ahead and click the download button.
-
Linked Data Visualization Key Terms Used In Linked Data Ppt Styles Sample PDF
This slide shows the key terms used in linked data systems such as linked open data, resource description framework, schema, triples, semantic web, turtle and uniform resource identifier. The linked data connect various data nodes. Formulating a presentation can take up a lot of effort and time, so the content and message should always be the primary focus. The visuals of the PowerPoint can enhance the presenters message, so our Linked Data Visualization Key Terms Used In Linked Data Ppt Styles Sample PDF was created to help save time. Instead of worrying about the design, the presenter can concentrate on the message while our designers work on creating the ideal templates for whatever situation is needed. Slidegeeks has experts for everything from amazing designs to valuable content, we have put everything into Linked Data Visualization Key Terms Used In Linked Data Ppt Styles Sample PDF.
-
Linked Data Visualization Linked Data Structure Linked List Ppt Outline Professional PDF
This slide depicts the linked list that is data structure in linked data, including its various types such as simple linked list, doubly linked list, and circular linked list. It also caters to basic operations performed on the linked list, covering insertion, deletion, display, search and delete. Coming up with a presentation necessitates that the majority of the effort goes into the content and the message you intend to convey. The visuals of a PowerPoint presentation can only be effective if it supplements and supports the story that is being told. Keeping this in mind our experts created Linked Data Visualization Linked Data Structure Linked List Ppt Outline Professional PDF to reduce the time that goes into designing the presentation. This way, you can concentrate on the message while our designers take care of providing you with the right template for the situation.
-
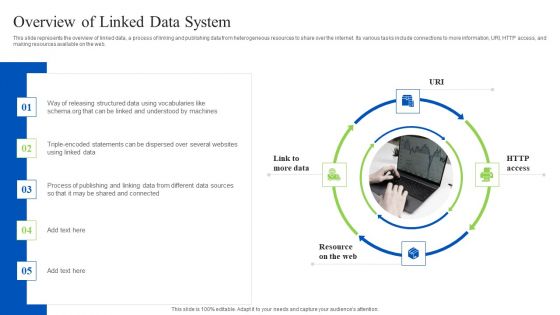
Linked Data Visualization Overview Of Linked Data System Ppt Gallery Background PDF
This slide represents the overview of linked data, a process of linking and publishing data from heterogeneous resources to share over the internet. Its various tasks include connections to more information, URI, HTTP access, and making resources available on the web. This modern and well-arranged Linked Data Visualization Overview Of Linked Data System Ppt Gallery Background PDF provides lots of creative possibilities. It is very simple to customize and edit with the Powerpoint Software. Just drag and drop your pictures into the shapes. All facets of this template can be edited with Powerpoint, no extra software is necessary. Add your own material, put your images in the places assigned for them, adjust the colors, and then you can show your slides to the world, with an animated slide included.
-
Linked Data Visualization Overview Of Linked Open Data Ppt Layouts Templates PDF
This slide shows the overview of linked open data, which is structured data in a machine-readable format. It makes it possible to query all the publicly accessible datasets at once and analyze vast amounts of data with high potential. This Linked Data Visualization Overview Of Linked Open Data Ppt Layouts Templates PDF is perfect for any presentation, be it in front of clients or colleagues. It is a versatile and stylish solution for organizing your meetings. The Linked Data Visualization Overview Of Linked Open Data Ppt Layouts Templates PDF features a modern design for your presentation meetings. The adjustable and customizable slides provide unlimited possibilities for acing up your presentation. Slidegeeks has done all the homework before launching the product for you. So, dont wait, grab the presentation templates today.
-
Linked Data Visualization Overview Of Schema In Linked Data Ppt File Sample PDF
This slide depicts the schema overview in linked data, a group of elements used to organize information in the database, and its examples such as machine-readable cataloging MARC, Metadata Object Description Schema MODS, Encoded Archival Description EAD, Resource Description Framework Schema RDFS. Welcome to our selection of the Linked Data Visualization Overview Of Schema In Linked Data Ppt File Sample PDF. These are designed to help you showcase your creativity and bring your sphere to life. Planning and Innovation are essential for any business that is just starting out. This collection contains the designs that you need for your everyday presentations. All of our PowerPoints are 100 percent editable, so you can customize them to suit your needs. This multi-purpose template can be used in various situations. Grab these presentation templates today.
-
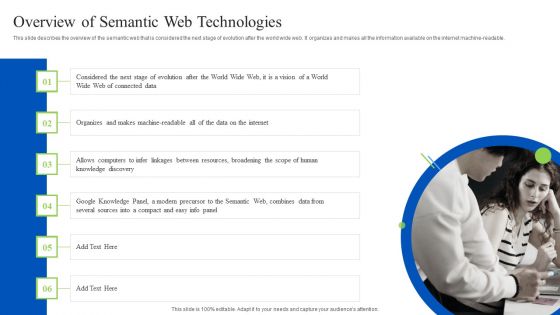
Linked Data Visualization Overview Of Semantic Web Technologies Ppt Summary Skills PDF
This slide describes the overview of the semantic web that is considered the next stage of evolution after the world wide web. It organizes and makes all the information available on the internet machine-readable. Explore a selection of the finest Linked Data Visualization Overview Of Semantic Web Technologies Ppt Summary Skills PDF here. With a plethora of professionally designed and pre-made slide templates, you can quickly and easily find the right one for your upcoming presentation. You can use our Linked Data Visualization Overview Of Semantic Web Technologies Ppt Summary Skills PDF to effectively convey your message to a wider audience. Slidegeeks has done a lot of research before preparing these presentation templates. The content can be personalized and the slides are highly editable. Grab templates today from Slidegeeks.


