Dashboard illustrating PowerPoint Presentation Templates and Google Slides
-
Balanced Scorecard Dashboard Illustration Ppt Slides
This is a balanced scorecard dashboard illustration ppt slides. This is a five stage process. The stages in this process are business benefits, financials, schedule, technology, customer.
-
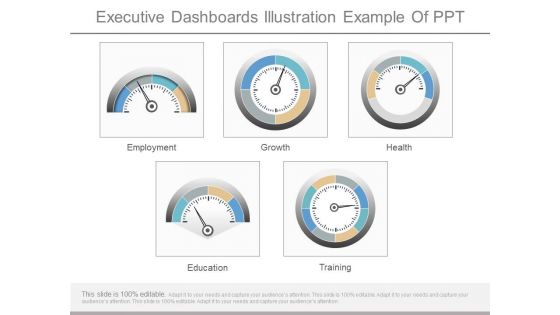
Executive Dashboards Illustration Example Of Ppt
This is a executive dashboards illustration example of ppt. This is a five stage process. The stages in this process are employment, growth, health, education, training.
-
Vector Illustration Of Capacity Utilization Dashboard Vector Icon Ppt PowerPoint Presentation File Mockup PDF
Showcasing this set of slides titled vector illustration of capacity utilization dashboard vector icon ppt powerpoint presentation file mockup pdf. The topics addressed in these templates are vector illustration of capacity utilization dashboard vector icon. All the content presented in this PPT design is completely editable. Download it and make adjustments in color, background, font etc. as per your unique business setting.
-
Vector Illustration Of QA Status Dashboard Vector Icon Ppt PowerPoint Presentation Gallery Backgrounds PDF
Showcasing this set of slides titled vector illustration of qa status dashboard vector icon ppt powerpoint presentation gallery backgrounds pdf. The topics addressed in these templates are vector illustration of qa status dashboard vector icon. All the content presented in this PPT design is completely editable. Download it and make adjustments in color, background, font etc. as per your unique business setting.
-
Illustrating Product Leadership Plan Incorporating Innovative Techniques Dashboard Depicting Sales Icons PDF
This slide focuses on dashboard that depicts sales product performance that includes top products in revenues, online verses offline purchases, incremental sales by campaign and cost of goods sold. Deliver an awe inspiring pitch with this creative illustrating product leadership plan incorporating innovative techniques dashboard depicting sales icons pdf bundle. Topics like incremental sales by campaign, top products in revenue, online vs offline purchases, cost of goods sold can be discussed with this completely editable template. It is available for immediate download depending on the needs and requirements of the user.
-
Email Marketing Dashboard Illustrating Campaign Performance Results Ppt PowerPoint Presentation File Icon PDF
Mentioned slide displays email campaign dashboard which can be used by marketers to track performance of their marketing campaigns. Marketers can track metrics such as total subscribers growth, overall bounce rate, unsubscribe rate, open rate, click rate etc. Showcasing this set of slides titled email marketing dashboard illustrating campaign performance results ppt powerpoint presentation file icon pdf. The topics addressed in these templates are marketing, list health, total subscribers, percentage. All the content presented in this PPT design is completely editable. Download it and make adjustments in color, background, font etc. as per your unique business setting.
-
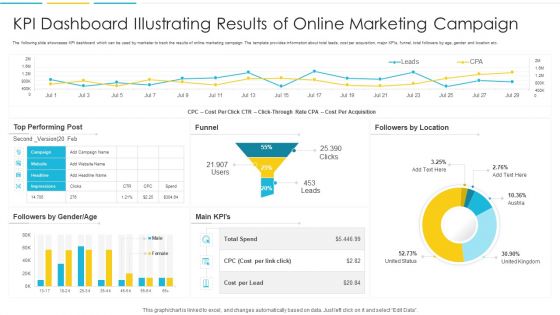
KPI Dashboard Illustrating Results Of Online Marketing Campaign Slides PDF
The following slide showcases KPI dashboard which can be used by marketer to track the results of online marketing campaign. The template provides information about total leads, cost per acquisition, major KPIs, funnel, total followers by age, gender and location etc. Showcasing this set of slides titled KPI Dashboard Illustrating Results Of Online Marketing Campaign Slides PDF. The topics addressed in these templates are Cost, Location, Performing. All the content presented in this PPT design is completely editable. Download it and make adjustments in color, background, font etc. as per your unique business setting
-
Finance Metrics Dashboard Illustrating Account Payables Icons PDF
This graph or chart is linked to excel, and changes automatically based on data. Just left click on it and select edit data. Pitch your topic with ease and precision using this Total Income Budget, Total Expenses Balance, Net Profit Quick, Ratio Current Ratio. This layout presents information on Account Payable Age, Average Creditor Days, Cash On Hand. It is also available for immediate download and adjustment. So, changes can be made in the color, design, graphics or any other component to create a unique layout.
-
Finance Metrics Dashboard Illustrating Gross And Operating Profit Margin Icons PDF
This graph or chart is linked to excel, and changes automatically based on data. Just left click on it and select edit data. Showcasing this set of slides titled Finance Metrics Dashboard Illustrating Gross And Operating Profit Margin Icons PDF. The topics addressed in these templates are Gross Profit Margin, Operating Profit Margin, Net Profit Margin. All the content presented in this PPT design is completely editable. Download it and make adjustments in color, background, font etc. as per your unique business setting.
-
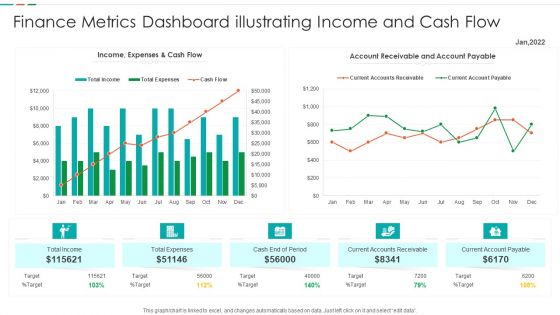
Finance Metrics Dashboard Illustrating Income And Cash Flow Template PDF
This graph or chart is linked to excel, and changes automatically based on data. Just left click on it and select edit data. Pitch your topic with ease and precision using this Finance Metrics Dashboard Illustrating Income And Cash Flow Template PDF. This layout presents information on Current Accounts Receivable, Current Account Payable, Cash End Period, Account Receivable Account. It is also available for immediate download and adjustment. So, changes can be made in the color, design, graphics or any other component to create a unique layout.
-
Finance Metrics Dashboard Illustrating Monthly Gross Profit Formats PDF
This graph or chart is linked to excel, and changes automatically based on data. Just left click on it and select edit data. Showcasing this set of slides titled Finance Metrics Dashboard Illustrating Monthly Gross Profit Formats PDF. The topics addressed in these templates are Profit Metrics Gross, Profit Target Cum, Actual Cum Target. All the content presented in this PPT design is completely editable. Download it and make adjustments in color, background, font etc. as per your unique business setting.
-
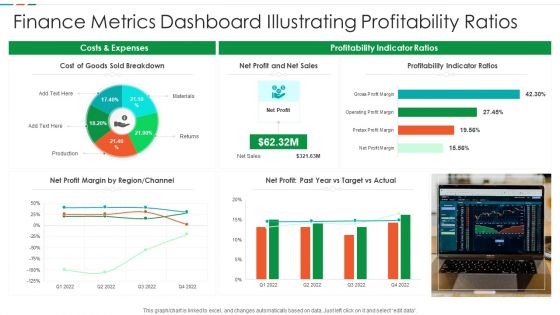
Finance Metrics Dashboard Illustrating Profitability Ratios Diagrams PDF
This graph or chart is linked to excel, and changes automatically based on data. Just left click on it and select edit data. Pitch your topic with ease and precision using this Finance Metrics Dashboard Illustrating Profitability Ratios Diagrams PDF. This layout presents information on Cost Goods Sold, Net Profit Net, Sales Profitability Indicator. It is also available for immediate download and adjustment. So, changes can be made in the color, design, graphics or any other component to create a unique layout.
-
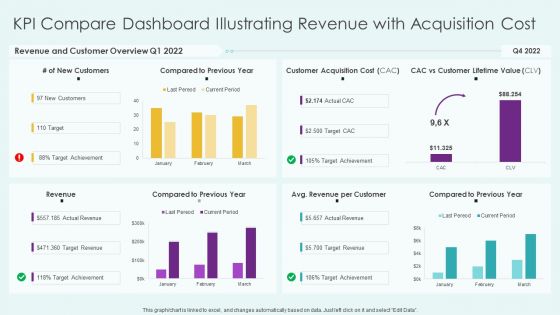
KPI Compare Dashboard Illustrating Revenue With Acquisition Cost Professional PDF
Showcasing this set of slides titled KPI Compare Dashboard Illustrating Revenue With Acquisition Cost Professional PDF The topics addressed in these templates are KPI Compare Dashboard Illustrating Revenue With Acquisition Cost All the content presented in this PPT design is completely editable. Download it and make adjustments in color, background, font etc. as per your unique business setting.
-
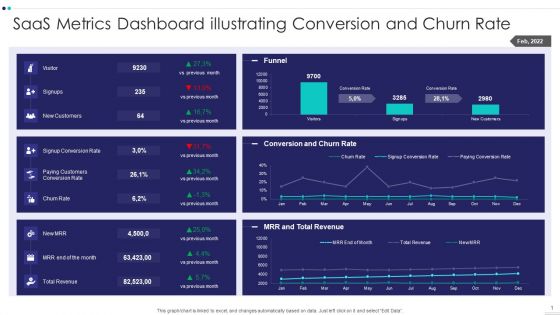
Saas Metrics Dashboard Illustrating Conversion And Churn Rate Slides PDF
Pitch your topic with ease and precision using this Saas Metrics Dashboard Illustrating Conversion And Churn Rate Slides PDF This layout presents information on Saas Metrics Dashboard Illustrating Conversion And Churn Rate It is also available for immediate download and adjustment. So, changes can be made in the color, design, graphics or any other component to create a unique layout.
-
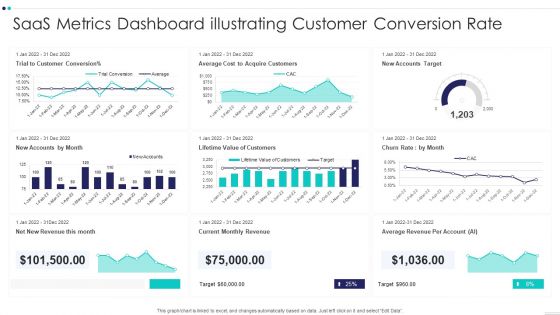
Saas Metrics Dashboard Illustrating Customer Conversion Rate Brochure PDF
Showcasing this set of slides titled Saas Metrics Dashboard Illustrating Customer Conversion Rate Brochure PDF The topics addressed in these templates are Saas Metrics Dashboard Illustrating Customer Conversion Rate All the content presented in this PPT design is completely editable. Download it and make adjustments in color, background, font etc. as per your unique business setting.
-
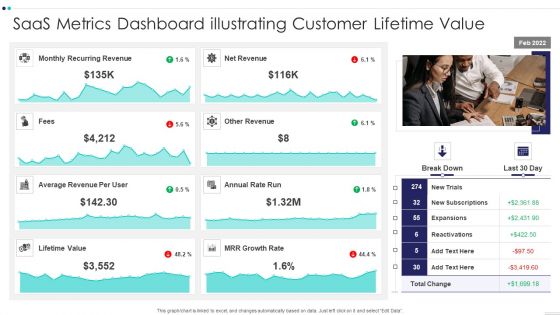
Saas Metrics Dashboard Illustrating Customer Lifetime Value Slides PDF
Pitch your topic with ease and precision using this Saas Metrics Dashboard Illustrating Customer Lifetime Value Slides PDF This layout presents information on Saas Metrics Dashboard Illustrating Customer Lifetime Value It is also available for immediate download and adjustment. So, changes can be made in the color, design, graphics or any other component to create a unique layout.
-
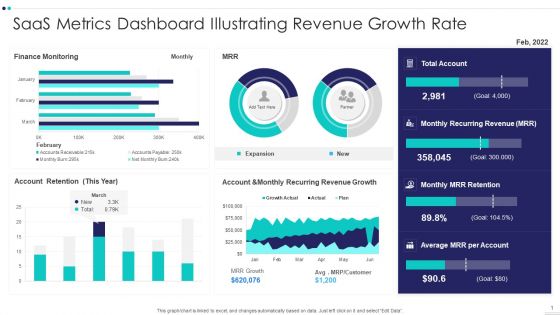
Saas Metrics Dashboard Illustrating Revenue Growth Rate Demonstration PDF
Showcasing this set of slides titled Saas Metrics Dashboard Illustrating Revenue Growth Rate Demonstration PDF The topics addressed in these templates are Saas Metrics Dashboard Illustrating Revenue Growth Rate All the content presented in this PPT design is completely editable. Download it and make adjustments in color, background, font etc. as per your unique business setting.
-
Helpdesk SLA KPL Dashboard Illustrating Calls Details Ppt Slides Show PDF
This graph or chart is linked to excel, and changes automatically based on data. Just left click on it and select Edit Data. Showcasing this set of slides titled Helpdesk SLA KPL Dashboard Illustrating Calls Details Ppt Slides Show PDF. The topics addressed in these templates are Call Type Today, Trunk Utilization Today, Call Summery Today. All the content presented in this PPT design is completely editable. Download it and make adjustments in color, background, font etc. as per your unique business setting.
-
SLA KPL Dashboard Illustrating Remove Devices And Server Status Ppt Inspiration Layout Ideas PDF
This graph or chart is linked to excel, and changes automatically based on data. Just left click on it and select Edit Data. Showcasing this set of slides titled SLA KPL Dashboard Illustrating Remove Devices And Server Status Ppt Inspiration Layout Ideas PDF. The topics addressed in these templates are Alerts Per Customer, Ticket Activity, Server Status. All the content presented in this PPT design is completely editable. Download it and make adjustments in color, background, font etc. as per your unique business setting.
-
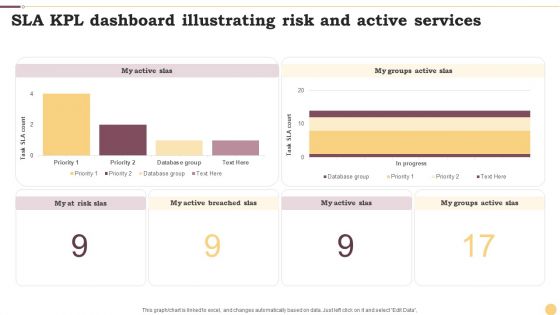
SLA KPL Dashboard Illustrating Risk And Active Services Ppt Portfolio Design Inspiration PDF
This graph or chart is linked to excel, and changes automatically based on data. Just left click on it and select Edit Data. Pitch your topic with ease and precision using this SLA KPL Dashboard Illustrating Risk And Active Services Ppt Portfolio Design Inspiration PDF. This layout presents information on My Active SLAs, Database Group, Priority. It is also available for immediate download and adjustment. So, changes can be made in the color, design, graphics or any other component to create a unique layout.
-
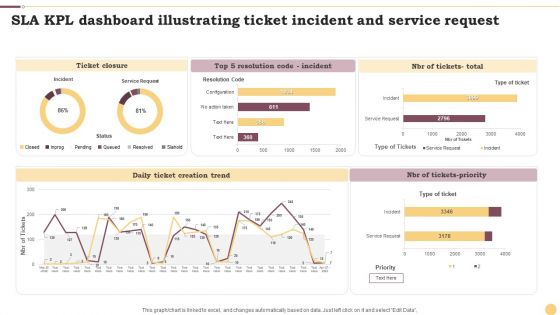
SLA KPL Dashboard Illustrating Ticket Incident And Service Request Ppt File Portrait PDF
This graph or chart is linked to excel, and changes automatically based on data. Just left click on it and select Edit Data. Showcasing this set of slides titled SLA KPL Dashboard Illustrating Ticket Incident And Service Request Ppt File Portrait PDF. The topics addressed in these templates are Ticket Closure, Daily Ticket, Creation Trend, NBR Tickets Priority. All the content presented in this PPT design is completely editable. Download it and make adjustments in color, background, font etc. as per your unique business setting.
-
Share Market Dashboard Illustrating 6 Months Price Trend Ideas PDF
Following slide exhibits stock market dashboard which will assist company to track price of a stock for last 6 months. The various metrics mentioned in the slide are current stock price, last one year stock summary etc. Showcasing this set of slides titled Share Market Dashboard Illustrating 6 Months Price Trend Ideas PDF. The topics addressed in these templates are Share Market, Dashboard Illustrating, Months Price Trend. All the content presented in this PPT design is completely editable. Download it and make adjustments in color, background, font etc. as per your unique business setting.
-
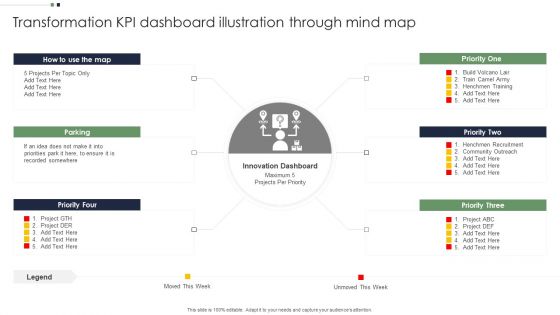
Transformation KPI Dashboard Illustration Through Mind Map Elements PDF
Persuade your audience using this Transformation KPI Dashboard Illustration Through Mind Map Elements PDF. This PPT design covers six stages, thus making it a great tool to use. It also caters to a variety of topics including Transformation KPI Dashboard, Illustration Through Mind Map. Download this PPT design now to present a convincing pitch that not only emphasizes the topic but also showcases your presentation skills.
-
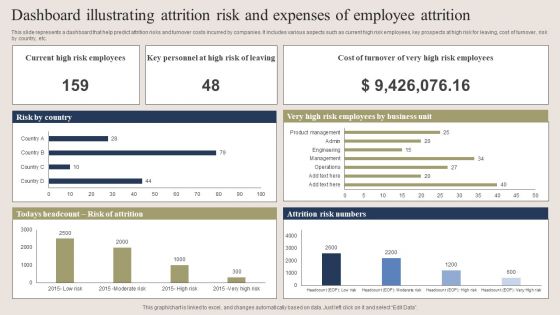
Dashboard Illustrating Attrition Risk And Expenses Of Employee Attrition Clipart PDF
This slide represents a dashboard that help predict attrition risks and turnover costs incurred by companies. It includes various aspects such as current high risk employees, key prospects at high risk for leaving, cost of turnover, risk by country, etc. Pitch your topic with ease and precision using this Dashboard Illustrating Attrition Risk And Expenses Of Employee Attrition Clipart PDF. This layout presents information on Dashboard Illustrating Attrition Risk, Expenses Of Employee Attrition . It is also available for immediate download and adjustment. So, changes can be made in the color, design, graphics or any other component to create a unique layout.
-
Dashboard Illustrating Business Service User Demographics Introduction PDF
The slide showcases dashboard which provides insights on service user demographics which enable to identify target audience. It covers gender ratios, age ratios, geographic location , income and education ratios. Showcasing this set of slides titled Dashboard Illustrating Business Service User Demographics Introduction PDF. The topics addressed in these templates are Location, Income, Age, Education. All the content presented in this PPT design is completely editable. Download it and make adjustments in color, background, font etc. as per your unique business setting.
-
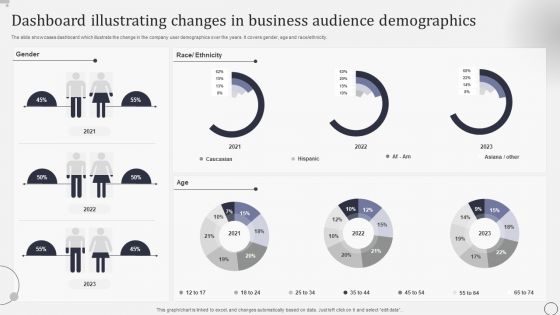
Dashboard Illustrating Changes In Business Audience Demographics Sample PDF
The slide showcases dashboard which illustrate the change in the company user demographics over the years. It covers gender, age and race ethnicity.Showcasing this set of slides titled Dashboard Illustrating Changes In Business Audience Demographics Sample PDF. The topics addressed in these templates are Gender, Age, Race Ethnicity. All the content presented in this PPT design is completely editable. Download it and make adjustments in color, background, font etc. as per your unique business setting.
-
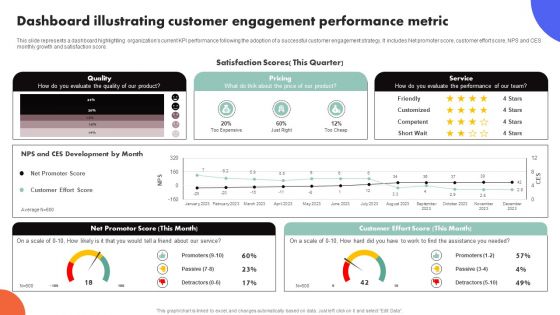
Improving Buyer Journey Through Strategic Customer Engagement Dashboard Illustrating Customer Engagement Background PDF
This slide represents a dashboard highlighting organizations current KPI performance following the adoption of a successful customer engagement strategy. It includes Net promoter score, customer effort score, NPS and CES monthly growth and satisfaction score. Are you in need of a template that can accommodate all of your creative concepts This one is crafted professionally and can be altered to fit any style. Use it with Google Slides or PowerPoint. Include striking photographs, symbols, depictions, and other visuals. Fill, move around, or remove text boxes as desired. Test out color palettes and font mixtures. Edit and save your work, or work with colleagues. Download Improving Buyer Journey Through Strategic Customer Engagement Dashboard Illustrating Customer Engagement Background PDF and observe how to make your presentation outstanding. Give an impeccable presentation to your group and make your presentation unforgettable.


