Dashboard depicting PowerPoint Presentation Templates and Google Slides
-
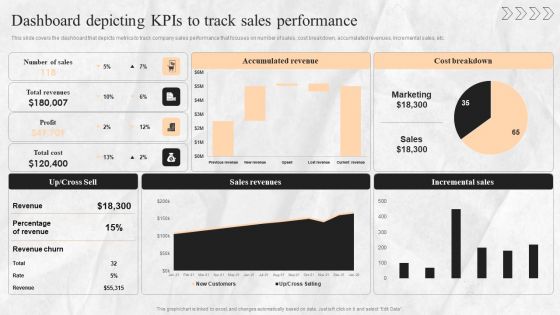
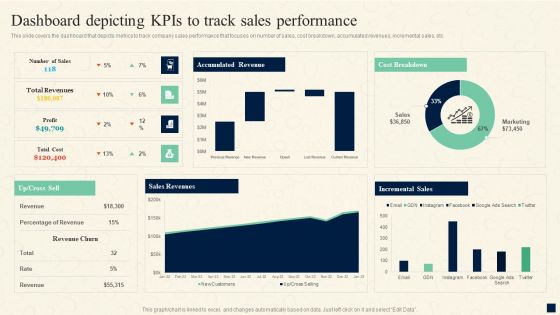
Digital Transition Plan For Managing Business Dashboard Depicting Kpis To Track Sales Performance Guidelines PDF
This slide covers the dashboard that depicts metrics to track company sales performance that focuses on number of sales, cost breakdown, accumulated revenues, incremental sales, etc. Are you in need of a template that can accommodate all of your creative concepts This one is crafted professionally and can be altered to fit any style. Use it with Google Slides or PowerPoint. Include striking photographs, symbols, depictions, and other visuals. Fill, move around, or remove text boxes as desired. Test out color palettes and font mixtures. Edit and save your work, or work with colleagues. Download Digital Transition Plan For Managing Business Dashboard Depicting Kpis To Track Sales Performance Guidelines PDF and observe how to make your presentation outstanding. Give an impeccable presentation to your group and make your presentation unforgettable.
-
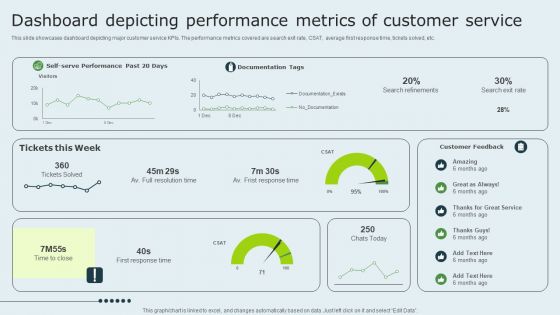
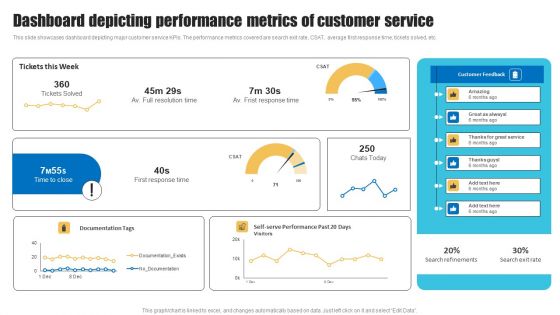
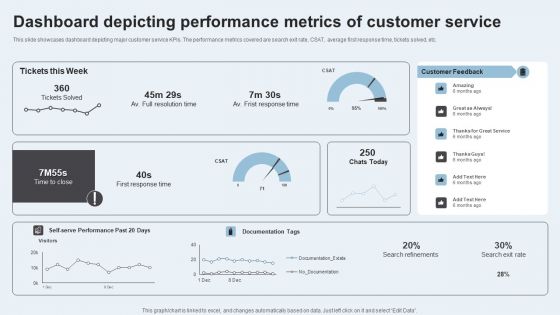
Enhancing Client Experience Dashboard Depicting Performance Metrics Of Customer Service Structure PDF
This slide showcases dashboard depicting major customer service KPIs. The performance metrics covered are search exit rate, CSAT, average first response time, tickets solved, etc. There are so many reasons you need a Enhancing Client Experience Dashboard Depicting Performance Metrics Of Customer Service Structure PDF. The first reason is you cant spend time making everything from scratch, Thus, Slidegeeks has made presentation templates for you too. You can easily download these templates from our website easily.
-
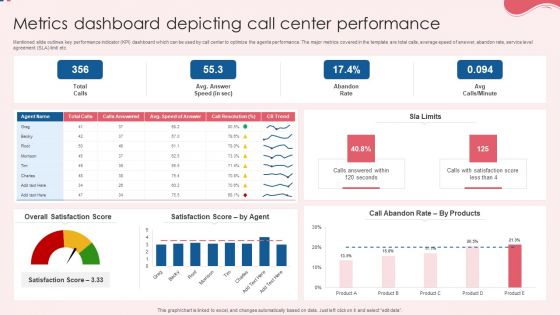
Metrics Dashboard Depicting Call Center Performance Pictures PDF
Mentioned slide outlines key performance indicator KPI dashboard which can be used by call center to optimize the agents performance. The major metrics covered in the template are total calls, average speed of answer, abandon rate, service level agreement SLA limit etc. Pitch your topic with ease and precision using this Metrics Dashboard Depicting Call Center Performance Pictures PDF. This layout presents information on Overall Satisfaction Score, Satisfaction Score, Performance. It is also available for immediate download and adjustment. So, changes can be made in the color, design, graphics or any other component to create a unique layout.
-
Customer Service Plan To Improve Sales Dashboard Depicting Customer Service Insights Inspiration PDF
This slide shows the dashboard that depicts customer service insights which includes number of solved tickets, average resolution and response time, customer feedback, total visitors and chats. If you are looking for a format to display your unique thoughts, then the professionally designed Customer Service Plan To Improve Sales Dashboard Depicting Customer Service Insights Inspiration PDF is the one for you. You can use it as a Google Slides template or a PowerPoint template. Incorporate impressive visuals, symbols, images, and other charts. Modify or reorganize the text boxes as you desire. Experiment with shade schemes and font pairings. Alter, share or cooperate with other people on your work. Download Customer Service Plan To Improve Sales Dashboard Depicting Customer Service Insights Inspiration PDF and find out how to give a successful presentation. Present a perfect display to your team and make your presentation unforgettable.
-
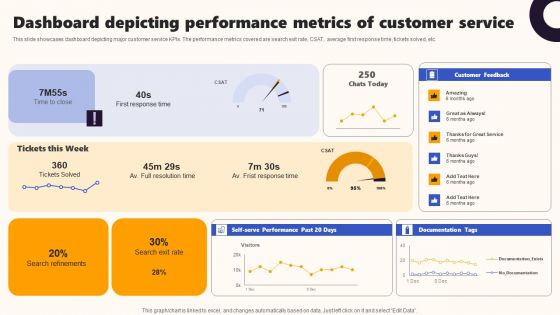
Techniques To Optimize UX Dashboard Depicting Performance Metrics Of Customer Clipart PDF
This slide showcases dashboard depicting major customer service KPIs. The performance metrics covered are search exit rate, CSAT, average first response time, tickets solved, etc. Formulating a presentation can take up a lot of effort and time, so the content and message should always be the primary focus. The visuals of the PowerPoint can enhance the presenters message, so our Techniques To Optimize UX Dashboard Depicting Performance Metrics Of Customer Clipart PDF was created to help save time. Instead of worrying about the design, the presenter can concentrate on the message while our designers work on creating the ideal templates for whatever situation is needed. Slidegeeks has experts for everything from amazing designs to valuable content, we have put everything into Techniques To Optimize UX Dashboard Depicting Performance Metrics Of Customer Clipart PDF.
-
Change Management Process Dashboard Depicting Kpis To Track Sales Performance Introduction PDF
This slide covers the dashboard that depicts metrics to track company sales performance that focuses on number of sales, cost breakdown, accumulated revenues, incremental sales, etc. From laying roadmaps to briefing everything in detail, our templates are perfect for you. You can set the stage with your presentation slides. All you have to do is download these easy-to-edit and customizable templates. Change Management Process Dashboard Depicting Kpis To Track Sales Performance Introduction PDF will help you deliver an outstanding performance that everyone would remember and praise you for. Do download this presentation today.
-
Enhancing Client Engagement Dashboard Depicting Customer Service Insights Structure PDF
This slide shows the dashboard that depicts customer service insights which includes number of solved tickets, average resolution and response time, customer feedback, total visitors and chats. There are so many reasons you need a Enhancing Client Engagement Dashboard Depicting Customer Service Insights Structure PDF. The first reason is you cant spend time making everything from scratch, Thus, Slidegeeks has made presentation templates for you too. You can easily download these templates from our website easily.
-
Dashboard Depicting Performance Metrics Of Customer Service Template PDF
This slide showcases dashboard depicting major customer service KPIs. The performance metrics covered are search exit rate, CSAT, average first response time, tickets solved, etc. Take your projects to the next level with our ultimate collection of Dashboard Depicting Performance Metrics Of Customer Service Template PDF. Slidegeeks has designed a range of layouts that are perfect for representing task or activity duration, keeping track of all your deadlines at a glance. Tailor these designs to your exact needs and give them a truly corporate look with your own brand colors they will make your projects stand out from the rest.
-
Implementing Change Management Strategy To Transform Business Processes Dashboard Depicting Kpis To Track Icons PDF
This slide covers the dashboard that depicts metrics to track company sales performance that focuses on number of sales, cost breakdown, accumulated revenues, incremental sales, etc. Boost your pitch with our creative Implementing Change Management Strategy To Transform Business Processes Dashboard Depicting Kpis To Track Icons PDF. Deliver an awe-inspiring pitch that will mesmerize everyone. Using these presentation templates you will surely catch everyones attention. You can browse the ppts collection on our website. We have researchers who are experts at creating the right content for the templates. So you do not have to invest time in any additional work. Just grab the template now and use them.
-
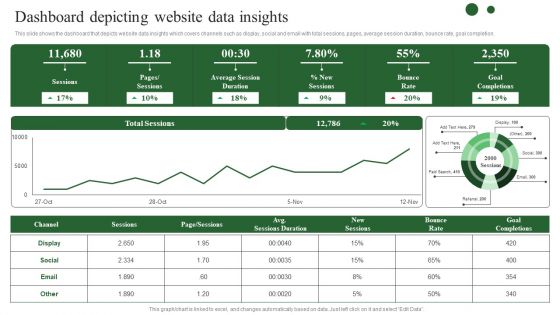
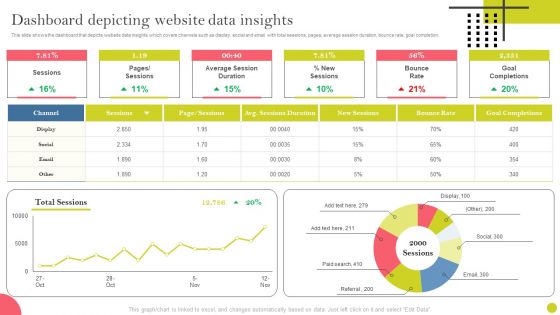
Brand Development Techniques To Increase Revenues Dashboard Depicting Website Data Diagrams PDF
This slide shows the dashboard that depicts website data insights which covers channels such as display, social and email with total sessions, pages, average session duration, bounce rate, goal completion. Are you in need of a template that can accommodate all of your creative concepts This one is crafted professionally and can be altered to fit any style. Use it with Google Slides or PowerPoint. Include striking photographs, symbols, depictions, and other visuals. Fill, move around, or remove text boxes as desired. Test out color palettes and font mixtures. Edit and save your work, or work with colleagues. Download Brand Development Techniques To Increase Revenues Dashboard Depicting Website Data Diagrams PDF and observe how to make your presentation outstanding. Give an impeccable presentation to your group and make your presentation unforgettable.
-
Action Plan To Enhance Client Service Dashboard Depicting Performance Metrics Sample PDF
This slide showcases dashboard depicting major customer service KPIs. The performance metrics covered are search exit rate, CSAT, average first response time, tickets solved, etc. Retrieve professionally designed Action Plan To Enhance Client Service Dashboard Depicting Performance Metrics Sample PDF to effectively convey your message and captivate your listeners. Save time by selecting pre made slideshows that are appropriate for various topics, from business to educational purposes. These themes come in many different styles, from creative to corporate, and all of them are easily adjustable and can be edited quickly. Access them as PowerPoint templates or as Google Slides themes. You do not have to go on a hunt for the perfect presentation because Slidegeeks got you covered from everywhere.
-
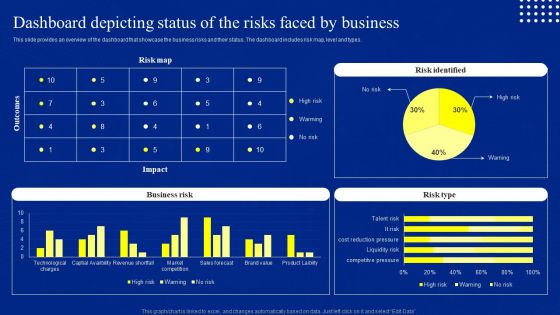
Risk Control And Surveillance Dashboard Depicting Status Of The Risks Faced By Business Elements PDF
This slide provides an overview of the dashboard that showcase the business risks and their status. The dashboard includes risk map, level and types. The best PPT templates are a great way to save time, energy, and resources. Slidegeeks have 100 percent editable powerpoint slides making them incredibly versatile. With these quality presentation templates, you can create a captivating and memorable presentation by combining visually appealing slides and effectively communicating your message. Download Risk Control And Surveillance Dashboard Depicting Status Of The Risks Faced By Business Elements PDF from Slidegeeks and deliver a wonderful presentation.
-
Dashboard To Depict Strategic B2B Communication Rollout Plan Success Portrait PDF
This slide consists of a dashboard that can be used to depict the success of a B2B communication rollout. Key performing indicators included in the slide are products sold, total revenue, client satisfaction, net profit, etc. Showcasing this set of slides titled Dashboard To Depict Strategic B2B Communication Rollout Plan Success Portrait PDF. The topics addressed in these templates are Product Sold, Total Revenue, B2b Client Satisfication. All the content presented in this PPT design is completely editable. Download it and make adjustments in color, background, font etc. as per your unique business setting.
-
Identifying And Increasing Brand Awareness Dashboard Depicting Website Data Insights Rules PDF
This slide shows the dashboard that depicts website data insights which covers channels such as display, social and email with total sessions, pages, average session duration, bounce rate, goal completion. There are so many reasons you need a Identifying And Increasing Brand Awareness Dashboard Depicting Website Data Insights Rules PDF. The first reason is you can not spend time making everything from scratch, Thus, Slidegeeks has made presentation templates for you too. You can easily download these templates from our website easily.
-
Tactical Communication Plan Dashboard Depicting Customer Service Insights Graphics PDF
This slide shows the dashboard that depicts customer service insights which includes number of solved tickets, average resolution and response time, customer feedback, total visitors and chats. Coming up with a presentation necessitates that the majority of the effort goes into the content and the message you intend to convey. The visuals of a PowerPoint presentation can only be effective if it supplements and supports the story that is being told. Keeping this in mind our experts created Tactical Communication Plan Dashboard Depicting Customer Service Insights Graphics PDF to reduce the time that goes into designing the presentation. This way, you can concentrate on the message while our designers take care of providing you with the right template for the situation.
-
Project Management Dashboard Depicting Resource Planning Management Diagrams PDF
This slide focuses on the project management dashboard which shows resourcing plan that also includes tasks of project such as planning, analysis, recruiting, monitoring and implementing with team members with their availability and absence, etc. Pitch your topic with ease and precision using this Project Management Dashboard Depicting Resource Planning Management Diagrams PDF. This layout presents information on Project Manager, Team Manager, Implementing It is also available for immediate download and adjustment. So, changes can be made in the color, design, graphics or any other component to create a unique layout.
-
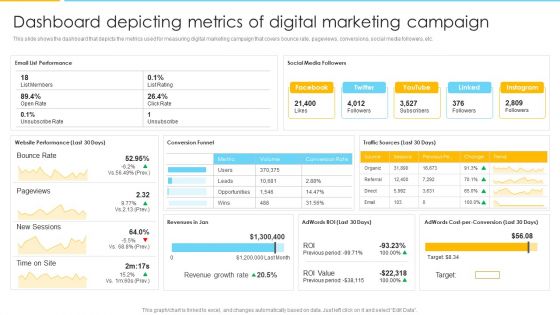
Optimizing Ecommerce Marketing Plan To Improve Sales Dashboard Depicting Metrics Of Digital Marketing Campaign Information PDF
This slide shows the dashboard that depicts the metrics used for measuring digital marketing campaign that covers bounce rate, pageviews, conversions, social media followers, etc. Deliver and pitch your topic in the best possible manner with this Optimizing Ecommerce Marketing Plan To Improve Sales Dashboard Depicting Metrics Of Digital Marketing Campaign Information PDF. Use them to share invaluable insights on Traffic Sources, Conversion Rate, Revenue Growth Rate and impress your audience. This template can be altered and modified as per your expectations. So, grab it now.
-
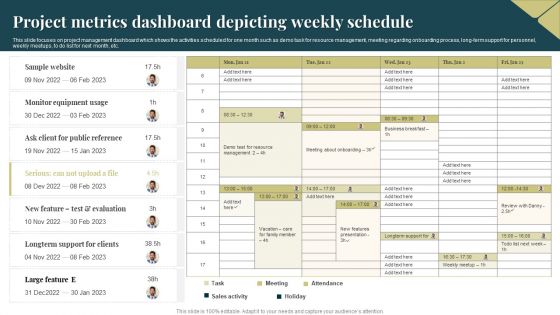
Project Metrics Dashboard Depicting Weekly Schedule Graphics PDF
This slide focuses on project management dashboard which shows the activities scheduled for one month such as demo task for resource management, meeting regarding onboarding process, long term support for personnel, weekly meetups, to do list for next month, etc. Showcasing this set of slides titled Project Metrics Dashboard Depicting Weekly Schedule Graphics PDF. The topics addressed in these templates are Equipment, Sales Activity, Resource. All the content presented in this PPT design is completely editable. Download it and make adjustments in color, background, font etc. as per your unique business setting.
-
Multiple Point Of Sale System Dashboard Depicting Restaurants Daily Performance Mockup PDF
This Slide represents point of sale system dashboard depicting restaurants daily performance which can be beneficial for eateries to manage their regular sales. It includes information about sales, expenditure, menu, customer data, bookings and reports. Persuade your audience using this Multiple Point Of Sale System Dashboard Depicting Restaurants Daily Performance Mockup PDF. This PPT design covers four stages, thus making it a great tool to use. It also caters to a variety of topics including Expenditure, Sales, Customer Data. Download this PPT design now to present a convincing pitch that not only emphasizes the topic but also showcases your presentation skills.
-
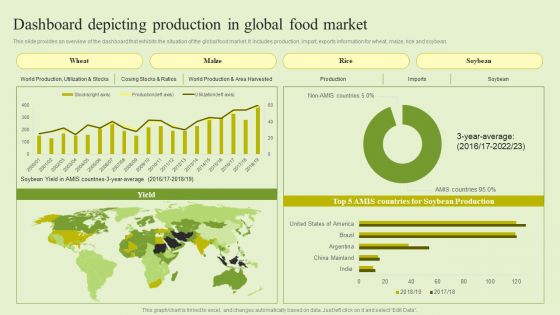
Agriculture Marketing Strategy To Improve Revenue Performance Dashboard Depicting Production Global Food Market Brochure PDF
This slide provides an overview of the dashboard that exhibits the situation of the global food market. It includes production, import, exports information for wheat, maize, rice and soybean. If you are looking for a format to display your unique thoughts, then the professionally designed Agriculture Marketing Strategy To Improve Revenue Performance Dashboard Depicting Production Global Food Market Brochure PDF is the one for you. You can use it as a Google Slides template or a PowerPoint template. Incorporate impressive visuals, symbols, images, and other charts. Modify or reorganize the text boxes as you desire. Experiment with shade schemes and font pairings. Alter, share or cooperate with other people on your work. Download Agriculture Marketing Strategy To Improve Revenue Performance Dashboard Depicting Production Global Food Market Brochure PDF and find out how to give a successful presentation. Present a perfect display to your team and make your presentation unforgettable.
-
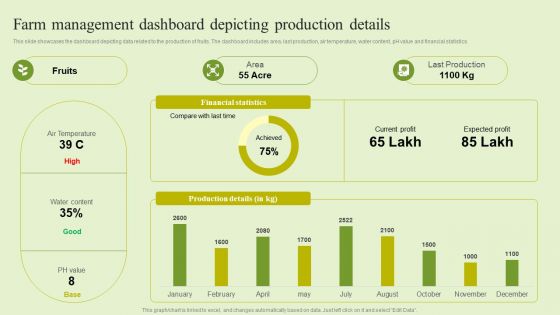
Agriculture Marketing Strategy To Improve Revenue Performance Farm Management Dashboard Depicting Production Themes PDF
This slide showcases the dashboard depicting data related to the production of fruits. The dashboard includes area, last production, air temperature, water content, pH value and financial statistics. Coming up with a presentation necessitates that the majority of the effort goes into the content and the message you intend to convey. The visuals of a PowerPoint presentation can only be effective if it supplements and supports the story that is being told. Keeping this in mind our experts created Agriculture Marketing Strategy To Improve Revenue Performance Farm Management Dashboard Depicting Production Themes PDF to reduce the time that goes into designing the presentation. This way, you can concentrate on the message while our designers take care of providing you with the right template for the situation.
-
Dashboard Depicting Kpis To Track Sales Performance Ppt Slides Picture PDF
This slide covers the dashboard that depicts metrics to track company sales performance that focuses on number of sales, cost breakdown, accumulated revenues, incremental sales, etc. Here you can discover an assortment of the finest PowerPoint and Google Slides templates. With these templates, you can create presentations for a variety of purposes while simultaneously providing your audience with an eye catching visual experience. Download Dashboard Depicting Kpis To Track Sales Performance Ppt Slides Picture PDF to deliver an impeccable presentation. These templates will make your job of preparing presentations much quicker, yet still, maintain a high level of quality. Slidegeeks has experienced researchers who prepare these templates and write high quality content for you. Later on, you can personalize the content by editing the Dashboard Depicting Kpis To Track Sales Performance Ppt Slides Picture PDF.
-
Dashboard Depicting Production In Global Agricultural Product Promotion Template Pdf
This slide provides an overview of the dashboard that exhibits the situation of the global food market. It includes production, import, exports information for wheat, maize, rice and soybean. Are you in need of a template that can accommodate all of your creative concepts This one is crafted professionally and can be altered to fit any style. Use it with Google Slides or PowerPoint. Include striking photographs, symbols, depictions, and other visuals. Fill, move around, or remove text boxes as desired. Test out color palettes and font mixtures. Edit and save your work, or work with colleagues. Download Dashboard Depicting Production In Global Agricultural Product Promotion Template Pdf and observe how to make your presentation outstanding. Give an impeccable presentation to your group and make your presentation unforgettable.
-
Farm Management Dashboard Depicting Agricultural Product Promotion Pictures Pdf
This slide showcases the dashboard depicting data related to the production of fruits. The dashboard includes area, last production, air temperature, water content, pH value and financial statistics. This modern and well-arranged Farm Management Dashboard Depicting Agricultural Product Promotion Pictures Pdf provides lots of creative possibilities. It is very simple to customize and edit with the Powerpoint Software. Just drag and drop your pictures into the shapes. All facets of this template can be edited with Powerpoint, no extra software is necessary. Add your own material, put your images in the places assigned for them, adjust the colors, and then you can show your slides to the world, with an animated slide included.
-
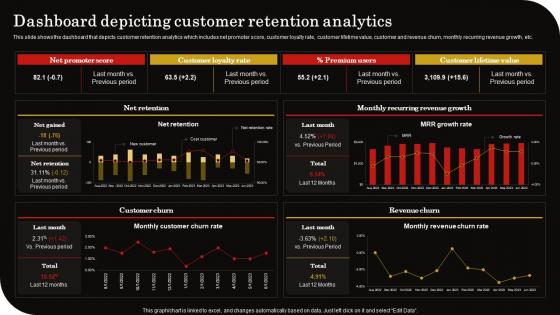
Dashboard Depicting Customer Retention Client Retention Strategy To Reduce Churn Rate Professional Pdf
This slide shows the dashboard that depicts customer retention analytics which includes net promoter score, customer loyalty rate, customer lifetime value, customer and revenue churn, monthly recurring revenue growth, etc. If you are looking for a format to display your unique thoughts, then the professionally designed Dashboard Depicting Customer Retention Client Retention Strategy To Reduce Churn Rate Professional Pdf is the one for you. You can use it as a Google Slides template or a PowerPoint template. Incorporate impressive visuals, symbols, images, and other charts. Modify or reorganize the text boxes as you desire. Experiment with shade schemes and font pairings. Alter, share or cooperate with other people on your work. Download Dashboard Depicting Customer Retention Client Retention Strategy To Reduce Churn Rate Professional Pdf and find out how to give a successful presentation. Present a perfect display to your team and make your presentation unforgettable.


