Comparative analysis chart PowerPoint Presentation Templates and Google Slides
-
5 Years Comparative Analysis Chart Ppt PowerPoint Presentation Complete Deck With Slides
Improve your presentation delivery using this 5 Years Comparative Analysis Chart Ppt PowerPoint Presentation Complete Deck With Slides. Support your business vision and objectives using this well-structured PPT deck. This template offers a great starting point for delivering beautifully designed presentations on the topic of your choice. Comprising twenty slides this professionally designed template is all you need to host discussion and meetings with collaborators. Each slide is self-explanatory and equipped with high-quality graphics that can be adjusted to your needs. Therefore, you will face no difficulty in portraying your desired content using this PPT slideshow. This PowerPoint slideshow contains every important element that you need for a great pitch. It is not only editable but also available for immediate download and utilization. The color, font size, background, shapes everything can be modified to create your unique presentation layout. Therefore, download it now.
-
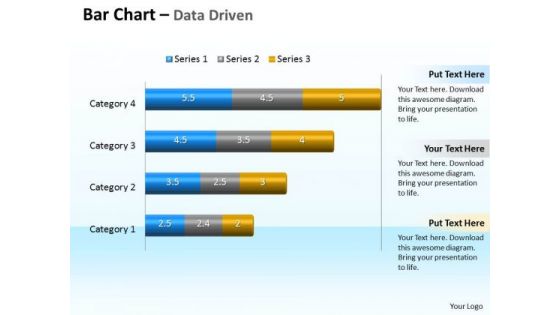
Business Data Analysis Chart Comparing Multiple Entities PowerPoint Templates
Analyze Ailments On Our business data analysis chart comparing multiple entities Powerpoint Templates. Bring Out The Thinking Doctor In You. Dock Your Thoughts With Our Financial Analysis . They Will Launch Them Into Orbit.
-
Data Analysis Programs 3d Bar Chart To Compare Categories PowerPoint Templates
Discover Decisive Moments With Our data analysis programs 3d bar chart to compare categories Powerpoint Templates . They Help Make That Crucial Difference.
-
Examples Of Data Analysis Market Driven Radar Chart To Compare PowerPoint Slides Templates
Rely On Our examples of data analysis market driven radar chart to compare powerpoint slides Templates In Any Duel. They Will Drive Home Your Point.
-
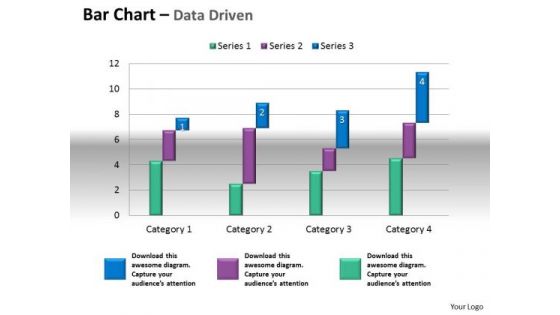
Microsoft Excel Data Analysis Bar Chart To Compare Quantities PowerPoint Templates
Our microsoft excel data analysis bar chart to compare quantities Powerpoint Templates Leave No One In Doubt. Provide A Certainty To Your Views.
-
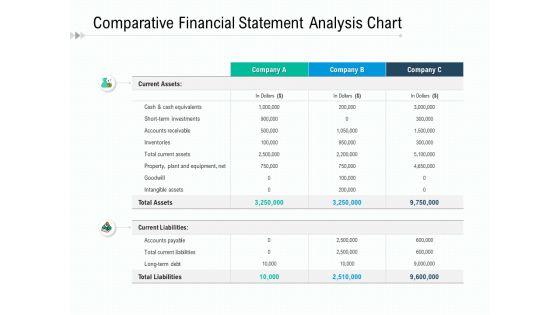
Comparative Financial Statement Analysis Chart Ppt PowerPoint Presentation Model Master Slide
Presenting this set of slides with name comparative financial statement analysis chart ppt powerpoint presentation model master slide. The topics discussed in these slides are current assets, current liabilities, equivalents, investments, inventories. This is a completely editable PowerPoint presentation and is available for immediate download. Download now and impress your audience.
-
Bar Graph And Line Chart For Comparative Analysis Icon Ppt PowerPoint Presentation Gallery Infographics PDF
Showcasing this set of slides titled bar graph and line chart for comparative analysis icon ppt powerpoint presentation gallery infographics pdf. The topics addressed in these templates are bar graph and line chart for comparative analysis icon. All the content presented in this PPT design is completely editable. Download it and make adjustments in color, background, font etc. as per your unique business setting.
-
Brand Comparative Analysis Chart With Market Size And Pricing Model Pictures PDF
This slide illustrates comparative analysis of brands of XYZ product. It includes their market size, key features of these brands.Showcasing this set of slides titled Brand Comparative Analysis Chart With Market Size And Pricing Model Pictures PDF. The topics addressed in these templates are Pricing Model, Competitive Pricing, Market Size. All the content presented in this PPT design is completely editable. Download it and make adjustments in color, background, font etc. as per your unique business setting.
-
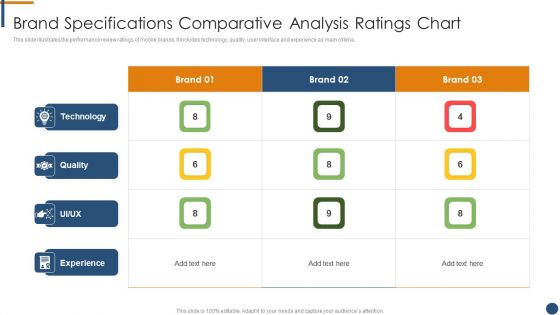
Brand Specifications Comparative Analysis Ratings Chart Demonstration PDF
This slide illustrates the performance review ratings of mobile brands. It includes technology, quality, user interface and experience as main criteria.Showcasing this set of slides titled Brand Specifications Comparative Analysis Ratings Chart Demonstration PDF. The topics addressed in these templates are Technology, Quality, Experience. All the content presented in this PPT design is completely editable. Download it and make adjustments in color, background, font etc. as per your unique business setting
-
Brands Comparative Analysis Chart With Features And Durability Ratings Template PDF
This slide illustrates tabular comparative analysis of three brands. It includes ratings on features, price, technology, service, support, durability etc.Pitch your topic with ease and precision using this Brands Comparative Analysis Chart With Features And Durability Ratings Template PDF. This layout presents information on Technology, Price, Service. It is also available for immediate download and adjustment. So, changes can be made in the color, design, graphics or any other component to create a unique layout.
-
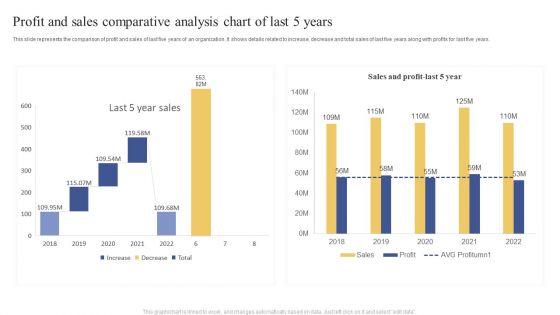
Profit And Sales Comparative Analysis Chart Of Last 5 Years Ppt Visual Aids Example 2015 PDF
This slide represents the comparison of profit and sales of last five years of an organization. It shows details related to increase, decrease and total sales of last five years along with profits for last five years. Showcasing this set of slides titled Profit And Sales Comparative Analysis Chart Of Last 5 Years Ppt Visual Aids Example 2015 PDF. The topics addressed in these templates are Last 5 Year, Sales, 2018 To 2022. All the content presented in this PPT design is completely editable. Download it and make adjustments in color, background, font etc. as per your unique business setting.
-
5 Years Attrition Rate Comparative Analysis Chart Of IT Company Ppt Layouts Examples PDF
This slide represents the table showing the comparison between attrition rates and no. of employees of an IT company over the five years. It includes details related to attrition rates and no. of employees during different years. Showcasing this set of slides titled 5 Years Attrition Rate Comparative Analysis Chart Of IT Company Ppt Layouts Examples PDF. The topics addressed in these templates are Attrition Rate, No Employees, 2018 To 2022. All the content presented in this PPT design is completely editable. Download it and make adjustments in color, background, font etc. as per your unique business setting.
-
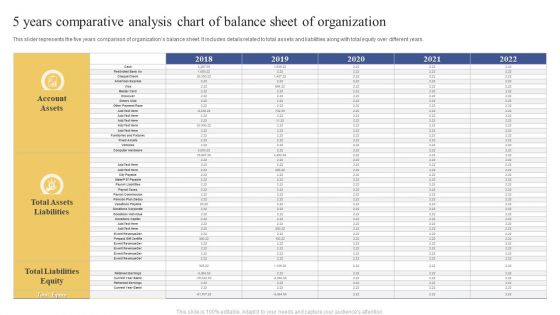
5 Years Comparative Analysis Chart Of Balance Sheet Of Organization Ppt Inspiration Slide PDF
This slider represents the five years comparison of organizations balance sheet. It includes details related to total assets and liabilities along with total equity over different years. Pitch your topic with ease and precision using this 5 Years Comparative Analysis Chart Of Balance Sheet Of Organization Ppt Inspiration Slide PDF. This layout presents information on Account Assets, Total Assets Liabilities, Total Liabilities Equity. It is also available for immediate download and adjustment. So, changes can be made in the color, design, graphics or any other component to create a unique layout.
-
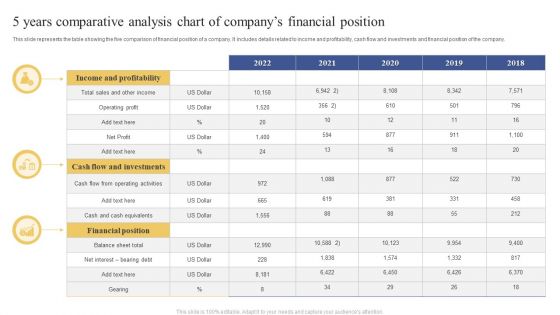
5 Years Comparative Analysis Chart Of Companys Financial Position Ppt Layouts Structure PDF
This slide represents the table showing the five comparison of financial position of a company. It includes details related to income and profitability, cash flow and investments and financial position of the company. Showcasing this set of slides titled 5 Years Comparative Analysis Chart Of Companys Financial Position Ppt Layouts Structure PDF. The topics addressed in these templates are Income And Profitability, Financial Position, Balance Sheet Total. All the content presented in this PPT design is completely editable. Download it and make adjustments in color, background, font etc. as per your unique business setting.
-
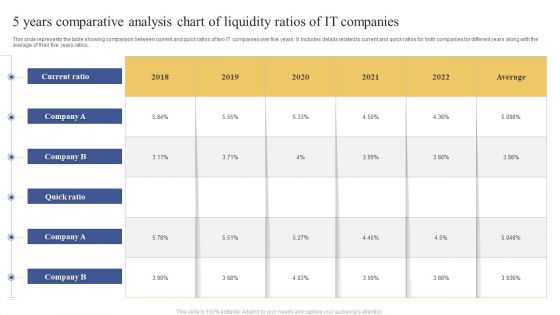
5 Years Comparative Analysis Chart Of Liquidity Ratios Of IT Companies Ppt Portfolio Visual Aids PDF
This slide represents the table showing comparison between current and quick ratios of two IT companies over five years. It includes details related to current and quick ratios for both companies for different years along with the average of their five years ratios. Pitch your topic with ease and precision using this 5 Years Comparative Analysis Chart Of Liquidity Ratios Of IT Companies Ppt Portfolio Visual Aids PDF. This layout presents information on Current Ratio, Average, 2018 To 2022. It is also available for immediate download and adjustment. So, changes can be made in the color, design, graphics or any other component to create a unique layout.
-
5 Years Employee Performance Comparative Analysis Chart Icon Ppt Portfolio Objects PDF
Presenting 5 Years Employee Performance Comparative Analysis Chart Icon Ppt Portfolio Objects PDF to dispense important information. This template comprises three stages. It also presents valuable insights into the topics including 5 Years, Employee Performance, Comparative Analysis, Chart Icon. This is a completely customizable PowerPoint theme that can be put to use immediately. So, download it and address the topic impactfully.
-
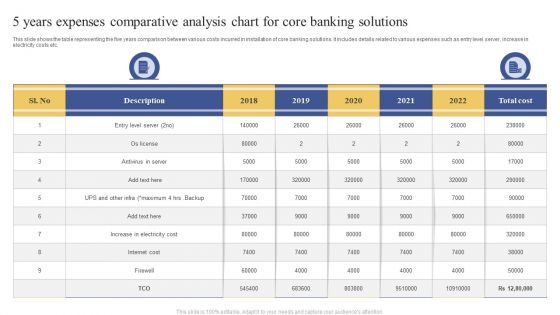
5 Years Expenses Comparative Analysis Chart For Core Banking Solutions Ppt Portfolio Clipart Images PDF
This slide shows the table representing the five years comparison between various costs incurred in installation of core banking solutions. It includes details related to various expenses such as entry level server, increase in electricity costs etc. Pitch your topic with ease and precision using this 5 Years Expenses Comparative Analysis Chart For Core Banking Solutions Ppt Portfolio Clipart Images PDF. This layout presents information on Entry Level Server, Antivirus Server, Increase Electricity Cost. It is also available for immediate download and adjustment. So, changes can be made in the color, design, graphics or any other component to create a unique layout.
-
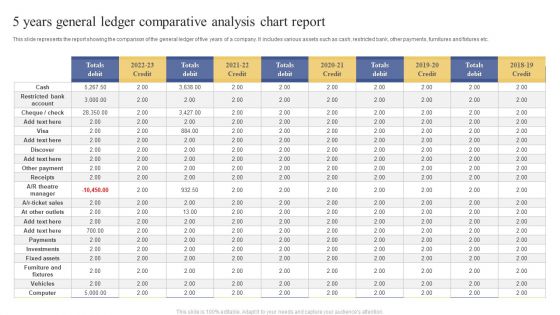
5 Years General Ledger Comparative Analysis Chart Report Ppt Model Slide PDF
This slide represents the report showing the comparison of the general ledger of five years of a company. It includes various assets such as cash, restricted bank, other payments, furnitures and fixtures etc. Showcasing this set of slides titled 5 Years General Ledger Comparative Analysis Chart Report Ppt Model Slide PDF. The topics addressed in these templates are Other Payment, Investments, Fixed Assets. All the content presented in this PPT design is completely editable. Download it and make adjustments in color, background, font etc. as per your unique business setting.
-
5 Years Mutual Funds Performance Comparative Analysis Chart Icon Ppt Show Gridlines PDF
Persuade your audience using this 5 Years Mutual Funds Performance Comparative Analysis Chart Icon Ppt Show Gridlines PDF. This PPT design covers three stages, thus making it a great tool to use. It also caters to a variety of topics including 5 Years, Mutual Funds, Performance Comparative, Analysis, Chart Icon. Download this PPT design now to present a convincing pitch that not only emphasizes the topic but also showcases your presentation skills.
-
5 Years Net Income Comparative Analysis Chart Of Financial Institute Ppt Show Designs PDF
This slide represents the comparison of net income of financial institute for different years. It includes details related to total revenue, gross profit, operating income and net income and ratios of the institute for different years. Showcasing this set of slides titled 5 Years Net Income Comparative Analysis Chart Of Financial Institute Ppt Show Designs PDF. The topics addressed in these templates are Income Statement, 2018 To 2022, Ratios. All the content presented in this PPT design is completely editable. Download it and make adjustments in color, background, font etc. as per your unique business setting.
-
5 Years Profit And Loss Comparative Analysis Chart Of Enterprise Ppt Icon Graphics PDF
This slide represents the comparison of profit and loss of an organization for the five years. It includes details related to profit and loss from various accounts such as order fees, concession income, facility rental etc. Pitch your topic with ease and precision using this 5 Years Profit And Loss Comparative Analysis Chart Of Enterprise Ppt Icon Graphics PDF. This layout presents information on Account, 2018 To 2022, Exchange Fees. It is also available for immediate download and adjustment. So, changes can be made in the color, design, graphics or any other component to create a unique layout.
-
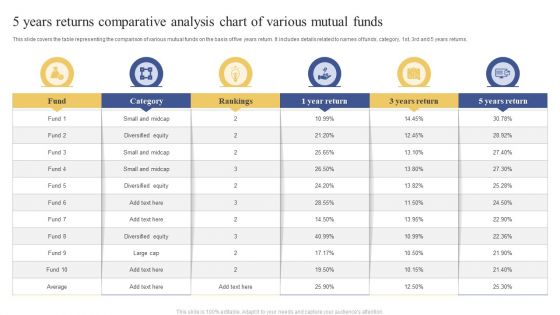
5 Years Returns Comparative Analysis Chart Of Various Mutual Funds Ppt Slides Microsoft PDF
This slide covers the table representing the comparison of various mutual funds on the basis of five years return. It includes details related to names of funds, category, 1st, 3rd and 5 years returns. Showcasing this set of slides titled 5 Years Returns Comparative Analysis Chart Of Various Mutual Funds Ppt Slides Microsoft PDF. The topics addressed in these templates are Diversified Equity, Small And Midcap, Diversified Equity. All the content presented in this PPT design is completely editable. Download it and make adjustments in color, background, font etc. as per your unique business setting.
-
5 Years Revenue Comparative Analysis Chart Icon Ppt Inspiration Diagrams PDF
Presenting 5 Years Revenue Comparative Analysis Chart Icon Ppt Inspiration Diagrams PDF to dispense important information. This template comprises three stages. It also presents valuable insights into the topics including 5 Years, Revenue Comparative, Analysis Chart, Icon. This is a completely customizable PowerPoint theme that can be put to use immediately. So, download it and address the topic impactfully.
-
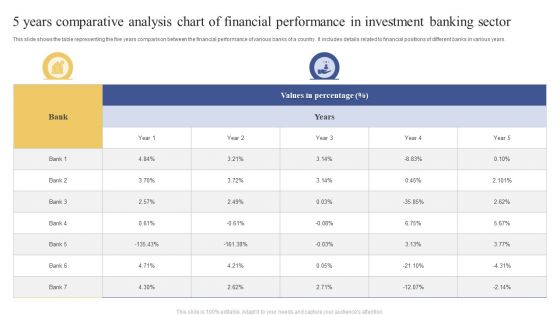
5 Years Comparative Analysis Chart Of Financial Performance In Investment Banking Sector Themes PDF
This slide shows the table representing the five years comparison between the financial performance of various banks of a country. It includes details related to financial positions of different banks in various years. Showcasing this set of slides titled 5 Years Comparative Analysis Chart Of Financial Performance In Investment Banking Sector Themes PDF. The topics addressed in these templates are Values Percentage, Bank, Year. All the content presented in this PPT design is completely editable. Download it and make adjustments in color, background, font etc. as per your unique business setting.
-
5 Years Sales And Profit Growth Comparative Analysis Chart Of Private Banks Infographics PDF
This slide shows the table representing the comparison between sales and profit growth of five years of various private banks. It includes details related to names of private banks and their five years sales growth and profit growth. Pitch your topic with ease and precision using this 5 Years Sales And Profit Growth Comparative Analysis Chart Of Private Banks Infographics PDF. This layout presents information on Private Banks, Sales Growth, Profit Growth. It is also available for immediate download and adjustment. So, changes can be made in the color, design, graphics or any other component to create a unique layout.
-
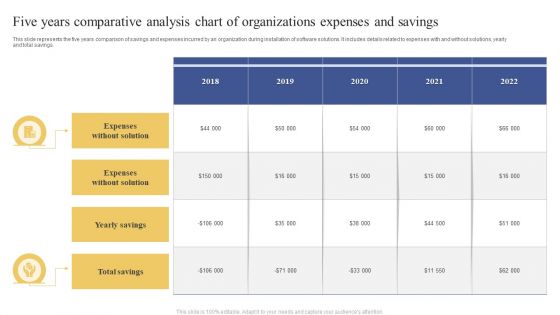
Five Years Comparative Analysis Chart Of Organizations Expenses And Savings Topics PDF
This slide represents the five years comparison of savings and expenses incurred by an organization during installation of software solutions. It includes details related to expenses with and without solutions, yearly and total savings. Showcasing this set of slides titled Five Years Comparative Analysis Chart Of Organizations Expenses And Savings Topics PDF. The topics addressed in these templates are Expenses Without Solution, Yearly Savings, Total Savings. All the content presented in this PPT design is completely editable. Download it and make adjustments in color, background, font etc. as per your unique business setting.
-
5 Years Price Comparative Analysis Chart Of Cloud Service Solutions Brochure PDF
This slide represents the table showing the five years comparison of prices incurred in installing cloud service solution in the organization. It includes details related to on-premises prices, cloud services price and savings for different years. Showcasing this set of slides titled 5 Years Price Comparative Analysis Chart Of Cloud Service Solutions Brochure PDF. The topics addressed in these templates are Cloud, Savings, 2018 To 2022. All the content presented in this PPT design is completely editable. Download it and make adjustments in color, background, font etc. as per your unique business setting.
-
5 Years Technological Comparative Analysis Chart Of Service Provisioning And Operational Costs Information PDF
This slide represents the five years technological and cost based comparison for use of passive optical network. It includes details related to ONT cost, service provisioning and operational costs for five years. Pitch your topic with ease and precision using this 5 Years Technological Comparative Analysis Chart Of Service Provisioning And Operational Costs Information PDF. This layout presents information on Optical Network Termination, Service Provisioning, Operational Cost. It is also available for immediate download and adjustment. So, changes can be made in the color, design, graphics or any other component to create a unique layout.
-
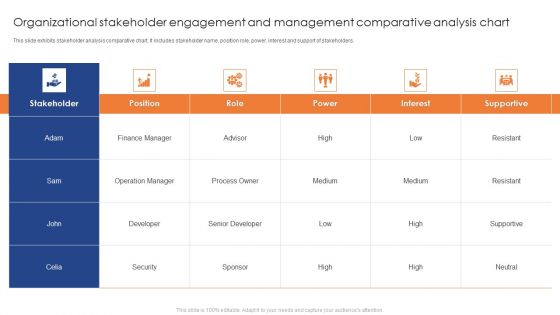
Organizational Stakeholder Engagement And Management Comparative Analysis Chart Professional PDF
This slide exhibits stakeholder analysis comparative chart. It includes stakeholder name, position role, power, interest and support of stakeholders. Showcasing this set of slides titled Organizational Stakeholder Engagement And Management Comparative Analysis Chart Professional PDF. The topics addressed in these templates are Finance Manager, Operation Manager, Developer. All the content presented in this PPT design is completely editable. Download it and make adjustments in color, background, font etc. as per your unique business setting.


