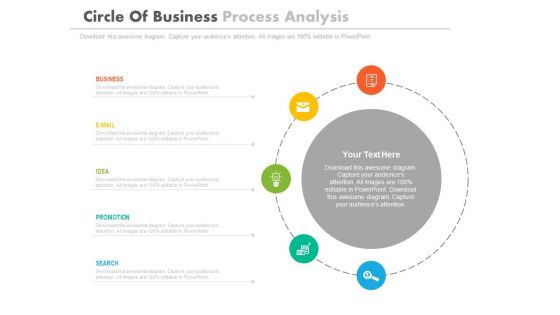
Circle analysis PowerPoint Presentation Templates and Google Slides
-
Data Analysis Planning Circle Ppt PowerPoint Presentation Complete Deck
Share a great deal of information on the topic by deploying this data analysis planning circle ppt powerpoint presentation complete deck. Support your ideas and thought process with this prefabricated set. It includes a set of sixteen slides, all fully modifiable and editable. Each slide can be restructured and induced with the information and content of your choice. You can add or remove large content boxes as well, to make this PPT slideshow more personalized. Its high-quality graphics and visuals help in presenting a well-coordinated pitch. This PPT template is also a resourceful tool to take visual cues from and implement the best ideas to help your business grow and expand. The main attraction of this well-formulated deck is that everything is editable, giving you the freedom to adjust it to your liking and choice. Changes can be made in the background and theme as well to deliver an outstanding pitch. Therefore, click on the download button now to gain full access to this multifunctional set.
-
Circle With 5 Arrows Analysis Arrows Ppt PowerPoint Presentation Complete Deck
This circle with 5 arrows analysis arrows ppt powerpoint presentation complete deck acts as backup support for your ideas, vision, thoughts, etc. Use it to present a thorough understanding of the topic. This PPT slideshow can be utilized for both in-house and outside presentations depending upon your needs and business demands. Entailing twelve slides with a consistent design and theme, this template will make a solid use case. As it is intuitively designed, it suits every business vertical and industry. All you have to do is make a few tweaks in the content or any other component to design unique presentations. The biggest advantage of this complete deck is that it can be personalized multiple times once downloaded. The color, design, shapes, and other elements are free to modify to add personal touches. You can also insert your logo design in this PPT layout. Therefore a well-thought and crafted presentation can be delivered with ease and precision by downloading this circle with 5 arrows analysis arrows ppt powerpoint presentation complete deck PPT slideshow.
-
Data Analysis Plan Business Circles Ppt PowerPoint Presentation Complete Deck
Share a great deal of information on the topic by deploying this data analysis plan business circles ppt powerpoint presentation complete deck. Support your ideas and thought process with this prefabricated set. It includes a set of twelve slides, all fully modifiable and editable. Each slide can be restructured and induced with the information and content of your choice. You can add or remove large content boxes as well, to make this PPT slideshow more personalized. Its high-quality graphics and visuals help in presenting a well-coordinated pitch. This PPT template is also a resourceful tool to take visual cues from and implement the best ideas to help your business grow and expand. The main attraction of this well-formulated deck is that everything is editable, giving you the freedom to adjust it to your liking and choice. Changes can be made in the background and theme as well to deliver an outstanding pitch. Therefore, click on the download button now to gain full access to this multifunctional set.
-
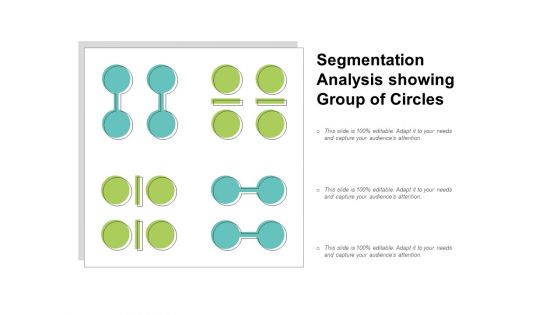
Segmentation Analysis Showing Group Of Circles Ppt PowerPoint Presentation Portfolio Mockup
This is a segmentation analysis showing group of circles ppt powerpoint presentation portfolio mockup. This is a four stage process. The stages in this process are cluster analysis, cluster examination, cluster investigation.
-
Cluster Analysis Circles Connected With Centre Point Ppt Powerpoint Presentation Professional Slides
This is a cluster analysis circles connected with centre point ppt powerpoint presentation professional slides. This is a three stage process. The stages in this process are circle cluster, cyclic cluster, circular cluster.
-
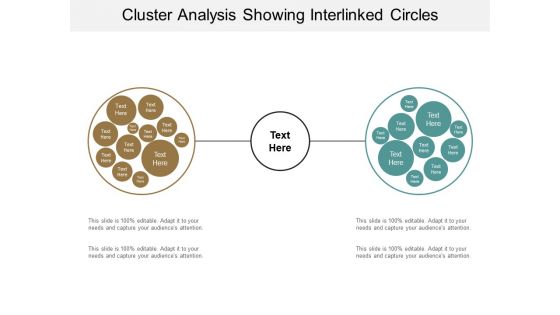
Cluster Analysis Showing Interlinked Circles Ppt Powerpoint Presentation Gallery Design Templates
This is a cluster analysis showing interlinked circles ppt powerpoint presentation gallery design templates. This is a two stage process. The stages in this process are circle cluster, cyclic cluster, circular cluster.
-
Eight Concentric Circles For Social Media Audience Analysis Ppt PowerPoint Presentation Icon Graphics
This is a Eight Concentric Circles For Social Media Audience Analysis Ppt PowerPoint Presentation Icon Graphics. This is a stage process. The stages in this process are 7 concentric circles, 7 circular cycle, 7 circular diagram.
-
Five Concentric Circles For Social Media Audience Analysis Ppt PowerPoint Presentation Infographics File Formats
This is a Five Concentric Circles For Social Media Audience Analysis Ppt PowerPoint Presentation Infographics File Formats. This is a stage process. The stages in this process are 7 concentric circles, 7 circular cycle, 7 circular diagram.
-
Four Concentric Circles For Social Media Audience Analysis Ppt PowerPoint Presentation Infographic Template Graphics
This is a Four Concentric Circles For Social Media Audience Analysis Ppt PowerPoint Presentation Infographic Template Graphics. This is a stage process. The stages in this process are 7 concentric circles, 7 circular cycle, 7 circular diagram.
-
Seven Concentric Circles For Social Media Audience Analysis Ppt PowerPoint Presentation Ideas Model
This is a Seven Concentric Circles For Social Media Audience Analysis Ppt PowerPoint Presentation Ideas Model. This is a stage process. The stages in this process are 7 concentric circles, 7 circular cycle, 7 circular diagram.
-
Six Concentric Circles For Social Media Audience Analysis Ppt PowerPoint Presentation Pictures Portrait
This is a Six Concentric Circles For Social Media Audience Analysis Ppt PowerPoint Presentation Pictures Portrait. This is a stage process. The stages in this process are 7 concentric circles, 7 circular cycle, 7 circular diagram.
-
Three Concentric Circles For Social Media Audience Analysis Ppt PowerPoint Presentation Outline Ideas
This is a Three Concentric Circles For Social Media Audience Analysis Ppt PowerPoint Presentation Outline Ideas. This is a stage process. The stages in this process are 7 concentric circles, 7 circular cycle, 7 circular diagram.
-
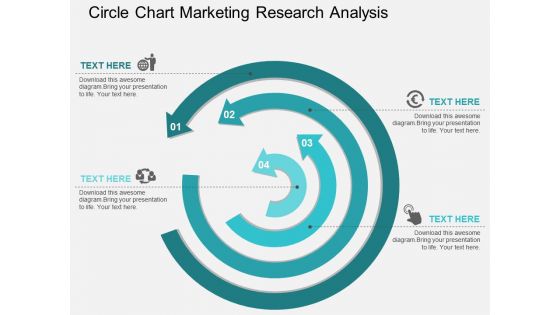
Circle Chart Marketing Research Analysis Powerpoint Template
Above PPT slide provides the ideal backdrop to display marketing research analysis. This PowerPoint template contains graphics of circular arrows chart. Add this diagram in your presentations to visually support your content.
-
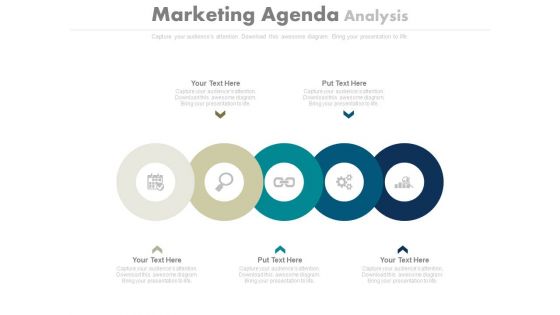
Circles For Marketing Agenda Analysis Powerpoint Slides
This PowerPoint template contains five circles in linear flow with icons. You may download this slide to display marketing agenda analysis. You can easily customize this template to make it more unique as per your need.
-
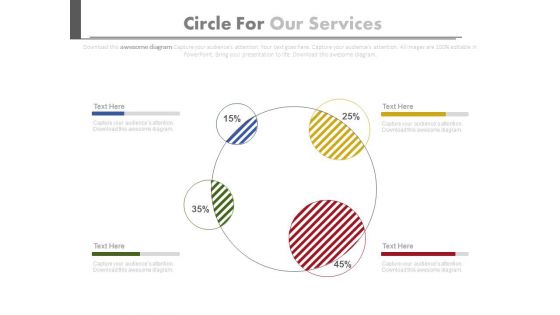
Circle Chart For Value Analysis Powerpoint Slides
This PowerPoint template has been designed for business presentations and corporate slides. The PowerPoint template has a high quality design. You can download this PowerPoint slide for corporate presentations or annual meeting and business plans.
-
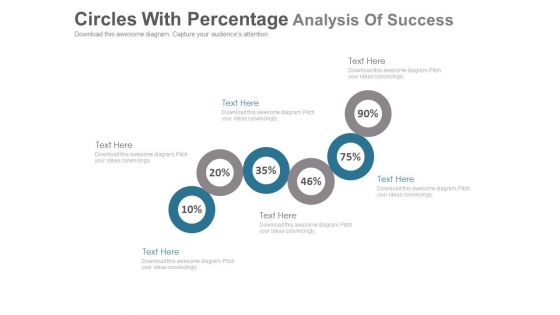
Six Circles For Percentage Value Analysis Powerpoint Slides
This PowerPoint template has been designed with six circles and percentage values. This PPT slide can be used to display financial ratio analysis. You can download finance PowerPoint template to prepare awesome presentations.
-
Circle Infographics For Market Research Analysis Powerpoint Template
This PowerPoint template has been designed with circular infographic diagram. You can use this PPT diagram slide to visually support your content. Above slide is suitable for business presentation.
-
Circle Infographics For Financial Analysis Powerpoint Template
This business slide contains circular infographic design. This diagram may be used to depict financial process analysis. Visual effect this slide helps in maintaining the flow of the discussion and provides more clarity to the subject.
-
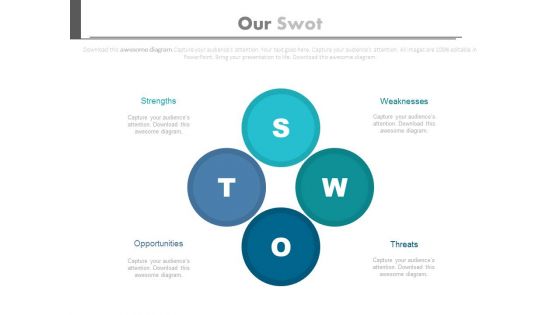
Four Circles For Swot Analysis Powerpoint Template
Visually support your presentation with our above template showing graphics of SWOT analysis. This PPT slide has been professionally designed to present market research and analysis. This template offers an excellent background to build impressive presentation.
-
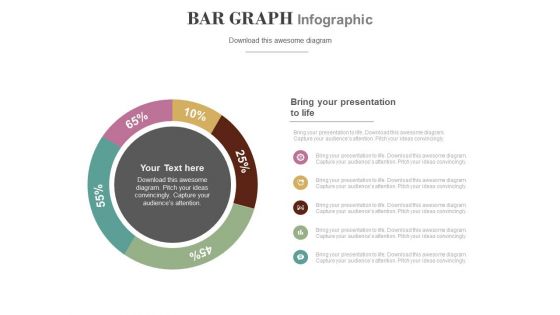
Circle Chart With Percentage Value Analysis Powerpoint Slides
This PowerPoint template has been designed with circular process diagram. This business diagram helps to exhibit financial process control and analysis. Use this diagram to visually support your content.
-
Four Circle Steps For Process Analysis Powerpoint Slides
This innovative, stunningly beautiful dashboard has been designed for data visualization. It contains four circles steps for process analysis. This PowerPoint template helps to display your information in a useful, simple and orderly way.
-
Circle Process For Financial Analysis Powerpoint Template
This business slide has been designed with circle diagram of four icons. This diagram has been designed to display financial planning. Develop your marketing strategy and communicate with your team with this professional slide design.
-
Three Circles With Percentage Values For Financial Analysis Powerpoint Slides
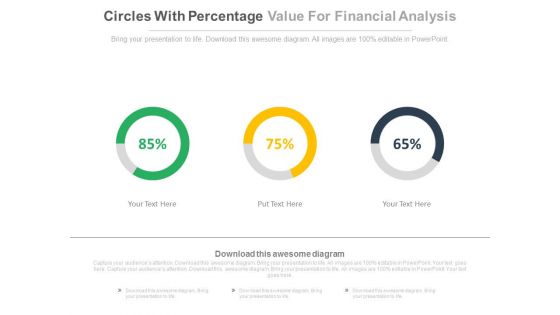
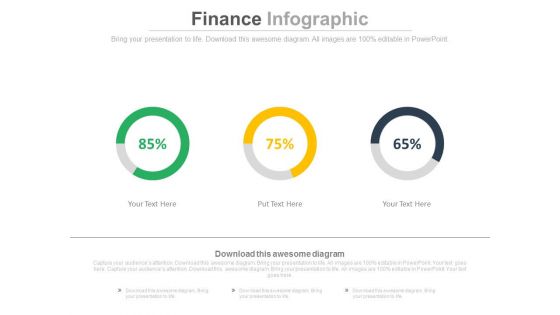
This PowerPoint template has been designed with three circles and percentage values. This PPT slide may be used to display financial analysis for business. Download this slide to build unique presentation.
-
Linear Circles Percentage Analysis Charts Powerpoint Slides
This PowerPoint template has been designed with graphics of three circles and percentage ratios. You may use this dashboard slide design for topics like profit growth and financial planning. This PPT slide is powerful tool to describe your ideas.
-
Circles For Financial Ratio Analysis Powerpoint Template
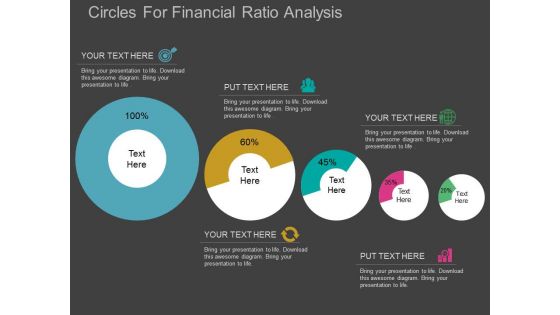
This PowerPoint diagram contains circles in upward trend. Download this diagram slide to display financial ratio analysis. This diagram is editable you can edit text, color, shade and style as per you need.
-
Venn Circles For Financial Ratio Analysis Powerpoint Templates
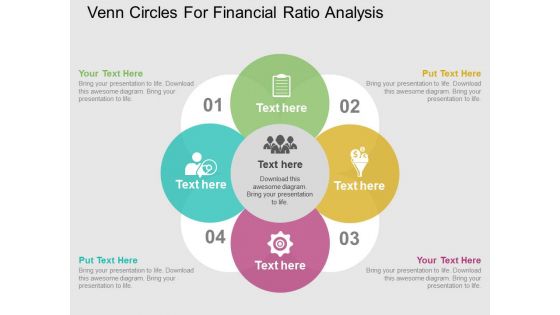
Create dynamic presentations with our professional template containing dollar plant. This diagram represents the dollar growth. Download this template to leave permanent impression on your audience.
-
Circles With Icons For Swot Analysis PowerPoint Template
Visually support your presentation with our above template showing four circles with icons. This slide has been professionally designed to present SWOT analysis. This template offers an excellent background to build impressive presentation.
-
Currency Symbols Around Circle For Value Analysis PowerPoint Templates
Above slide provides the ideal backdrop for finance related topics. Use our above with graphics of currency symbols around circle for value analysis. Add this diagram in your presentations to visually support your content.
-
Venn Circles Infographic For Financial Analysis PowerPoint Templates
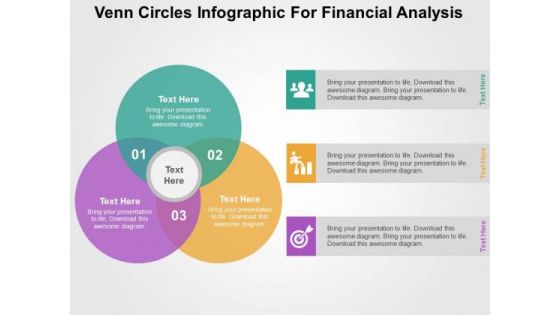
This PowerPoint template has been designed with Venn circles infographic. This infographic template useful for financial analysis. Accelerate the impact of your ideas using this template.
-
Venn Circles For Business Analysis Presentation Template
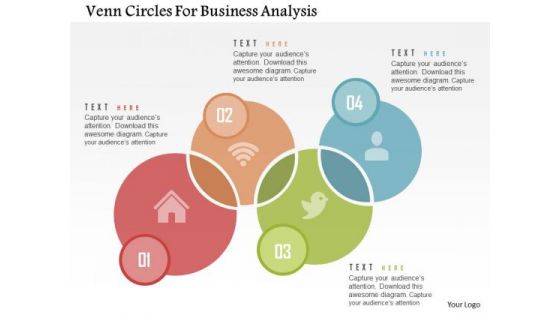
Use this PowerPoint diagram for classification of business activities. It may also be used for business analysis . This business diagram makes your presentation more interactive.
-
Business Diagram Connected Circles For Website Competitive Analysis Presentation Template
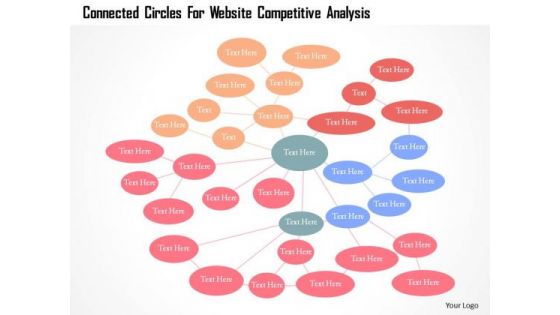
Our above slide display graphics of connected circles. Download this diagram slide to display website competitive analysis. Adjust the above diagram in your business presentations to visually support your content.
-
Four Interconnected Circles For Data Collection And Analysis Ppt PowerPoint Presentation File Inspiration PDF
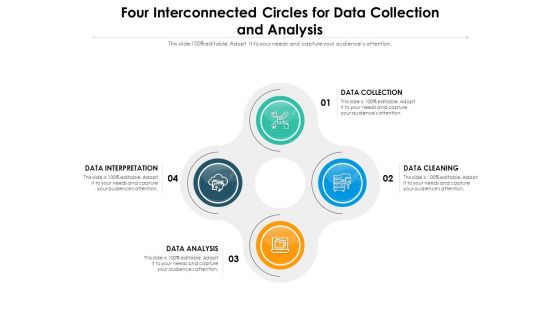
Presenting four interconnected circles for data collection and analysis ppt powerpoint presentation file inspiration pdf to dispense important information. This template comprises four stages. It also presents valuable insights into the topics including data collection, data cleaning, data analysis. This is a completely customizable PowerPoint theme that can be put to use immediately. So, download it and address the topic impactfully.
-
Circle With Eight Sections For Business Promotion Campaign Analysis Ppt PowerPoint Presentation Gallery Ideas PDF
Presenting circle with eight sections for business promotion campaign analysis ppt powerpoint presentation gallery ideas pdf to dispense important information. This template comprises eight stages. It also presents valuable insights into the topics including social metrics, retention rate, conversion rate. This is a completely customizable PowerPoint theme that can be put to use immediately. So, download it and address the topic impactfully.
-
Circle With Five Sections For Business Promotion Campaign Analysis Ppt PowerPoint Presentation Gallery Guidelines PDF
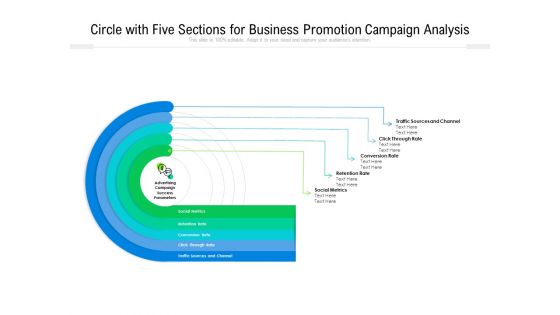
Persuade your audience using this circle with five sections for business promotion campaign analysis ppt powerpoint presentation gallery guidelines pdf. This PPT design covers five stages, thus making it a great tool to use. It also caters to a variety of topics including social metrics, retention rate, conversion rate. Download this PPT design now to present a convincing pitch that not only emphasizes the topic but also showcases your presentation skills.
-
Circle With Four Sections For Business Promotion Campaign Analysis Ppt PowerPoint Presentation File Format Ideas PDF
Presenting circle with four sections for business promotion campaign analysis ppt powerpoint presentation file format ideas pdf to dispense important information. This template comprises four stages. It also presents valuable insights into the topics including social metrics, retention rate, conversion rate. This is a completely customizable PowerPoint theme that can be put to use immediately. So, download it and address the topic impactfully.
-
Circle With Nine Sections For Business Promotion Campaign Analysis Ppt PowerPoint Presentation Gallery Examples PDF
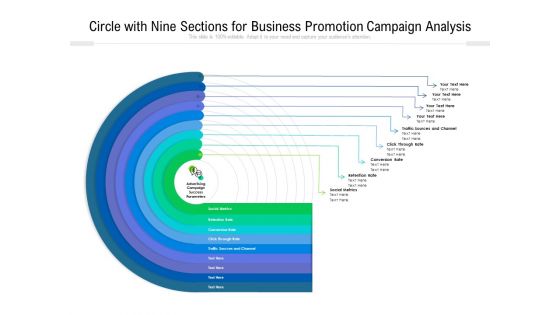
Persuade your audience using this circle with nine sections for business promotion campaign analysis ppt powerpoint presentation gallery examples pdf. This PPT design covers nine stages, thus making it a great tool to use. It also caters to a variety of topics including social metrics, retention rate, conversion rate. Download this PPT design now to present a convincing pitch that not only emphasizes the topic but also showcases your presentation skills.
-
Circle With Seven Sections For Business Promotion Campaign Analysis Ppt PowerPoint Presentation File Graphic Images PDF
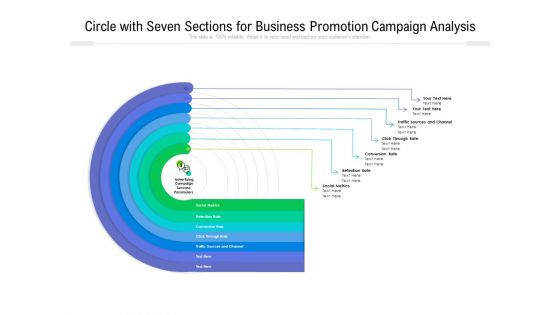
Presenting circle with seven sections for business promotion campaign analysis ppt powerpoint presentation file graphic images pdf to dispense important information. This template comprises seven stages. It also presents valuable insights into the topics including social metrics, retention rate, conversion rate. This is a completely customizable PowerPoint theme that can be put to use immediately. So, download it and address the topic impactfully.
-
Circle With Six Sections For Business Promotion Campaign Analysis Ppt PowerPoint Presentation Gallery Picture PDF
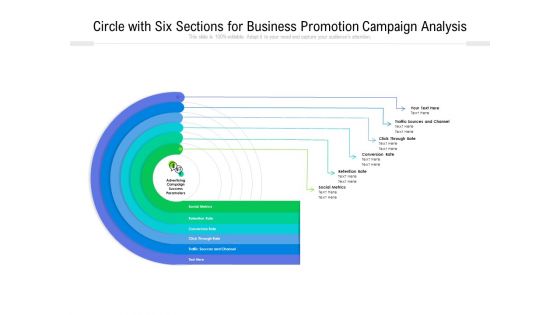
Persuade your audience using this circle with six sections for business promotion campaign analysis ppt powerpoint presentation gallery picture pdf. This PPT design covers six stages, thus making it a great tool to use. It also caters to a variety of topics including social metrics, retention rate, conversion rate. Download this PPT design now to present a convincing pitch that not only emphasizes the topic but also showcases your presentation skills.
-
Percentage Circle With Planning And Analysis Ppt PowerPoint Presentation File Background PDF
Pitch your topic with ease and precision using this percentage circle with planning and analysis ppt powerpoint presentation file background pdf. This layout presents information on development, evaluation, integration. It is also available for immediate download and adjustment. So, changes can be made in the color, design, graphics or any other component to create a unique layout.
-
Circle Chart With Percentage Analysis Vector Icon Ppt PowerPoint Presentation Summary Graphic Images PDF
Presenting this set of slides with name circle chart with percentage analysis vector icon ppt powerpoint presentation summary graphic images pdf. This is a three stage process. The stages in this process are circle chart with percentage analysis vector icon. This is a completely editable PowerPoint presentation and is available for immediate download. Download now and impress your audience.
-
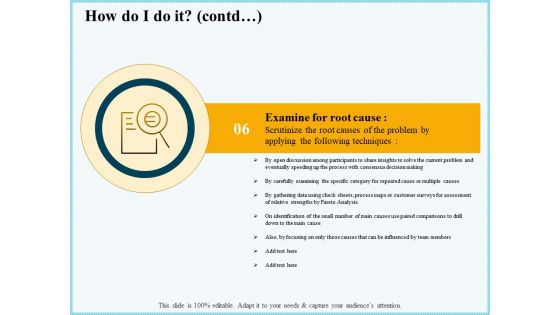
Vicious Circle Effect On Quality Assurance How Do I Do It Contd Analysis Ppt Show Outline PDF
This is a vicious circle effect on quality assurance how do i do it contd analysis ppt show outline pdf template with various stages. Focus and dispense information on one stages using this creative set, that comes with editable features. It contains large content boxes to add your information on topics like consensus decision making, current problem, pareto analysis, team members. You can also showcase facts, figures, and other relevant content using this PPT layout. Grab it now.
-
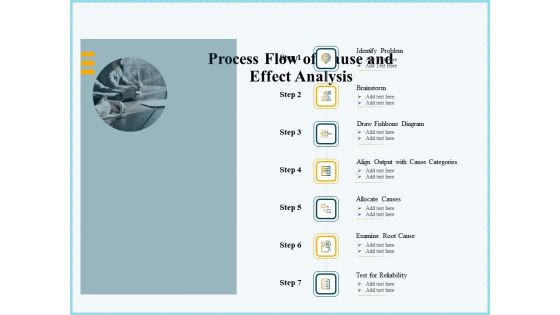
Vicious Circle Effect On Quality Assurance Process Flow Of Cause And Effect Analysis Ppt Portfolio Structure PDF
Presenting vicious circle effect on quality assurance process flow of cause and effect analysis ppt portfolio structure pdf to provide visual cues and insights. Share and navigate important information on seven stages that need your due attention. This template can be used to pitch topics like brainstorm, draw fishbone diagram, align output cause categories, allocate causes, examine root cause, test reliability, identify problem. In addtion, this PPT design contains high-resolution images, graphics, etc, that are easily editable and available for immediate download.
-
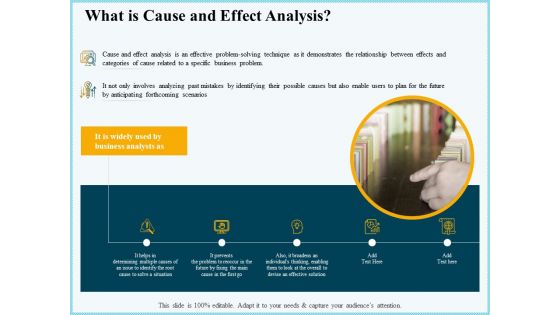
Vicious Circle Effect On Quality Assurance What Is Cause And Effect Analysis Ppt Infographic Template Deck PDF
Deliver an awe-inspiring pitch with this creative vicious circle effect on quality assurance what is cause and effect analysis ppt infographic template deck pdf bundle. Topics like business, analysts, problem, relationship, possible causes can be discussed with this completely editable template. It is available for immediate download depending on the needs and requirements of the user.
-
Vicious Circle Effect On Quality Assurance Why Use Cause And Effect Analysis Ppt Outline Backgrounds PDF
Presenting vicious circle effect on quality assurance why use cause and effect analysis ppt outline backgrounds pdf to provide visual cues and insights. Share and navigate important information on five stages that need your due attention. This template can be used to pitch topics like provides broader, clearer and logical, picture issue, helpful depth analysis, encourage brainstorming focusing, ensure maintenance, team focus, common problem. In addtion, this PPT design contains high-resolution images, graphics, etc, that are easily editable and available for immediate download.
-
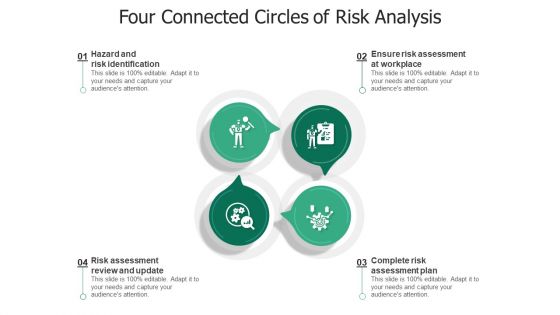
Four Connected Circles Of Risk Analysis Ppt Inspiration Slides PDF
Persuade your audience using this four connected circles of risk analysis ppt inspiration slides pdf. This PPT design covers four stages, thus making it a great tool to use. It also caters to a variety of topics including risk assessment review, risk identification, risk assessment plan. Download this PPT design now to present a convincing pitch that not only emphasizes the topic but also showcases your presentation skills.
-
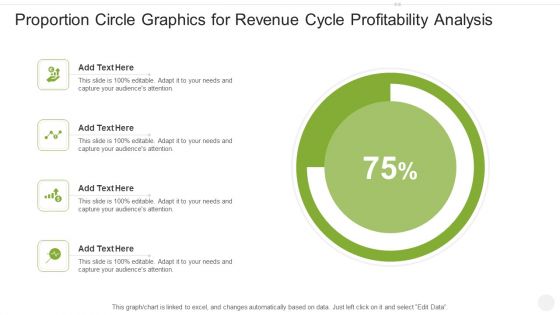
Proportion Circle Graphics For Revenue Cycle Profitability Analysis Introduction PDF
Showcasing this set of slides titled proportion circle graphics for revenue cycle profitability analysis introduction pdf. The topics addressed in these templates are proportion circle graphics for revenue cycle profitability analysis. All the content presented in this PPT design is completely editable. Download it and make adjustments in color, background, font etc. as per your unique business setting.
-
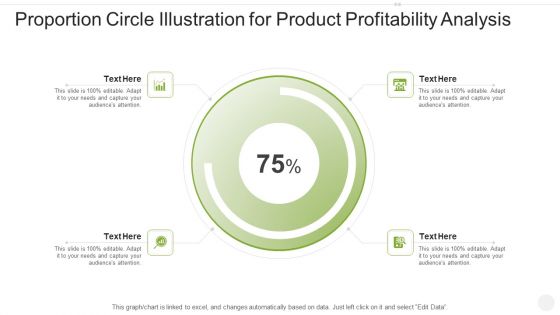
Proportion Circle Illustration For Product Profitability Analysis Designs PDF
Pitch your topic with ease and precision using this proportion circle illustration for product profitability analysis designs pdf. This layout presents information on proportion circle illustration for product profitability analysis. It is also available for immediate download and adjustment. So, changes can be made in the color, design, graphics or any other component to create a unique layout.
-
Proportion Circle Infographics For Financial Statement Analysis Mockup PDF
Pitch your topic with ease and precision using this proportion circle infographics for financial statement analysis mockup pdf. This layout presents information on proportion circle infographics for financial statement analysis. It is also available for immediate download and adjustment. So, changes can be made in the color, design, graphics or any other component to create a unique layout.
-
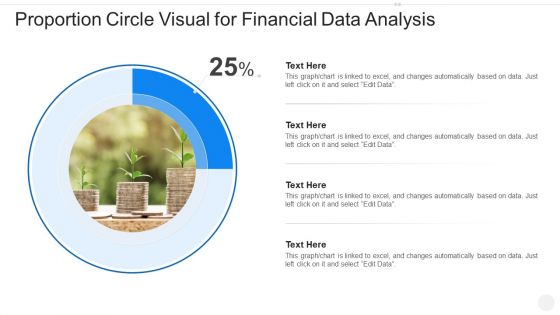
Proportion Circle Visual For Financial Data Analysis Guidelines PDF
Showcasing this set of slides titled proportion circle visual for financial data analysis guidelines pdf. The topics addressed in these templates are proportion circle visual for financial data analysis. All the content presented in this PPT design is completely editable. Download it and make adjustments in color, background, font etc. as per your unique business setting.
-
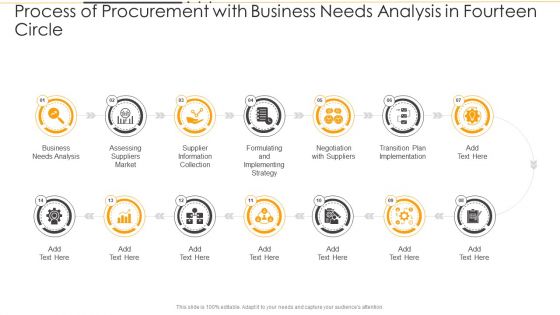
Process Of Procurement With Business Needs Analysis In Fourteen Circle Ppt PowerPoint Presentation Gallery Design Ideas PDF
Presenting Process Of Procurement With Business Needs Analysis In Fourteen Circle Ppt PowerPoint Presentation Gallery Design Ideas PDF to dispense important information. This template comprises fourteen stages. It also presents valuable insights into the topics including Business Needs Analysis, Assessing Suppliers Market, Supplier Information Collection. This is a completely customizable PowerPoint theme that can be put to use immediately. So, download it and address the topic impactfully.

