Charts revenue PowerPoint Presentation Templates and Google Slides
-
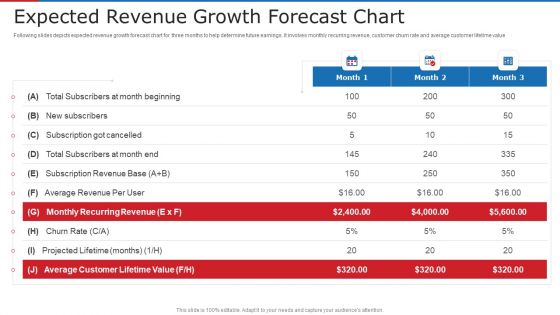
Expected Revenue Growth Forecast Chart Ppt Professional Graphics Tutorials PDF
Following slides depicts expected revenue growth forecast chart for three months to help determine future earnings. It involves monthly recurring revenue, customer churn rate and average customer lifetime value Deliver an awe inspiring pitch with this creative expected revenue growth forecast chart ppt professional graphics tutorials pdf bundle. Topics like average, revenue, rate can be discussed with this completely editable template. It is available for immediate download depending on the needs and requirements of the user.
-
Multiple Piece Puzzle Design Pie Chart Showing Geographic Revenue Split Rules PDF
Persuade your audience using this multiple piece puzzle design pie chart showing geographic revenue split rules pdf. This PPT design covers five stages, thus making it a great tool to use. It also caters to a variety of topics including multiple piece puzzle design pie chart showing geographic revenue split. Download this PPT design now to present a convincing pitch that not only emphasizes the topic but also showcases your presentation skills.
-
Retail Outlet Revenue Growth Chart Mockup PDF
This slide shows the revenue growth line chart of a retail store which includes passing footfall, customers per day, percentage of customer who purchased, revenue per day and revenue per year. Pitch your topic with ease and precision using this retail outlet revenue growth chart mockup pdf This layout presents information on Retail outlet revenue growth chart It is also available for immediate download and adjustment. So, changes can be made in the color, design, graphics or any other component to create a unique layout.
-
Employee Quarterly Sales And Revenue Generation Performance Chart Mockup PDF
This slide depicts annual sales percentage and revenue generated by employee. It provides information regarding overall employee performance for yearly appraisal process. Pitch your topic with ease and precision using this Employee Quarterly Sales And Revenue Generation Performance Chart Mockup PDF. This layout presents information on Performance, Sales, Revenue. It is also available for immediate download and adjustment. So, changes can be made in the color, design, graphics or any other component to create a unique layout.
-
Outcomes Summary Of Company Revenues Using Pie Chart Icons PDF
This slide focuses on graphical representation of revenues earned by company which includes media such as print advertising, electronic-media, events, paid subscriptions , custom publishing, etc.Pitch your topic with ease and precision using this Outcomes Summary Of Company Revenues Using Pie Chart Icons PDF This layout presents information on Custom Publishing, Paid Subscriptions, Revenues Are Generated It is also available for immediate download and adjustment. So, changes can be made in the color, design, graphics or any other component to create a unique layout.
-
Customizable Circle Charts For Revenue Split Of The Company Graphics PDF
Showcasing this set of slides titled Customizable Circle Charts For Revenue Split Of The Company Graphics PDF The topics addressed in these templates are Customizable Circle, Charts Revenue, Split Company All the content presented in this PPT design is completely editable. Download it and make adjustments in color, background, font etc. as per your unique business setting.
-
Customizable Circle Charts Of Revenue Split By Geography Elements PDF
Showcasing this set of slides titled Customizable Circle Charts Of Revenue Split By Geography Elements PDF The topics addressed in these templates are Customizable Circle, Charts Revenue, Split Geography All the content presented in this PPT design is completely editable. Download it and make adjustments in color, background, font etc. as per your unique business setting.
-
Customizable Circle Charts Of Subscription Revenue Split Clipart PDF
Persuade your audience using this Customizable Circle Charts Of Subscription Revenue Split Clipart PDF This PPT design covers four stages, thus making it a great tool to use. It also caters to a variety of topics including Complete Plan, Premium Plan, Standard Plan Download this PPT design now to present a convincing pitch that not only emphasizes the topic but also showcases your presentation skills.
-
Customizable Circle Charts Showing Revenue From US Region Themes PDF
Pitch your topic with ease and precision using this Customizable Circle Charts Showing Revenue From US Region Themes PDF This layout presents information on Customizable Circle, Charts Showing, Revenue Region It is also available for immediate download and adjustment. So, changes can be made in the color, design, graphics or any other component to create a unique layout.
-
Growth Trend Chart Of Company Revenues Icon Slides PDF
Persuade your audience using this Growth Trend Chart Of Company Revenues Icon Slides PDF This PPT design covers Four stages, thus making it a great tool to use. It also caters to a variety of topics including Growth Trend, Chart Company, Revenues Icon Download this PPT design now to present a convincing pitch that not only emphasizes the topic but also showcases your presentation skills.
-
Non Life Insurance Analytics Agent Dashboard With Revenue Chart Infographics PDF
This slide illustrates insurance agent sales statistics. It includes his total proposals, total policies, total claims and monthly revenue graph etc. Showcasing this set of slides titled Non Life Insurance Analytics Agent Dashboard With Revenue Chart Infographics PDF. The topics addressed in these templates are Revenue, Cost, Total Proposals. All the content presented in this PPT design is completely editable. Download it and make adjustments in color, background, font etc. as per your unique business setting.
-
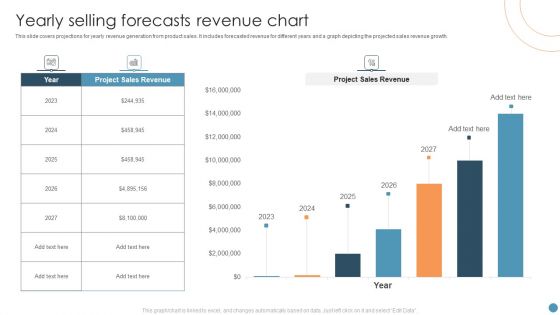
Yearly Selling Forecasts Revenue Chart Summary PDF
This slide covers projections for yearly revenue generation from product sales. It includes forecasted revenue for different years and a graph depicting the projected sales revenue growth. Showcasing this set of slides titled Yearly Selling Forecasts Revenue Chart Summary PDF. The topics addressed in these templates are Project Sales Revenue, Forecasts Revenue Chart. All the content presented in this PPT design is completely editable. Download it and make adjustments in color, background, font etc. as per your unique business setting.
-
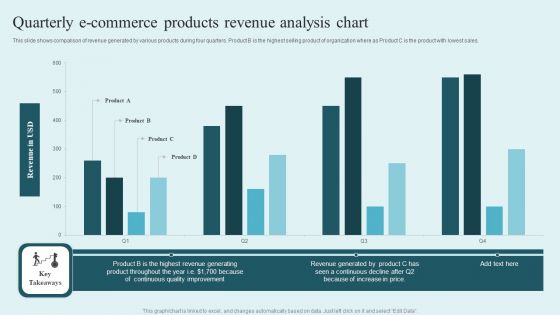
Quarterly E Commerce Products Revenue Analysis Chart Guidelines PDF
This slide shows comparison of revenue generated by various products during four quarters. Product B is the highest selling product of organization where as Product C is the product with lowest sales. Showcasing this set of slides titled Quarterly E Commerce Products Revenue Analysis Chart Guidelines PDF. The topics addressed in these templates are Revenue USD, Product, Continuous Quality Improvement. All the content presented in this PPT design is completely editable. Download it and make adjustments in color, background, font etc. as per your unique business setting.
-
Store Revenue Comparison Column Chart With Key Insights Themes PDF
This slide shows revenue generated by electronic and furniture products in various stores to examine differences in purchases at different store locations. It includes parts such as revenue generated and cities. Showcasing this set of slides titled Store Revenue Comparison Column Chart With Key Insights Themes PDF. The topics addressed in these templates are Revenue Generated, Furniture Sales, Increased Trend. All the content presented in this PPT design is completely editable. Download it and make adjustments in color, background, font etc. as per your unique business setting.
-
Market Chart Showing Revenue Breakdown Of FMCG Company Ppt Layouts Layouts PDF
This slide shows the percentage of revenue generated in fast moving consumable goods industry from different segments which are food products, households, personal, baby and hair care, OTC products and others. Showcasing this set of slides titled Market Chart Showing Revenue Breakdown Of FMCG Company Ppt Layouts Layouts PDF. The topics addressed in these templates are Food Products, Personal Care, Households. All the content presented in this PPT design is completely editable. Download it and make adjustments in color, background, font etc. as per your unique business setting.
-
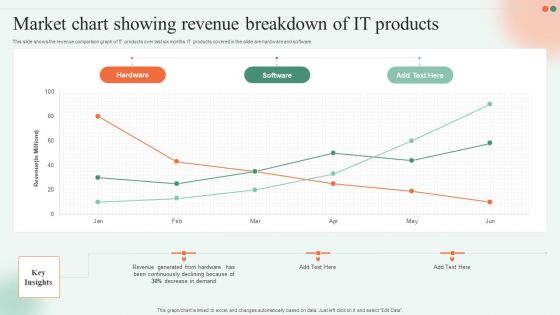
Market Chart Showing Revenue Breakdown Of IT Products Ppt File Elements PDF
This slide shows the revenue comparison graph of IT products over last six months. IT products covered in the slide are hardware and software. Pitch your topic with ease and precision using this Market Chart Showing Revenue Breakdown Of IT Products Ppt File Elements PDF. This layout presents information on Hardware, Software, Key Insights. It is also available for immediate download and adjustment. So, changes can be made in the color, design, graphics or any other component to create a unique layout.
-
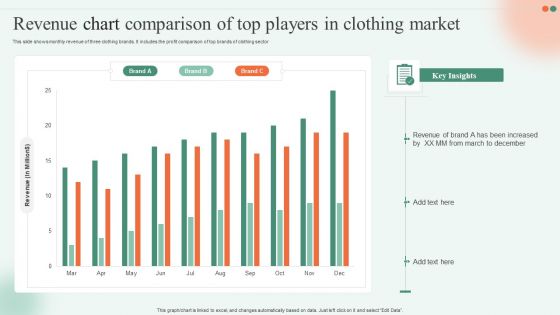
Revenue Chart Comparison Of Top Players In Clothing Market Ppt Infographics Skills PDF
This slide shows monthly revenue of three clothing brands. It includes the profit comparison of top brands of clothing sector Showcasing this set of slides titled Revenue Chart Comparison Of Top Players In Clothing Market Ppt Infographics Skills PDF. The topics addressed in these templates are Revenue, Brand, Key Insights. All the content presented in this PPT design is completely editable. Download it and make adjustments in color, background, font etc. as per your unique business setting.
-
Revenue Chart Of Abc Bank Across Global Market Ppt Icon Images PDF
This slide illustrates information about revenue generated by ABC bank in last eight years across global market. Continuous digitalization is the main contributing factor for the same. Pitch your topic with ease and precision using this Revenue Chart Of Abc Bank Across Global Market Ppt Icon Images PDF. This layout presents information on Continuous Digitalization, 2016 To 2023, Revenue. It is also available for immediate download and adjustment. So, changes can be made in the color, design, graphics or any other component to create a unique layout.
-
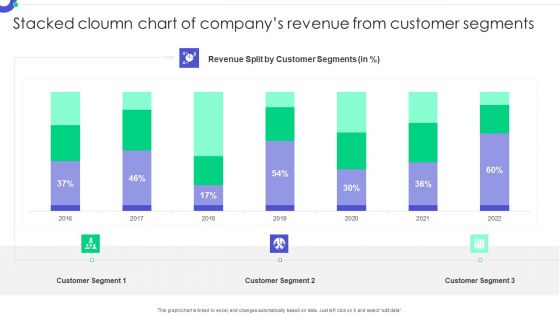
Stacked Cloumn Chart Of Companys Revenue From Customer Segments Mockup PDF
Showcasing this set of slides titled Stacked Cloumn Chart Of Companys Revenue From Customer Segments Mockup PDF. The topics addressed in these templates are Customer Segments, Revenue Split, Customer Segment. All the content presented in this PPT design is completely editable. Download it and make adjustments in color, background, font etc. as per your unique business setting.
-
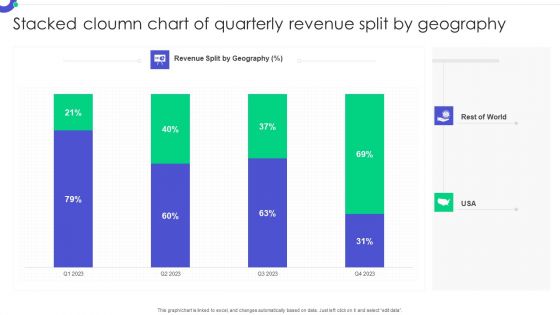
Stacked Cloumn Chart Of Quarterly Revenue Split By Geography Pictures PDF
Pitch your topic with ease and precision using this Stacked Cloumn Chart Of Quarterly Revenue Split By Geography Pictures PDF. This layout presents information on Stacked Column, Chart Quarterly, Revenue Split. It is also available for immediate download and adjustment. So, changes can be made in the color, design, graphics or any other component to create a unique layout.
-
Stacked Column Chart Of Revenue Split Of Cosmetic Products Mockup PDF
Showcasing this set of slides titled Stacked Column Chart Of Revenue Split Of Cosmetic Products Mockup PDF. The topics addressed in these templates are Stacked Column, Chart Revenue, Split Cosmetic Products. All the content presented in this PPT design is completely editable. Download it and make adjustments in color, background, font etc. as per your unique business setting.
-
Stacked Column Chart Of Revenue Breakup By Geographic Segments Microsoft PDF
Showcasing this set of slides titled Stacked Column Chart Of Revenue Breakup By Geographic Segments Microsoft PDF. The topics addressed in these templates are Stacked Column, Chart Revenue, Breakup Geographic. All the content presented in this PPT design is completely editable. Download it and make adjustments in color, background, font etc. as per your unique business setting.
-
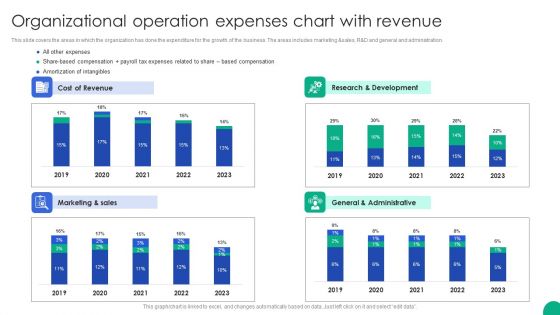
Organizational Operation Expenses Chart With Revenue Microsoft PDF
This slide covers the areas in which the organization has done the expenditure for the growth of the business. The areas includes marketing sales, R D and general and administration.Pitch your topic with ease and precision using this Organizational Operation Expenses Chart With Revenue Microsoft PDF. This layout presents information on Cost Revenue, Research Development, General Administrative. It is also available for immediate download and adjustment. So, changes can be made in the color, design, graphics or any other component to create a unique layout.
-
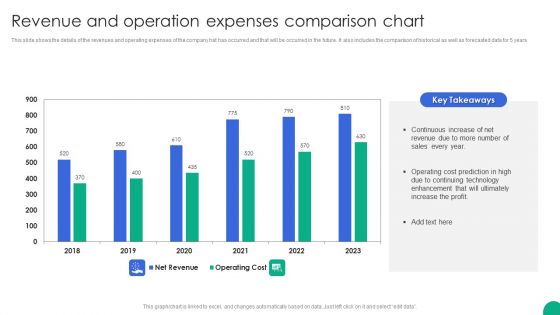
Revenue And Operation Expenses Comparison Chart Slides PDF
This slide shows the details of the revenues and operating expenses of the company hat has occurred and that will be occurred in the future. It also includes the comparison of historical as well as forecasted data for 5 years.Showcasing this set of slides titled Revenue And Operation Expenses Comparison Chart Slides PDF. The topics addressed in these templates are Continuous Increase, Operating Cost, Enhancement Ultimately. All the content presented in this PPT design is completely editable. Download it and make adjustments in color, background, font etc. as per your unique business setting.
-
Mom Recurring Revenue Growth Chart Themes PDF
The following slide presents a growth chart showing movement of monthly recurring revenue to forecast business performance. It includes key components such as net new MRR, churn MRR, contraction MRR, expansion MRR and new MRR. Showcasing this set of slides titled Mom Recurring Revenue Growth Chart Themes PDF. The topics addressed in these templates are MRR Churn Rate, Negative, MRR Growing Each Month. All the content presented in this PPT design is completely editable. Download it and make adjustments in color, background, font etc. as per your unique business setting.
-
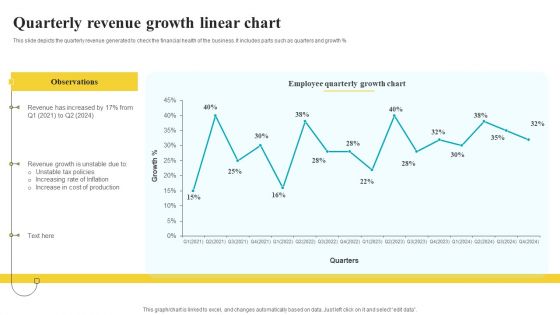
Quarterly Revenue Growth Linear Chart Elements PDF
This slide depicts the quarterly revenue generated to check the financial health of the business. It includes parts such as quarters and growth percent Showcasing this set of slides titled Quarterly Revenue Growth Linear Chart Elements PDF. The topics addressed in these templates are Observations, Growth Chart, Production. All the content presented in this PPT design is completely editable. Download it and make adjustments in color, background, font etc. as per your unique business setting.
-
Sales Process Automation For Revenue Growth Organization Chart Rules PDF
Presenting Sales Process Automation For Revenue Growth Organization Chart Rules PDF to provide visual cues and insights. Share and navigate important information on three stages that need your due attention. This template can be used to pitch topics like Organization Chart. In addtion, this PPT design contains high resolution images, graphics, etc, that are easily editable and available for immediate download.
-
Quarterly Sales Revenue Generation Performance Chart Icon Slides PDF
This graph or chart is linked to excel, and changes automatically based on data. Just left click on it and select edit data. Persuade your audience using this Quarterly Sales Revenue Generation Performance Chart Icon Slides PDF. This PPT design covers four stages, thus making it a great tool to use. It also caters to a variety of topics including Quarterly Sales Revenue, Generation Performance, Chart Icon. Download this PPT design now to present a convincing pitch that not only emphasizes the topic but also showcases your presentation skills.
-
5 Years Revenue Comparative Analysis Chart Icon Ppt Inspiration Diagrams PDF
Presenting 5 Years Revenue Comparative Analysis Chart Icon Ppt Inspiration Diagrams PDF to dispense important information. This template comprises three stages. It also presents valuable insights into the topics including 5 Years, Revenue Comparative, Analysis Chart, Icon. This is a completely customizable PowerPoint theme that can be put to use immediately. So, download it and address the topic impactfully.
-
Boosting Yearly Business Revenue Inventory Management Process Flow Chart Diagrams PDF
This slide shows diagram which can be used to represent the process of inventory or stock management in the organization. It includes various departs such as sales, product, quality control, purchasing and many other departments. Do you know about Slidesgeeks Boosting Yearly Business Revenue Inventory Management Process Flow Chart Diagrams PDF These are perfect for delivering any kind od presentation. Using it, create PowerPoint presentations that communicate your ideas and engage audiences. Save time and effort by using our pre-designed presentation templates that are perfect for a wide range of topic. Our vast selection of designs covers a range of styles, from creative to business, and are all highly customizable and easy to edit. Download as a PowerPoint template or use them as Google Slides themes.
-
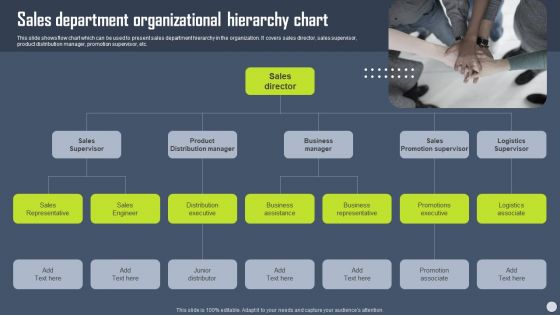
Boosting Yearly Business Revenue Sales Department Organizational Hierarchy Chart Sample PDF
This slide shows flow chart which can be used to present sales department hierarchy in the organization. It covers sales director, sales supervisor, product distribution manager, promotion supervisor, etc. Whether you have daily or monthly meetings, a brilliant presentation is necessary. Boosting Yearly Business Revenue Sales Department Organizational Hierarchy Chart Sample PDF can be your best option for delivering a presentation. Represent everything in detail using Boosting Yearly Business Revenue Sales Department Organizational Hierarchy Chart Sample PDF and make yourself stand out in meetings. The template is versatile and follows a structure that will cater to your requirements. All the templates prepared by Slidegeeks are easy to download and edit. Our research experts have taken care of the corporate themes as well. So, give it a try and see the results.
-
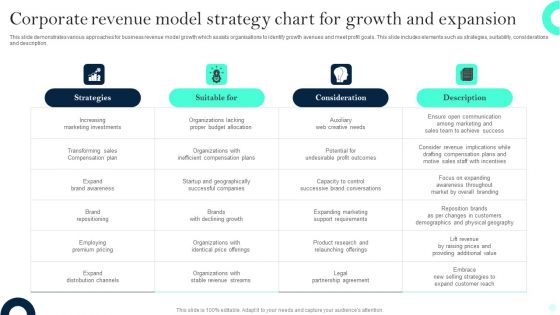
Corporate Revenue Model Strategy Chart For Growth And Expansion Topics PDF
This slide demonstrates various approaches for business revenue model growth which assists organisations to identify growth avenues and meet profit goals. This slide includes elements such as strategies, suitability, considerations and description. Pitch your topic with ease and precision using this Corporate Revenue Model Strategy Chart For Growth And Expansion Topics PDF. This layout presents information on Strategies, Consideration, Description. It is also available for immediate download and adjustment. So, changes can be made in the color, design, graphics or any other component to create a unique layout.
-
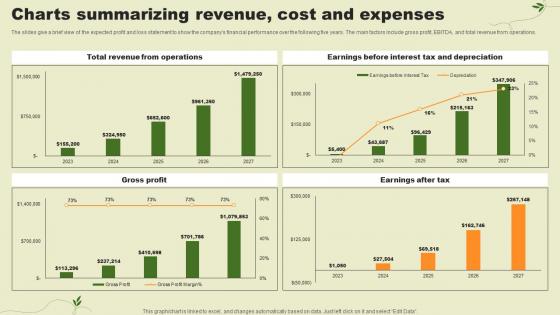
Lawn Care Services Business Plan Charts Summarizing Revenue Cost And Expenses BP SS V
The slides give a brief view of the expected profit and loss statement to show the companys financial performance over the following five years. The main factors include gross profit, EBITDA, and total revenue from operations. There are so many reasons you need a Lawn Care Services Business Plan Charts Summarizing Revenue Cost And Expenses BP SS V. The first reason is you can not spend time making everything from scratch, Thus, Slidegeeks has made presentation templates for you too. You can easily download these templates from our website easily.
-
Charts Summarizing Revenue Cost And Expenses Landscaping Business Plan Ppt Template BP SS V
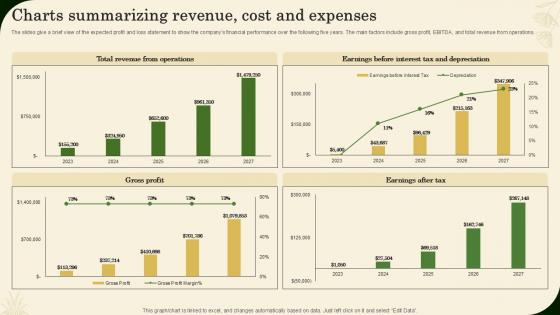
The slides give a brief view of the expected profit and loss statement to show the companys financial performance over the following five years. The main factors include gross profit, EBITDA, and total revenue from operations. Want to ace your presentation in front of a live audience Our Charts Summarizing Revenue Cost And Expenses Landscaping Business Plan Ppt Template BP SS V can help you do that by engaging all the users towards you. Slidegeeks experts have put their efforts and expertise into creating these impeccable powerpoint presentations so that you can communicate your ideas clearly. Moreover, all the templates are customizable, and easy-to-edit and downloadable. Use these for both personal and commercial use.


