Charts and graphs PowerPoint Presentation Templates and Google Slides
-
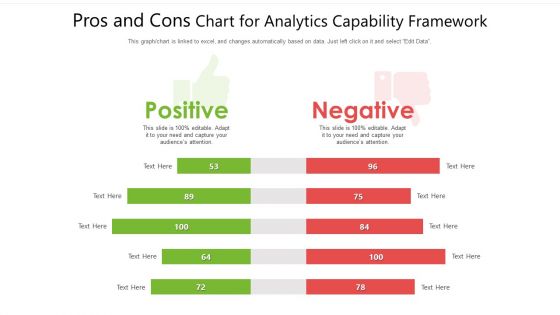
Pros And Cons Chart For Analytics Capability Framework Ppt PowerPoint Presentation File Graphics Download PDF
Presenting pros and cons chart for analytics capability framework ppt powerpoint presentation file graphics download pdf to dispense important information. This template comprises two stages. It also presents valuable insights into the topics including positive, negative. This is a completely customizable PowerPoint theme that can be put to use immediately. So, download it and address the topic impactfully.
-
Sales Steps Process With Gear And Bar Chart Vector Icon Ppt PowerPoint Presentation Infographics Graphics Design PDF
Presenting sales steps process with gear and bar chart vector icon ppt powerpoint presentation infographics graphics design pdf to dispense important information. This template comprises three stages. It also presents valuable insights into the topics including sales steps process with gear and bar chart vector icon. This is a completely customizable PowerPoint theme that can be put to use immediately. So, download it and address the topic impactfully.
-
Sales Performance Report With Charts And Graphs Ppt PowerPoint Presentation Icon Master Slide PDF
Presenting sales performance report with charts and graphs ppt powerpoint presentation icon master slide pdf to dispense important information. This template comprises three stages. It also presents valuable insights into the topics including sales performance report with charts and graphs. This is a completely customizable PowerPoint theme that can be put to use immediately. So, download it and address the topic impactfully.
-
Shareholders Value Creation Chart With Current And Desired Rating Ppt Ideas Graphics Template PDF
Showcasing this set of slides titled shareholders value creation chart with current and desired rating ppt ideas graphics template pdf. The topics addressed in these templates are current rating, desired rating, action plan. All the content presented in this PPT design is completely editable. Download it and make adjustments in color, background, font etc. as per your unique business setting.
-
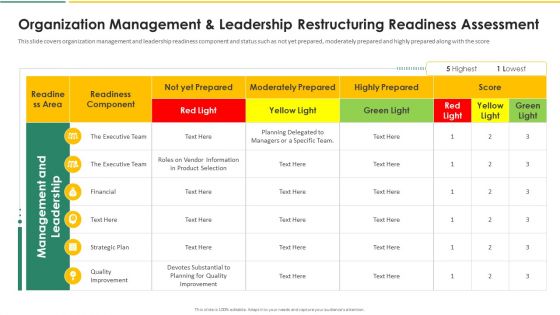
Organization Chart And Corporate Model Transformation Organization Management And Leadership Graphics PDF
This slide covers organization management and leadership readiness component and status such as not yet prepared, moderately prepared and highly prepared along with the score. Deliver an awe inspiring pitch with this creative organization chart and corporate model transformation organization management and leadership graphics pdf bundle. Topics like executive team, financial, strategic plan, quality improvement can be discussed with this completely editable template. It is available for immediate download depending on the needs and requirements of the user.
-
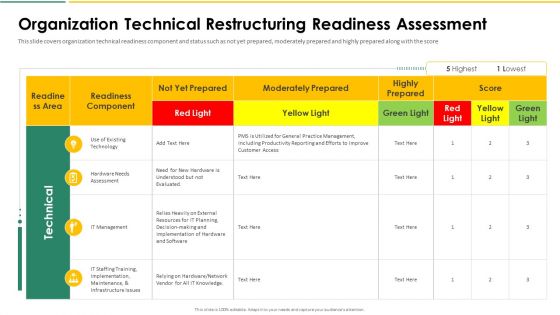
Organization Chart And Corporate Model Transformation Organization Technical Restructuring Graphics PDF
This slide covers organization technical readiness component and status such as not yet prepared, moderately prepared and highly prepared along with the score. Deliver an awe inspiring pitch with this creative organization chart and corporate model transformation organization technical restructuring graphics pdf bundle. Topics like use of existing technology, hardware needs assessment, it management, it staffing training, implementation, maintenance, infrastructure issues can be discussed with this completely editable template. It is available for immediate download depending on the needs and requirements of the user.
-
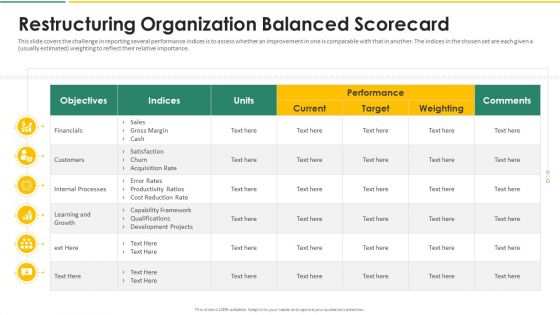
Organization Chart And Corporate Model Transformation Restructuring Organization Graphics PDF
This slide covers the timeline for restructuring the organization in four phases such as diagnose design develop and deliver. Deliver and pitch your topic in the best possible manner with this organization chart and corporate model transformation restructuring organization graphics pdf. Use them to share invaluable insights on diagnose, design, develop, deliver and impress your audience. This template can be altered and modified as per your expectations. So, grab it now.
-
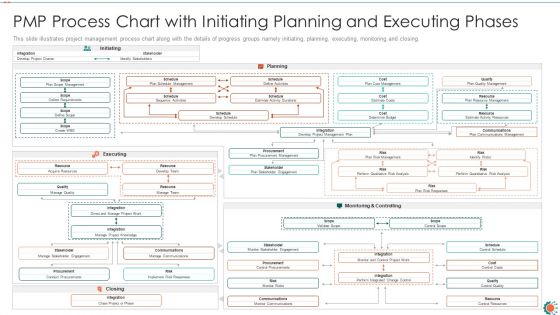
PMP Process Chart With Initiating Planning And Executing Phases Ppt Model Graphics Design PDF
This slide illustrates project management process chart along with the details of progress groups namely initiating, planning, executing, monitoring and closing. Deliver an awe inspiring pitch with this creative pmp procedure chart it poste it notes ppt portfolio guidelines pdf bundle. Topics like pmp process chart with initiating planning and executing phases can be discussed with this completely editable template. It is available for immediate download depending on the needs and requirements of the user.
-
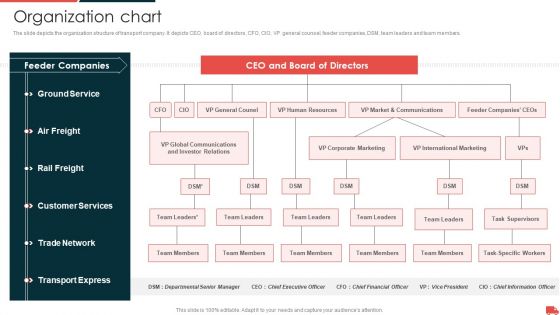
Transportation And Logistics Services Company Profile Organization Chart Graphics PDF
The slide depicts the organization structure of transport company. It depicts CEO, board of directors, CFO, CIO, VP general counsel, feeder companies, DSM, team leaders and team members. Presenting Transportation And Logistics Services Company Profile Organization Chart Graphics PDF to provide visual cues and insights. Share and navigate important information on six stages that need your due attention. This template can be used to pitch topics like Ground Service, Feeder Companies, Customer Services, Trade Network, Transport Express. In addtion, this PPT design contains high resolution images, graphics, etc, that are easily editable and available for immediate download.
-
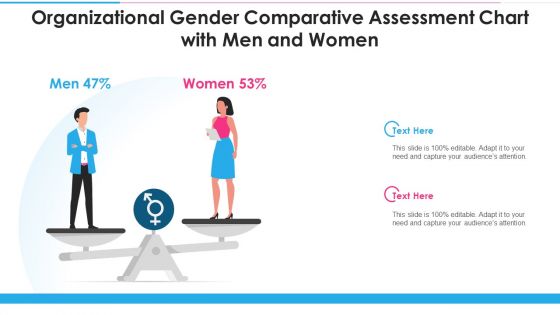
Organizational Gender Comparative Assessment Chart With Men And Women Graphics PDF
Persuade your audience using this organizational gender comparative assessment chart with men and women graphics pdf. This PPT design covers two stages, thus making it a great tool to use. It also caters to a variety of topics including organizational gender comparative assessment chart with men and women. Download this PPT design now to present a convincing pitch that not only emphasizes the topic but also showcases your presentation skills.
-
Project Efficiency Status Dashboard Icon With Graphs And Charts Demonstration PDF
Persuade your audience using this Project Efficiency Status Dashboard Icon With Graphs And Charts Demonstration PDF. This PPT design covers three stages, thus making it a great tool to use. It also caters to a variety of topics including Project Efficiency Status Dashboard Icon WITH Graphs AND Charts. Download this PPT design now to present a convincing pitch that not only emphasizes the topic but also showcases your presentation skills.
-
Security KPI Dashboard With Various Charts And Graphs Ppt Summary Background Image PDF
Persuade your audience using this Security KPI Dashboard With Various Charts And Graphs Ppt Summary Background Image PDF. This PPT design covers three stages, thus making it a great tool to use. It also caters to a variety of topics including Various Charts, Security KPI Dashboard, Graphs. Download this PPT design now to present a convincing pitch that not only emphasizes the topic but also showcases your presentation skills.
-
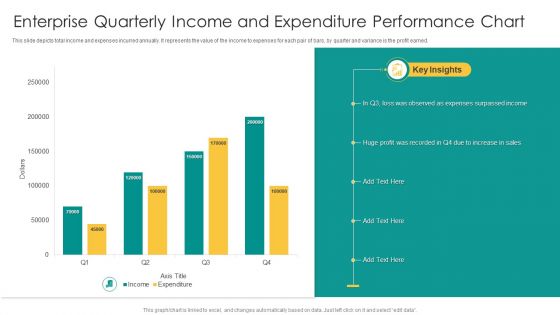
Enterprise Quarterly Income And Expenditure Performance Chart Graphics PDF
This slide depicts total income and expenses incurred annually. It represents the value of the income to expenses for each pair of bars, by quarter and variance is the profit earned. Pitch your topic with ease and precision using this Enterprise Quarterly Income And Expenditure Performance Chart Graphics PDF. This layout presents information on Expenses Surpassed Income, Sales, Huge Profit. It is also available for immediate download and adjustment. So, changes can be made in the color, design, graphics or any other component to create a unique layout.
-
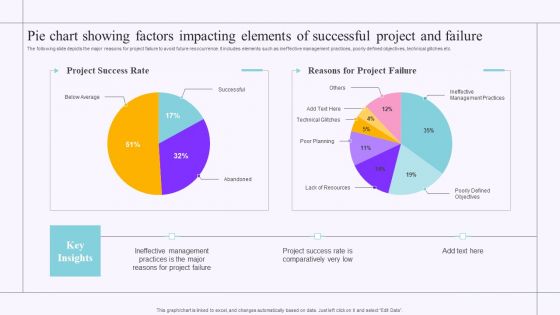
Pie Chart Showing Factors Impacting Elements Of Successful Project And Failure Graphics PDF
The following slide depicts the major reasons for project failure to avoid future reoccurrence. It includes elements such as ineffective management practices, poorly defined objectives, technical glitches etc. Showcasing this set of slides titled Pie Chart Showing Factors Impacting Elements Of Successful Project And Failure Graphics PDF. The topics addressed in these templates are Pie Chart Showing Factors, Impacting Elements, Successful Project And Failure. All the content presented in this PPT design is completely editable. Download it and make adjustments in color, background, font etc. as per your unique business setting.
-
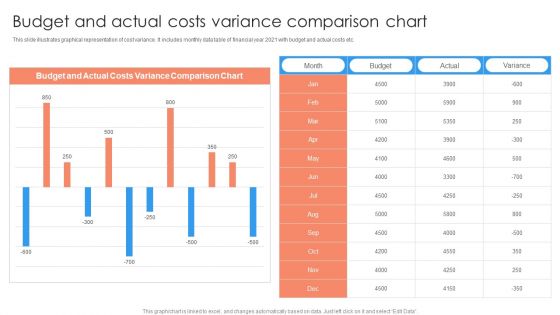
Budget And Actual Costs Variance Comparison Chart Ppt PowerPoint Presentation Show Graphics Example PDF
This slide illustrates graphical representation of cost variance. It includes monthly data table of financial year 2021 with budget and actual costs etc.Showcasing this set of slides titled Budget And Actual Costs Variance Comparison Chart Ppt PowerPoint Presentation Show Graphics Example PDF. The topics addressed in these templates are Budget And Actual, Costs Variance, Comparison Chart. All the content presented in this PPT design is completely editable. Download it and make adjustments in color, background, font etc. as per your unique business setting.
-
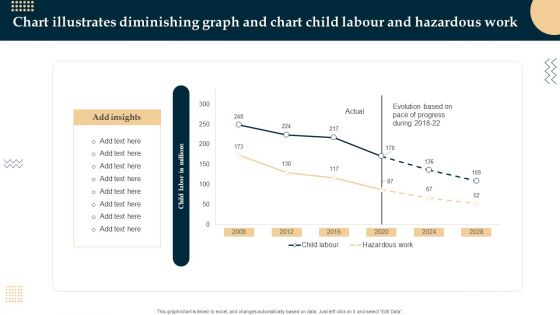
Chart Illustrates Diminishing Graph And Chart Child Labour And Hazardous Work Inspiration PDF
Showcasing this set of slides titled Chart Illustrates Diminishing Graph And Chart Child Labour And Hazardous Work Inspiration PDF. The topics addressed in these templates are Chart Illustrates Diminishing Graph, Hazardous Work, Chart Child Labour. All the content presented in this PPT design is completely editable. Download it and make adjustments in color, background, font etc. as per your unique business setting.
-
Chart Illustrates Diminishing Graph And Chart Employment Share In Manufacturing Diagrams PDF
Pitch your topic with ease and precision using this Chart Illustrates Diminishing Graph And Chart Employment Share In Manufacturing Diagrams PDF. This layout presents information on Chart Employment, Share In Manufacturing, Chart Illustrates Diminishing Graph. It is also available for immediate download and adjustment. So, changes can be made in the color, design, graphics or any other component to create a unique layout.
-
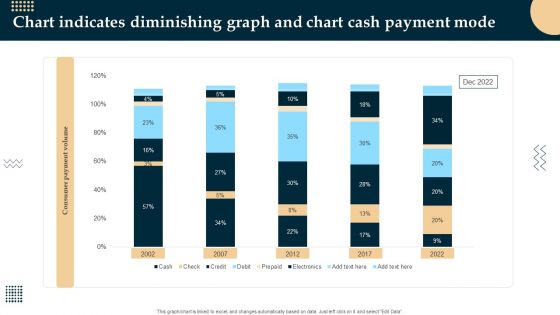
Chart Indicates Diminishing Graph And Chart Cash Payment Mode Inspiration PDF
Showcasing this set of slides titled Chart Indicates Diminishing Graph And Chart Cash Payment Mode Inspiration PDF. The topics addressed in these templates are Chart Indicates Diminishing Graph, Chart Cash Payment Mode. All the content presented in this PPT design is completely editable. Download it and make adjustments in color, background, font etc. as per your unique business setting.
-
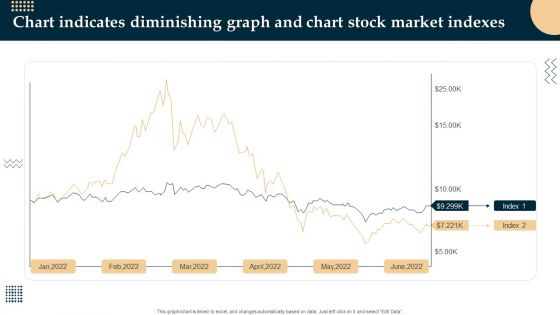
Chart Indicates Diminishing Graph And Chart Stock Market Indexes Themes PDF
Showcasing this set of slides titled Chart Indicates Diminishing Graph And Chart Stock Market Indexes Themes PDF. The topics addressed in these templates are Chart Indicates Diminishing Graph, Chart Stock Market Indexes. All the content presented in this PPT design is completely editable. Download it and make adjustments in color, background, font etc. as per your unique business setting.
-
Diminishing Graph And Chart Highlighting Pandemic Impact On GDP Sample PDF
Pitch your topic with ease and precision using this Diminishing Graph And Chart Highlighting Pandemic Impact On GDP Sample PDF. This layout presents information on Diminishing Graph, Chart Highlighting Pandemic. It is also available for immediate download and adjustment. So, changes can be made in the color, design, graphics or any other component to create a unique layout.
-
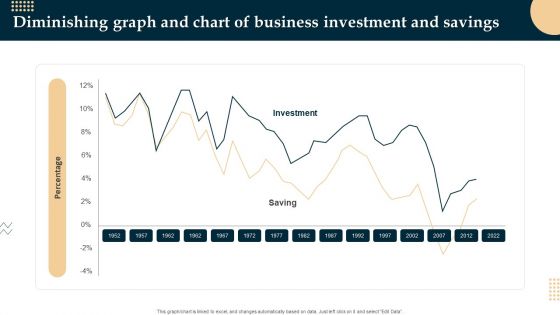
Diminishing Graph And Chart Of Business Investment And Savings Demonstration PDF
Showcasing this set of slides titled Diminishing Graph And Chart Of Business Investment And Savings Demonstration PDF. The topics addressed in these templates are Diminishing Graph, Chart Of Business Investment. All the content presented in this PPT design is completely editable. Download it and make adjustments in color, background, font etc. as per your unique business setting.
-
Trend Chart Depicting Diminishing Graph And Chart Sales And Production Structure PDF
Pitch your topic with ease and precision using this Trend Chart Depicting Diminishing Graph And Chart Sales And Production Structure PDF. This layout presents information on Trend Chart Depicting, Diminishing Graph, Chart Sales And Production. It is also available for immediate download and adjustment. So, changes can be made in the color, design, graphics or any other component to create a unique layout.
-
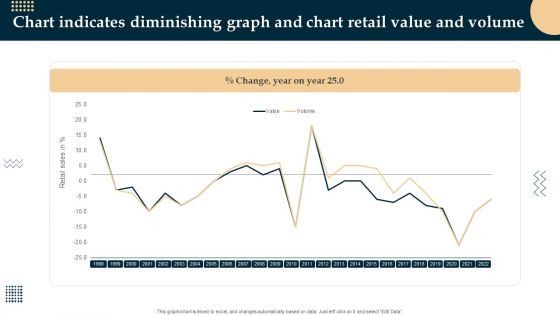
Chart Indicates Diminishing Graph And Chart Retail Value And Volume Download PDF
Pitch your topic with ease and precision using this Chart Indicates Diminishing Graph And Chart Retail Value And Volume Download PDF. This layout presents information on Chart Indicates Diminishing Graph, Chart Retail Value And Volume. It is also available for immediate download and adjustment. So, changes can be made in the color, design, graphics or any other component to create a unique layout.
-
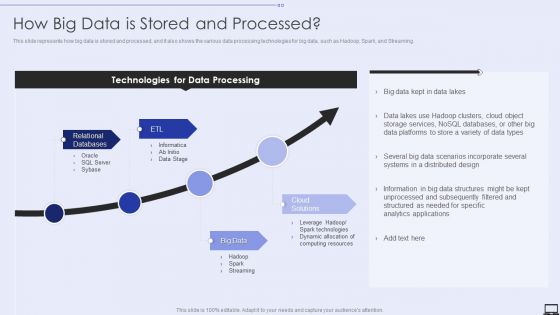
How Big Data Is Stored And Processe Ppt PowerPoint Presentation Diagram Graph Charts PDF
Presenting How Big Data Is Stored And Processe Ppt PowerPoint Presentation Diagram Graph Charts PDF to provide visual cues and insights. Share and navigate important information on four stages that need your due attention. This template can be used to pitch topics like Relational Databases, Big Data, Cloud Solutions. In addtion, this PPT design contains high resolution images, graphics, etc, that are easily editable and available for immediate download.
-
5 Years Profit And Loss Comparative Analysis Chart Of Enterprise Ppt Icon Graphics PDF
This slide represents the comparison of profit and loss of an organization for the five years. It includes details related to profit and loss from various accounts such as order fees, concession income, facility rental etc. Pitch your topic with ease and precision using this 5 Years Profit And Loss Comparative Analysis Chart Of Enterprise Ppt Icon Graphics PDF. This layout presents information on Account, 2018 To 2022, Exchange Fees. It is also available for immediate download and adjustment. So, changes can be made in the color, design, graphics or any other component to create a unique layout.
-
Reasons To Invest In Green Energy Clean And Renewable Energy Ppt PowerPoint Presentation Diagram Graph Charts PDF
This slide illustrates why people, organizations, and governments should invest in green energy by describing the impact of fossil fuels and non-renewable energies.Presenting Reasons To Invest In Green Energy Clean And Renewable Energy Ppt PowerPoint Presentation Diagram Graph Charts PDF to provide visual cues and insights. Share and navigate important information on two stages that need your due attention. This template can be used to pitch topics like Problems Traditional, Energy Sources, Solutions Provided. In addtion, this PPT design contains high resolution images, graphics, etc, that are easily editable and available for immediate download.
-
Chart Icon Illustrates Diminishing Graph And Chart Company Sales Professional PDF
Presenting Chart Icon Illustrates Diminishing Graph And Chart Company Sales Professional PDF to dispense important information. This template comprises four stages. It also presents valuable insights into the topics including Chart Icon Illustrates Diminishing, Graph Chart Company Sales. This is a completely customizable PowerPoint theme that can be put to use immediately. So, download it and address the topic impactfully.
-
Diminishing Graph And Chart Icon With Arrow Sign Clipart PDF
Presenting Diminishing Graph And Chart Icon With Arrow Sign Clipart PDF to dispense important information. This template comprises four stages. It also presents valuable insights into the topics including Diminishing Graph, Chart Icon With Arrow Sign. This is a completely customizable PowerPoint theme that can be put to use immediately. So, download it and address the topic impactfully.
-
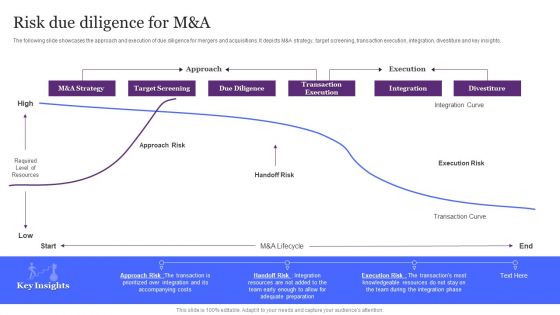
Risk Due Diligence For M And A Ppt Diagram Graph Charts PDF
The following slide showcases the approach and execution of due diligence for mergers and acquisitions. It depicts M and A strategy, target screening, transaction execution, integration, divestiture and key insights. Showcasing this set of slides titled Risk Due Diligence For M And A Ppt Diagram Graph Charts PDF. The topics addressed in these templates are Approach Risk, Handoff Risk, Execution Risk, Transaction Curve. All the content presented in this PPT design is completely editable. Download it and make adjustments in color, background, font etc. as per your unique business setting.
-
Financial R2R Icon With Graph And Chart Ppt PowerPoint Presentation Slides Design Inspiration PDF
Presenting Financial R2R Icon With Graph And Chart Ppt PowerPoint Presentation Slides Design Inspiration PDF to dispense important information. This template comprises three stages. It also presents valuable insights into the topics including Financial R2r Icon, Graph Chart. This is a completely customizable PowerPoint theme that can be put to use immediately. So, download it and address the topic impactfully.
-
Weekly KPI Attain Production Goals And Objectives Chart Ppt Icon Graphics Template PDF
This slide showcases the manufacturing target achievement table. It can be used for evaluating the variance between actual and estimated KPIs such as throughput rate, inventory turns, scarp rate, etc. Showcasing this set of slides titled Weekly KPI Attain Production Goals And Objectives Chart Ppt Icon Graphics Template PDF. The topics addressed in these templates are Target, KPI, Inventory Turns. All the content presented in this PPT design is completely editable. Download it and make adjustments in color, background, font etc. as per your unique business setting.
-
Website Development Process With Key Roles And Responsibilities Ppt Diagram Graph Charts PDF
The following slide illustrates the process of website development along with roles and responsibilities of team. It majorly includes design, front end and back end development team. Persuade your audience using this Website Development Process With Key Roles And Responsibilities Ppt Diagram Graph Charts PDF. This PPT design covers three stages, thus making it a great tool to use. It also caters to a variety of topics including Back End Development, Team, Front End, Development Team. Download this PPT design now to present a convincing pitch that not only emphasizes the topic but also showcases your presentation skills.
-
Breakdown By Area In Pie Chart And Graph Introduction PDF
Showcasing this set of slides titled Breakdown By Area In Pie Chart And Graph Introduction PDF. The topics addressed in these templates are Break Down, Area Pie, Chart Graph. All the content presented in this PPT design is completely editable. Download it and make adjustments in color, background, font etc. as per your unique business setting.
-
Digital Money Cash Inflow And Outflow Icon Ppt PowerPoint Presentation Diagram Graph Charts PDF
Presenting Digital Money Cash Inflow And Outflow Icon Ppt PowerPoint Presentation Diagram Graph Charts PDF to dispense important information. This template comprises three stages. It also presents valuable insights into the topics including Digital Money, Cash Inflow, Outflow Icon. This is a completely customizable PowerPoint theme that can be put to use immediately. So, download it and address the topic impactfully.
-
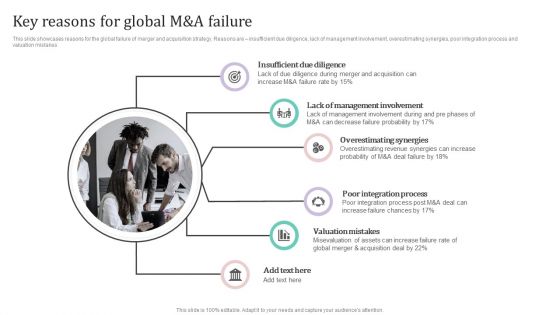
Key Reasons For Global M And A Failure Ppt PowerPoint Presentation Diagram Graph Charts PDF
This slide showcases reasons for the global failure of merger and acquisition strategy. Reasons are insufficient due diligence, lack of management involvement, overestimating synergies, poor integration process and valuation mistakes.Find highly impressive Key Reasons For Global M And A Failure Ppt PowerPoint Presentation Diagram Graph Charts PDF on Slidegeeks to deliver a meaningful presentation. You can save an ample amount of time using these presentation templates. No need to worry to prepare everything from scratch because Slidegeeks experts have already done a huge research and work for you. You need to download Key Reasons For Global M And A Failure Ppt PowerPoint Presentation Diagram Graph Charts PDF for your upcoming presentation. All the presentation templates are 100precent editable and you can change the color and personalize the content accordingly. Download now.
-
Difference Between Artificial And Augmented Intelligence Ppt PowerPoint Presentation Diagram Graph Charts PDF
This slide outlines the difference between augmented and artificial intelligence based on the factors such as the need of humans, approach, mode focus, and decision making. Here you can discover an assortment of the finest PowerPoint and Google Slides templates. With these templates, you can create presentations for a variety of purposes while simultaneously providing your audience with an eye catching visual experience. Download Difference Between Artificial And Augmented Intelligence Ppt PowerPoint Presentation Diagram Graph Charts PDF to deliver an impeccable presentation. These templates will make your job of preparing presentations much quicker, yet still, maintain a high level of quality. Slidegeeks has experienced researchers who prepare these templates and write high quality content for you. Later on, you can personalize the content by editing the Difference Between Artificial And Augmented Intelligence Ppt PowerPoint Presentation Diagram Graph Charts PDF.
-
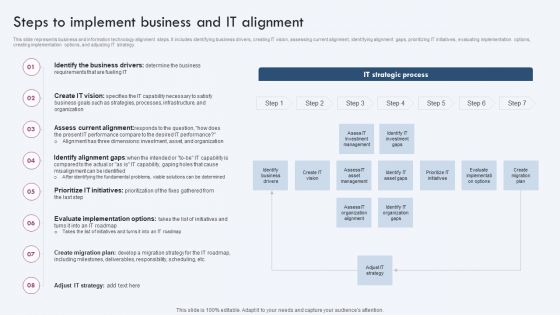
Steps To Implement Business And IT Alignment Ppt PowerPoint Presentation Diagram Graph Charts PDF
This slide represents business and information technology alignment steps. It includes identifying business drivers, creating IT vision, assessing current alignment, identifying alignment gaps, prioritizing IT initiatives, evaluating implementation options, creating implementation options, and adjusting IT strategy. Crafting an eye catching presentation has never been more straightforward. Let your presentation shine with this tasteful yet straightforward Steps To Implement Business And IT Alignment Ppt PowerPoint Presentation Diagram Graph Charts PDF template. It offers a minimalistic and classy look that is great for making a statement. The colors have been employed intelligently to add a bit of playfulness while still remaining professional. Construct the ideal Steps To Implement Business And IT Alignment Ppt PowerPoint Presentation Diagram Graph Charts PDF that effortlessly grabs the attention of your audience Begin now and be certain to wow your customers.
-
Impact Of Cyber Security Policies And Practices Ppt PowerPoint Presentation Diagram Graph Charts PDF
The following slide focuses on drafting cyber security policies to manage data control and breach. It mainly includes elements such as impact of existing cyber safety policies, mitigation actions, Presenting this PowerPoint presentation, titled Impact Of Cyber Security Policies And Practices Ppt PowerPoint Presentation Diagram Graph Charts PDF, with topics curated by our researchers after extensive research. This editable presentation is available for immediate download and provides attractive features when used. Download now and captivate your audience. Presenting this Impact Of Cyber Security Policies And Practices Ppt PowerPoint Presentation Diagram Graph Charts PDF. Our researchers have carefully researched and created these slides with all aspects taken into consideration. This is a completely customizable Impact Of Cyber Security Policies And Practices Ppt PowerPoint Presentation Diagram Graph Charts PDF that is available for immediate downloading. Download now and make an impact on your audience. Highlight the attractive features available with our PPTs.
-
Adjusting Financial Strategies And Planning Assessment Of Working Capital Modelling Chart Graphics PDF
This slide provides glimpse about model of managing cashflows in the business that can help in timely payments to creditors. It includes trade debtors account, trade creditors account, working capital adjustments, etc. Crafting an eye catching presentation has never been more straightforward. Let your presentation shine with this tasteful yet straightforward Adjusting Financial Strategies And Planning Assessment Of Working Capital Modelling Chart Graphics PDF template. It offers a minimalistic and classy look that is great for making a statement. The colors have been employed intelligently to add a bit of playfulness while still remaining professional. Construct the ideal Adjusting Financial Strategies And Planning Assessment Of Working Capital Modelling Chart Graphics PDF that effortlessly grabs the attention of your audience. Begin now and be certain to wow your customers.
-
FDDI Architecture And Its Working Ppt PowerPoint Presentation Diagram Graph Charts PDF
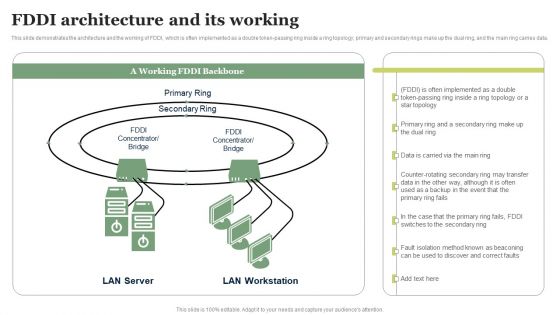
This slide demonstrates the architecture and the working of FDDI, which is often implemented as a double token-passing ring inside a ring topology primary and secondary rings make up the dual ring, and the main ring carries data. Here you can discover an assortment of the finest PowerPoint and Google Slides templates. With these templates, you can create presentations for a variety of purposes while simultaneously providing your audience with an eye catching visual experience. Download FDDI Architecture And Its Working Ppt PowerPoint Presentation Diagram Graph Charts PDF to deliver an impeccable presentation. These templates will make your job of preparing presentations much quicker, yet still, maintain a high level of quality. Slidegeeks has experienced researchers who prepare these templates and write high quality content for you. Later on, you can personalize the content by editing the FDDI Architecture And Its Working Ppt PowerPoint Presentation Diagram Graph Charts PDF.
-
Comprehensive Business Overview With Mission And Core Values Ppt PowerPoint Presentation Diagram Graph Charts PDF
This slide provides glimpse about comprehensive summary of cosmetics and skin care company to provide current and background information. It includes overview, partners, core values, key facts, etc. Want to ace your presentation in front of a live audience Our Comprehensive Business Overview With Mission And Core Values Ppt PowerPoint Presentation Diagram Graph Charts PDF can help you do that by engaging all the users towards you. Slidegeeks experts have put their efforts and expertise into creating these impeccable powerpoint presentations so that you can communicate your ideas clearly. Moreover, all the templates are customizable, and easy to edit and downloadable. Use these for both personal and commercial use.
-
Company Shareholder Structure And Organizational Chart Graphics PDF
The slide carries a shareholder structure to represent the company ownerships. It shows division of company shares between companies which are company A, Company B, Company C, etc. Pitch your topic with ease and precision using this Company Shareholder Structure And Organizational Chart Graphics PDF. This layout presents information on Company Shareholder Structure, Organizational Chart. It is also available for immediate download and adjustment. So, changes can be made in the color, design, graphics or any other component to create a unique layout.
-
Key Texting And SMS Marketing Statistics Ppt PowerPoint Presentation Diagram Graph Charts PDF
This slide represents the statistical data to help marketers analyze the benefits and importance of SMS marketing for business growth and development. It includes key SMS marketing statistics such as click through rates, opt-ins etc. Get a simple yet stunning designed Key Texting And SMS Marketing Statistics Ppt PowerPoint Presentation Diagram Graph Charts PDF. It is the best one to establish the tone in your meetings. It is an excellent way to make your presentations highly effective. So, download this PPT today from Slidegeeks and see the positive impacts. Our easy to edit Key Texting And SMS Marketing Statistics Ppt PowerPoint Presentation Diagram Graph Charts PDF can be your go to option for all upcoming conferences and meetings. So, what are you waiting for Grab this template today.
-
Cyber Security Event And Incident Management Ppt Powerpoint Presentation Diagram Graph Charts Pdf
This slide represents the architecture showing the procedure of managing cyber security incidents in order to minimize its impact on business operations. It starts with detection of cyber security incident and ends with response to crisis situation. Are you in need of a template that can accommodate all of your creative concepts This one is crafted professionally and can be altered to fit any style. Use it with Google Slides or PowerPoint. Include striking photographs, symbols, depictions, and other visuals. Fill, move around, or remove text boxes as desired. Test out color palettes and font mixtures. Edit and save your work, or work with colleagues. Download Cyber Security Event And Incident Management Ppt Powerpoint Presentation Diagram Graph Charts Pdf and observe how to make your presentation outstanding. Give an impeccable presentation to your group and make your presentation unforgettable.


