Business pie graph PowerPoint Presentation Templates and Google Slides
-
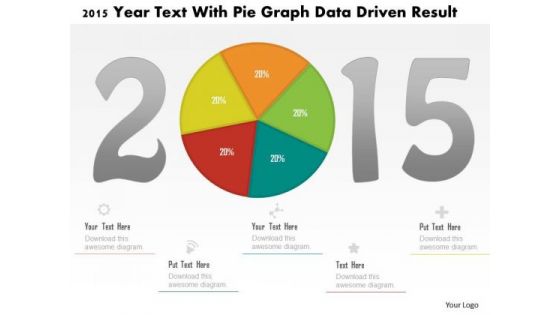
Business Diagram 2015 Year Text With Pie Graph Data Driven Result PowerPoint Slide
This business diagram displays 2015 year numbers with pie chart. This diagram is suitable to display business strategy for year 2015. Download this professional slide to present information in an attractive manner
-
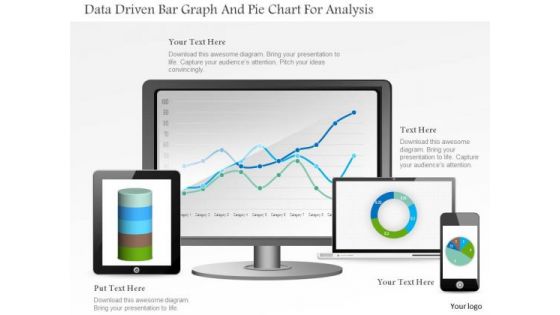
Business Diagram Data Driven Bar Graph And Pie Chart For Analysis PowerPoint Slide
This PowerPoint template displays technology gadgets with various business charts. Use this diagram slide, in your presentations to make business reports for statistical analysis. You may use this diagram to impart professional appearance to your presentations.
-
Business Diagram Human Mind Diagram With Pie Graph For Representation PowerPoint Slide
This diagram displays human face graphic divided into sections. This section can be used for data display. Use this diagram to build professional presentations for your viewers.
-
Business Diagram Tablet With Pie And Business Bar Graph For Result Analysis PowerPoint Slide
This PowerPoint template displays technology gadgets with various business charts. Use this diagram slide, in your presentations to make business reports for statistical analysis. You may use this diagram to impart professional appearance to your presentations.
-
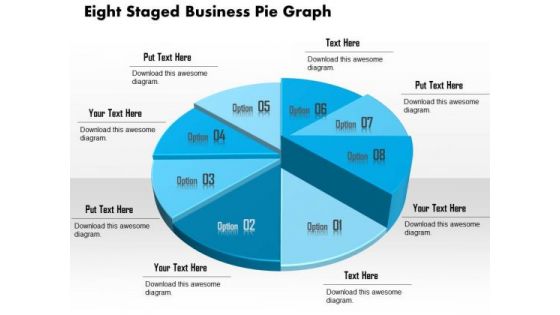
Business Diagram Eight Staged Business Pie Graph Presentation Template
This business slide displays eight staged pie chart. This diagram is a data visualization tool that gives you a simple way to present statistical information. This slide helps your audience examine and interpret the data you present.
-
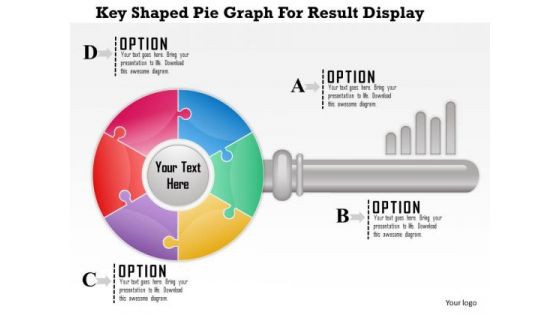
Business Diagram Key Shaped Pie Graph For Result Display Presentation Template
Key shaped pie graph has been used to design this business diagram. This slide has key graphic with abcd options. Use this amazing slide to present a business plan. Download this slide to impress your viewers.
-
Business Diagram Nine Staged Pie Graph For Business Result Analysis Presentation Template
This business slide displays nine staged pie chart. This diagram is a data visualization tool that gives you a simple way to present statistical information. This slide helps your audience examine and interpret the data you present.
-
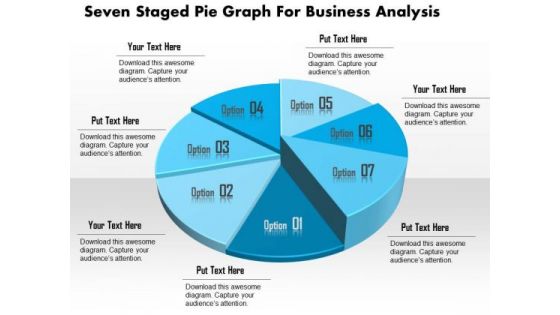
Business Diagram Seven Staged Pie Graph For Business Analysis Presentation Template
This business slide displays seven staged pie chart. This diagram is a data visualization tool that gives you a simple way to present statistical information. This slide helps your audience examine and interpret the data you present.
-
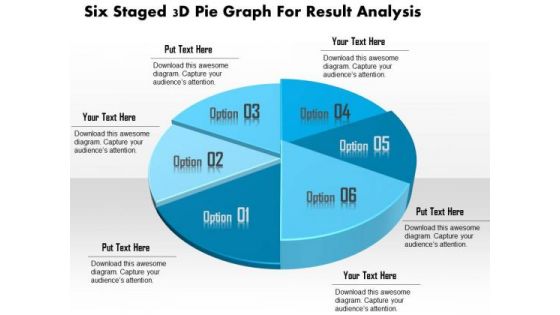
Business Diagram Six Staged 3d Pie Graph For Result Analysis Presentation Template
This business slide displays six staged pie chart. This diagram is a data visualization tool that gives you a simple way to present statistical information. This slide helps your audience examine and interpret the data you present.
-
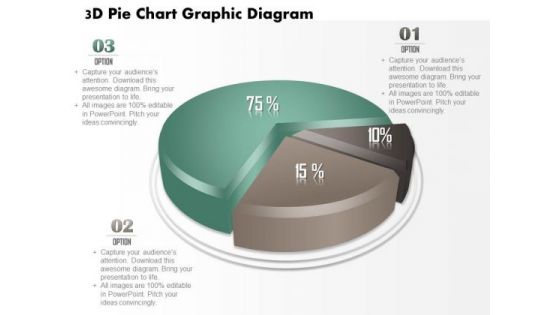
Business Diagram 3d Pie Chart Graphic Diagram PowerPoint Ppt Presentation
This business diagram displays 3d pie chart. It contains pie chart with percentage ratios. This pie chart is a visual way of displaying data. Use this diagram to make outstanding presentations.
-
Pie Graph Made With Puzzles And Business Icons PowerPoint Template
Create dynamic presentations with our professional template containing graphics of pie graph. Use this diagram to exhibit marketing strategy. Download this template to leave permanent impression on your audience.
-
Bar Graph And Pie Charts For Business Reports Vector Icon Ppt PowerPoint Presentation Show Graphics Tutorials PDF
Pitch your topic with ease and precision using this bar graph and pie charts for business reports vector icon ppt powerpoint presentation show graphics tutorials pdf. This layout presents information on bar graph and pie charts for business reports vector icon. It is also available for immediate download and adjustment. So, changes can be made in the color, design, graphics or any other component to create a unique layout.
-
Business Share In Market With Various Pie Graphs Ppt PowerPoint Presentation Gallery Skills PDF
Pitch your topic with ease and precision using this business share in market with various pie graphs ppt powerpoint presentation gallery skills pdf. This layout presents information on 2018 to 2020, business share, market, various pie graphs. It is also available for immediate download and adjustment. So, changes can be made in the color, design, graphics or any other component to create a unique layout.
-
Business Services Icon With Pie Graph And Dollar Sign Ppt Styles Good PDF
Pitch your topic with ease and precision using this business services icon with pie graph and dollar sign ppt styles good pdf. This layout presents information on business services icon with pie graph and dollar sign. It is also available for immediate download and adjustment. So, changes can be made in the color, design, graphics or any other component to create a unique layout.
-
Pie Graph Layer Presenting Business Expenses Topics PDF
Pitch your topic with ease and precision using this pie graph layer presenting business expenses topics pdf. This layout presents information on investment, material procurement, training, employees salary, factory rent. It is also available for immediate download and adjustment. So, changes can be made in the color, design, graphics or any other component to create a unique layout.
-
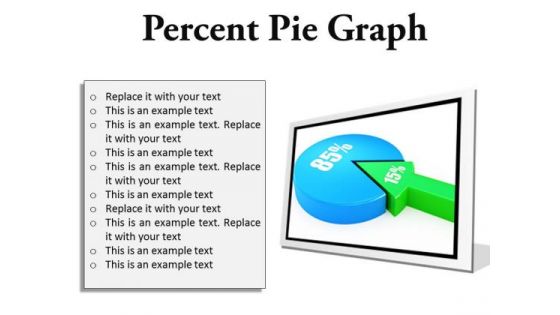
Percent Pie Graph Business PowerPoint Presentation Slides C
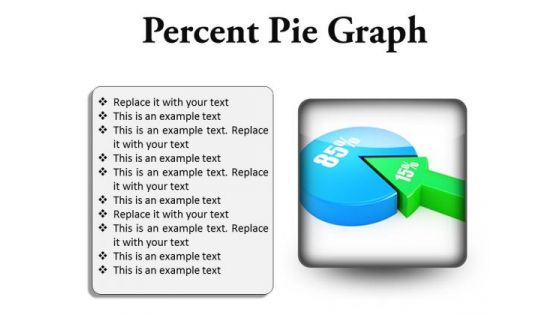
Microsoft PowerPoint Slides and Backgrounds with fifteen and eighty five percent proportion pie chart
-
Percent Pie Graph Business PowerPoint Presentation Slides Cc
Microsoft PowerPoint Slides and Backgrounds with fifteen and eighty five percent proportion pie chart
-
Percent Pie Graph Business PowerPoint Presentation Slides F
Microsoft PowerPoint Slides and Backgrounds with fifteen and eighty five percent proportion pie chart
-
Percent Pie Graph Business PowerPoint Presentation Slides R
Microsoft PowerPoint Slides and Backgrounds with fifteen and eighty five percent proportion pie chart
-
Percent Pie Graph Business PowerPoint Presentation Slides S
Microsoft PowerPoint Slides and Backgrounds with fifteen and eighty five percent proportion pie chart


